Anritsu MT1000A Operation Manual
Network master pro, multiplatform portable field testers
Hide thumbs
Also See for MT1000A:
- Remote scripting operation manual (996 pages) ,
- Operation manual (605 pages) ,
- Quick reference manual (36 pages)
Table of Contents
Advertisement
Quick Links
Advertisement
Table of Contents

Related Manuals for Anritsu MT1000A


Summary of Contents for Anritsu MT1000A
- Page 1 MT1000A MU100040A/MU100040B Network Master Pro Operation Manual First Edition For safety and warning information, please read this manual before attempting to use the equipment. Keep this manual with the equipment. ANRITSU COMPANY Document No. 10580-00443, Rev. A...
- Page 2 Operation Manual August 2017 (First Edition) © Copyright 2017, ANRITSU COMPANY All rights reserved. No part of this manual may be reproduced without the prior written permission of the publisher. The contents of this manual may be changed without prior notice.
-
Page 3: About This Manual
About This Manual The documentation for MT1000A Network Master Pro applies to the instrument with the MU100040A/MU100040B CPRI RF Module installed. This operation manual describes both the basic operation of the instrument and the operations available via interface options and predefined applications/tests. -
Page 5: Table Of Contents
Table of Contents 1 Introduction ........9 1.1 Mainframe . - Page 6 Table of Contents (Continued) 3.2.1 Turning the Power On ........35 3.2.1.1 AC Operation .
- Page 7 Table of Contents (Continued) 4.2.1 Instrument Toolbar ........59 4.2.1.1 Instrument Information .
- Page 8 Table of Contents (Continued) 5.4.6 Limit ..........94 5.4.6.1 Limit State .
-
Page 9: Introduction
1 Introduction This section provides a general introduction to the MT1000A Network Master Pro and describes the symbols and conventions used in this manual. It also includes safety and compliance information and terms of warranty. -
Page 10: Mainframe
Introduction 1.1 Mainframe The MT1000A Network Master Pro, also referred to as the Network Master or simply as “the instrument,” is a battery-powered multi-purpose telecommunications test instrument designed for a wide range of applications, from fast first-aid troubleshooting to comprehensive, in-depth analysis of transmission problems. The installed options enable the Network Master to be used both as a full-featured transmission line quality tester and as an advanced signal analyzer. -
Page 11: Symbols And Conventions
Some or all of the following symbols may be used on Anritsu equipment. There may be other labels attached to products that are not shown in this manual. -
Page 12: Notes
Introduction 1.4.3 Notes The Note symbol indicates information, procedures, or recommendations that need to be followed to make correct measurements, etc. Text is shown in italics to visually differentiate the note from other information. 1.4.4 Hints The Hint symbol indicates information that should be treated as user tips, suggestions, or recommendations. -
Page 13: Warnings
Calibration the factory. To ensure the continued integrity of the equipment, only service personnel from Anritsu or an authorized sales representative should break this seal to repair or calibrate the equipment. If the seal is broken by the user or an unauthorized third party, the performance of... - Page 14 Introduction WARNING • Use only approved replacement batteries. If the wrong type of battery is used or Replacing Battery the battery terminals are not positioned correctly, there is a risk of explosion causing severe injury or death. For California (USA) Only This product uses a CR Coin Lithium Battery which contains perchlorate material.
-
Page 15: Cautions
External Storage programs. If these media devices are mishandled or become faulty, data may be lost. You should regularly back up all of your important data and programs. Anritsu offers no warranty against lost data. • Never disconnect the USB device while data is being transmitted. -
Page 16: Cautions Against Computer Virus Infection
1.6.1 Cautions Against Computer Virus Infection Copying files and data Only files that have been provided directly by Anritsu or generated using Anritsu equipment should be copied to the instrument. All other files should be loaded only after a thorough virus scan. -
Page 17: Precautions
1.7.1 Electrostatic Discharge (ESD) Measurement modules and hardware options for the Network Master contain electronic components that are sensitive to ESD. All such items are shipped from Anritsu in anti-static shielding packages. Electrostatic discharge can seriously damage these devices and lead to equipment failure. -
Page 18: Fiber Optic Cables
Introduction 1.7.3 Fiber Optic Cables Improper handling of the cable may damage the optical fiber and degrade performance. CAUTION Do not pull on the cable when disconnecting the fiber. Grasp the connector instead. Pulling on the cable may break the optical fiber or cause other damage to the cable sheath and connector. - Page 19 Precautions CAUTION Handle optical fiber cables and connectors with care. Impact against a hard surface can damage the connector end and lead to signal loss. CAUTION Do not disassemble optical connectors. WARNING Do not touch the end of a broken optical fiber cable. The broken optical fiber may be sharp and pierce the skin.
-
Page 20: Ventilation
To avoid violating WLAN regulations, visit the Anritsu website to check where use is allowed. http://dl.cdn-anritsu.com/en-en/test-measurement/files/Brochures-Datasheets-Catalogs/B rochure/nmx-wlan-mt1000a-160407.pdf Anritsu cannot be held liable for any problem arising from WLAN use in other countries and regions. -
Page 21: Laser Safety
If this warning light does not turn on, the equipment may be faulty and should be returned to an Anritsu service center or authorized representative for repair. The laser in the module provided for this equipment is classified as Class 1, 1M, or 3R according to the IEC 60825-1:2007 standard. -
Page 22: Product Warranty
The warranty covers the original equipment purchaser only and is non-transferable. Anritsu assumes no liability for injury or financial loss resulting from the use of or failure to be able to use this equipment. -
Page 23: Configuration
2 Configuration This section provides instructions for connecting the power adapter, charging the battery, attaching the shoulder strap and handgrip, and for installing the measurement modules. -
Page 24: Accessories
Network Master connector panel. 2. Connect the AC plug of the power adapter to a live outlet. The Power button flashes rapidly in orange during boot-up. CAUTION To prevent instrument damage or personal injury, use only power adapters approved by Anritsu Company. -
Page 25: Rechargeable Battery
The typical operation capacity (with a fully charged battery) is approximately 6 hours. CAUTION To minimize the risk of instrument damage or personal injury, use only original batteries approved by Anritsu Company. 2.3.1 Initial Charging The battery may be partially charged or fully discharged upon delivery. It is recommended to charge the battery immediately after unpacking. -
Page 26: Charging The Battery
Configuration 5. Pull out the battery pack. 6. When inserting the battery pack, note the position of the battery terminals. With the instrument screen facing up and the battery compartment towards you, the terminals should be in the upper left corner. Push the battery in firmly for a secure connection. -
Page 27: Optical Fibers
Optical Fibers 2.4 Optical Fibers Remove the protective cap from the measurement port, then connect the optical fiber under test. CAUTION Never force the connector ferrule into the adapter or insert it at an angle. Optical fibers are susceptible to loss from minute bends or other stress. Connecting the fiber cable to the wrong port will result in failed or inaccurate measurements. -
Page 28: Tilt Bail And Shoulder Strap
Configuration 2.5 Tilt Bail and Shoulder Strap 2.5.1 Tilt Bail A tilt bail is attached to the back of the Network Master for improved stability when the instrument is set down. To deploy the tilt bail, pull the bottom of the tilt bail away from the back of the instrument. - Page 29 Tilt Bail and Shoulder Strap To attach the shoulder strap and handgrip to the MT1000A Network Master Pro: 1. Use a screwdriver or coin to unlock and remove the battery compartment cover. 2. Remove the battery pack. 3. Lay the instrument face down on a flat surface and remove the screw from each of the four corners.
- Page 30 Configuration 5. Remove the buckle cap from the handgrip and the shoulder strap. 6. Attach the strap ends to the top left and top right corners of the instrument. 7. Re-attach the module(s) to the main controller, then re-insert the battery pack and close the battery compartment cover.
-
Page 31: Attaching The Hardware Modules
If the OTDR module is present, it must be attached directly to the MT1000A controller. In a configuration that includes the OTDR, CPRI RF, and 10G Multirate modules, for example, attach the modules serially in that order, from front to back. - Page 32 Configuration 6. Depending on the option configuration you purchased and the number of measurement modules installed, you may need to replace the four screws referenced in Step 3 above with screws of a different type (length). 7. Attach the last module with rear cover and tighten the corner screws. 8.
-
Page 33: Operator Interface
3 Operator Interface Operator Interface covers the methods of communication between the user and the instrument. The Network Master also supports data transfer to and from a network PC or external storage device. The installed hardware module or modules determine the applications that can be activated and the associated tests and measurements available. -
Page 34: Touch Screen Display
Never use sharp objects (e.g., pens, paper clips) that may scratch the touch screen surface. Do not let any liquid that may leak from the screen or other parts of the instrument come in contact with your skin or eyes. Contact your local Anritsu Service Center. -
Page 35: Power Button
Power Button 3.2 Power Button The Power button is the only physical operator key on the MT1000A Network Master Pro. In addition to powering up and down the instrument, the button gives you access to other functions: • Switch application •... -
Page 36: Turning The Power Off
Operator Interface 3.2.2 Turning the Power Off While the instrument is on, press the Power button once to display the pop-up menu shown below. Touch the Shut Down button, then Yes to confirm. 3.2.3 Forced Shutdown A forced shutdown should only be used in an emergency, after normal power-off attempts have failed. -
Page 37: Headset
Headset 3.3 Headset You can use the optional headset available from Anritsu. Connect the headset to the socket marked with a headset symbol on the Network Master connector panel. To adjust the sound, touch the Configuration icon on the Instrument toolbar, and select the General tab. -
Page 38: Connector Panel
All physical connections to both the test interfaces and the service interfaces of the Network Master are located on the instrument connector panel. The figure below shows the MT1000A controller module and MU100040B CPRI RF module. Test Interfaces (CPRI RF Module) 1 GPS antenna connector - used with Base Band Unit Emulation (Option 10) This connector is not present on the discontinued MU100040A CPRI RF module. -
Page 39: Optical Connector Cleaning
Optical Connector Cleaning 3.5 Optical Connector Cleaning Optical connectors and adapters need periodic cleaning. The following instructions illustrate how to clean an FC-type connector and adapter. They also apply to the cleaning of other fiber optic connector types. WARNING Before cleaning, make sure that no light is emitting from the optical fiber. CAUTION •... -
Page 40: Cleaning The Optical Adapter
Operator Interface 3.5.2 Cleaning the Optical Adapter Use an approved adapter cleaner to clean the optical fiber cable adapter. Use a cleaner only on adapters with a ferrule diameter of 1.25 mm or 2.5 mm. 1. Remove the adapter from the test port. 2. -
Page 41: File Access Via Usb Interface
File Access via USB Interface 3.6 File Access via USB Interface Data stored in the Network Master internal memory is accessible to other devices using the USB interface. The instrument internal memory is not accessible to read or write operations while an application is running. -
Page 42: File Access Via Ethernet Interface
Operator Interface 3.7 File Access via Ethernet Interface By connecting the Network Master to your Local Area Network, you can enable file sharing to copy data from the instrument to a PC or load files from a network computer. Folders and files are read-only. 3.7.1 Accessing Files in Network Master from a PC To set up the Network Master as a shared device on your LAN: 1. - Page 43 File Access via Ethernet Interface 2. Under the Sharing tab, click Share, then select Everybody and click Add. 3. Use an Ethernet cable to connect the RJ45 port on the Network Master to the LAN. 4. Go to the Network Configuration screen from the Instrument toolbar and assign an IP address to the Network Master, in the Ethernet Settings dialog box.
-
Page 44: Gps Receiver
Operator Interface 3.8 GPS Receiver The Network Master controller module supports an optional GPS receiver, which activates automatically when connected to the AUX port on the instrument connector panel. The synchronization accuracy against UTC is ± 1 µs or less. This GPS feature is entirely separate from the built-in GPS receiver found on the MU100040B CPRI RF Module. -
Page 45: Graphical User Interface
This section contains a general introduction to the graphical user interface (GUI) of the MT1000A Network Master Pro. Descriptions of screen buttons and dialog boxes related to a specific technology and measurement module such as CPRI RF are provided in that application section. -
Page 46: General Handling Of The Gui
Graphical User Interface 4.1 General Handling of the GUI Along with the Power button, the touch screen display is the only user interface you need to access all the functions supported by the Network Master mainframe controller and the installed measurement modules. These functions include configuration and setup tasks, the running of specific tests, and the display of measurement results. -
Page 47: Startup Splash Screen
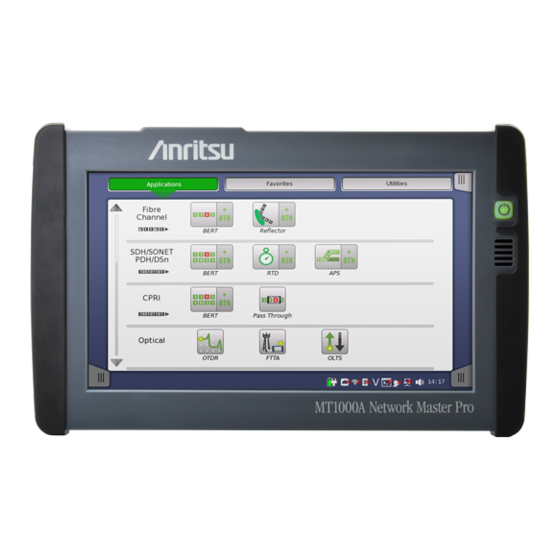
General Handling of the GUI 4.1.1 Startup Splash Screen A splash screen similar to the example below appears during boot-up while the instrument controller software is loading. The screen shows the main functional spaces of the graphical user interface and may be different depending on the application. 4.1.2 Application Selector The Application Selector screen is the main entry point following startup of the Network Master. -
Page 48: Favorites
Graphical User Interface 4.1.2.2 Favorites You can save a set of frequently used port resources and application settings by adding it to a Favorites list. Touch the Favorites button to display the Favorite icons, if any. To launch a favorite application, touch the related icon on the Application Selector Favorites screen. -
Page 49: Utilities
General Handling of the GUI 1. Open the File Manager from the Instrument toolbar. 2. Select the .cfg file you wish to mark as favorite. 3. Touch Add to Favorites in the File Manager task bar at the top of the screen. A duplicate of the selected file is created in the Favorites folder. - Page 50 Graphical User Interface Utility GPS – logs data from GPS receiver and shows the satellite positions PDF Viewer – used to view PDF files created with an application’s Report feature VIP – Video Inspection Probe, used to examine the edge surface of an optical fiber Wireshark –...
-
Page 51: Result File Browser
General Handling of the GUI 4.1.3 Result File Browser The Result File Browser loads the results and configuration of a previous test into the workspace. This allows you to generate reports from the results and optionally to rerun the test, using either the original settings or with various configuration modifications. The CPRI RF application currently does not support the reporting or loading of test result data. -
Page 52: Navigating The Gui
Graphical User Interface 4.1.4 Navigating the GUI The Network Master graphical user interface lets you switch screens both horizontally at the desktop level and within a workspace, and vertically between the desktop and workspace. 4.1.4.1 Horizontal Navigation at Desktop Level You can switch between the Application Selector and the Result File Browser by touching the tab at the lower right or lower left corner of the screen. -
Page 53: Status Icons
General Handling of the GUI To switch from a setup screen to the Application Selector screen, touch the Application Selector tab at the top of the display. Test result screens also have a tab at the top that will take you to the Result File Browser screen. 4.1.5 Status Icons The Status bar at the bottom of the display contains icons showing the status of device and communication connections and other accessories. -
Page 54: Starting An Application
Graphical User Interface 4.1.6 Starting an Application 1. On the Application Selector screen, press an icon to load the application into the workspace. You may need to scroll to bring the desired application icon into view. 2. On the Instrument Resources screen that appears, touch the appropriate module and select the resources (ports) to be used for the test. -
Page 55: Switching Applications
General Handling of the GUI 4.1.7 Switching Applications You can switch between multiple running applications using any of the following three methods: • At the desktop level, touch the workspace navigation button at the bottom center of the screen. • On the workspace screen, touch the application on the left side of the Status bar. •... -
Page 56: Operating The Application
Graphical User Interface 4.1.8 Operating the Application This section describes the workspace screens common to most applications that run on the MT1000A Network Master. Not every application uses the same interface structure. Refer to “Status Icons” “Toolbars” for a description of the Status bar and the vertical toolbars on the right side of the screen. -
Page 57: Test Screen
General Handling of the GUI 4.1.8.2 Test Screen The Test Setup screen is typically the second screen in the workspace. It may contain one or more setup pages, with a row of navigation buttons at the top of the display which are used to switch between the pages. -
Page 58: Soft Keypads
Graphical User Interface 4.1.9 Soft Keypads Measurement settings and other parameter values are entered in data fields or via soft keys on the workspace screen. To enter or change a parameter setting, touch the field or key to open the data input keypad. The keypad contents and layout depend on the parameter type, which may be numeric or alphanumeric. -
Page 59: Toolbars
Toolbars 4.2 Toolbars The Network Master user interface features two vertical toolbars on the right side of the instrument display: the Instrument toolbar and the Application toolbar. 4.2.1 Instrument Toolbar The Instrument toolbar gives access to general system functions and information, including instrument configuration and connectivity, resource monitoring, and file management. -
Page 60: Instrument Information
• Self Test Results If the self test results show “NG,” try rebooting the Network Master. If “NG” persists in the results, contact your local authorized Anritsu service center. The Update About Info button refreshes the instrument information. To save the system information in an HTML file, touch Save To File and select the output location and file name in the dialog box that opens. -
Page 61: Configuration
Toolbars 4.2.1.2 Configuration The Configuration icon launches the Global Configuration screen. Touch one of the top navigation tabs to access the available configuration screens: • General – instrument settings that include date and time, password. • Network – connection settings and status General LCD Brightness lets you adjust the screen brightness by dragging the slide bar. - Page 62 Graphical User Interface Touch Screen Calibration lets you calibrate the screen for touch input. Prior to initiating the calibration, save your measurement settings and results. All unsaved data will be lost when the Network Master automatically reboots, following screen calibration. If the instrument is operating on battery power, it will shut down and only reboot when the Power button is pressed.
- Page 63 Toolbars System Password lets you enable and disable password protection of the touch screen and setup data. When enabled, starting an application and making configuration changes require password authentication. Select one or both checkboxes and touch OK to enable password protection. In the dialog box that follows, you can optionally enter a new password in the text field.
- Page 64 Graphical User Interface Date/Time allows you to set the system date and time. Prior to changing the time and date, save your measurement settings and results. All unsaved data will be lost when the Network Master reboots. Select a component of time or date and use the up/down buttons to adjust, then touch OK.
- Page 65 Toolbars Restore Applications Defaults restores default settings in all currently running applications. Exercise caution when initiating this action. Execute Self Test starts the instrument self test. Prior to performing this action, save the measurement settings and results of all running applications. Any unsaved data will be lost when the Network Master reboots.
- Page 66 WLAN allows the instrument to connect to a network via Wireless Local Area Network. Ethernet connection is not possible when WLAN is enabled. WLAN connection requires Option MT1000A-003. 1. Touch WLAN on the Network screen. 2. In the WLAN Setup dialog, select the Enable WLAN checkbox, then touch the Scan button.
- Page 67 WLAN connection. Bluetooth lets you set up a Bluetooth connection. Bluetooth connection requires Option MT1000A-003. • Enable Bluetooth activates the Bluetooth connection. • Make visible allows other Bluetooth devices to detect the Network Master.
- Page 68 Graphical User Interface • Incoming remote PC control makes available remote PC control via Ethernet, when the checkbox is selected. This icon in the Status bar indicates whether remote PC control is enabled. Some Network Master applications such as MU100020A, MU100021A, and MU100040A/B do not support the remote control function.
-
Page 69: File Manager
Toolbars • IP Address is the address of the network PC. • Domain is the domain name. • User is the PC user ID or account. • Password is the account password. • Folder Name is the name of the shared folder on the network PC. Enter the name of the shared folder only, not the entire directory path shown in Windows. - Page 70 Graphical User Interface Sets the current folder to the home folder. Moves to the home folder. Creates a new folder. Edits the file name or the folder name. Deletes the selected file(s) or folder(s). Copies the selected file(s) or folder(s). Pastes the file(s) or folder(s).
-
Page 71: Help
Toolbars 4.2.1.4 Help The Help icon opens a context-sensitive help screen. The described topic relates to the current setup or test screen. Depending on the application, you may be able to search for specific words or phrases, or step through the available help topics. Moves to the Help list. -
Page 72: Resource Monitoring
Graphical User Interface 4.2.1.5 Resource Monitoring The Resource Monitoring icon launches a screen that shows the currently activated applications and the ports that have been assigned to each. -
Page 73: Application Toolbar
Toolbars 4.2.2 Application Toolbar The Application toolbar is located on the right side of the Network Master display and consists of icons that give access to commonly used functions. Some icons described in this section may not apply to all applications. For information on icons not shown here, refer to the documentation topic for the associated application. - Page 74 Graphical User Interface 3. To display a logo in the report, select the Include Logo checkbox and enter or browse for the image file name. 4. Touch Next to continue. 5. Choose the information items to include in the report by selecting the corresponding checkboxes.
- Page 75 Toolbars Touch this icon to access the online help for the currently displayed screen or dialog. Depending on the application, you may be able to search for specific words or phrases in the help library, or step through the available help topics. Moves to the topic initially opened when the Help icon was pressed.
-
Page 76: Expanded Toolbar Area
Graphical User Interface Touch this icon to open the Load File dialog, where you can select a setup file or result file. Touching a file on the list will display its name in the File name field. Select Files of type to apply a filter to the file list. Not all functions listed below are available in all applications. -
Page 77: Startup And Shutdown Sequences
Startup and Shutdown Sequences 4.3 Startup and Shutdown Sequences This section describes instrument behavior when you switch the Network Master on and off and when you start and close an application. 4.3.1 Instrument Startup During instrument boot-up, the Network Master displays a splash screen illustrating the desktop and workspace areas of the graphical user interface, followed by the Application Selector screen. -
Page 78: Application Shutdown
Graphical User Interface If you pressed Load File, the application starts using the setup parameters contained in the file. If another application is using the same ports as specified in the loaded result file, the error message below is displayed. In this case, you can abort or start the application in Viewer mode, or launch it from the Application Selector screen and select different ports. -
Page 79: Cpri Rf Application
Full Span capable Max Span = Carrier BW + 50% This section covers the CPRI LTE RF Measurement functions available with Anritsu Option 1, which runs on the MU100040A/MU100040B CPRI RF Module. The section contains descriptions of the CPRI RF application’s graphical user interface and provides instructions for a typical setup and measurement. -
Page 80: Cpri Rf
Refer to the instrument Technical Data Sheet. • SFP optical transceiver used to connect the measurement device must match the link rate of SFPs on the BBU and RRH. The CPRI RF module for MT1000A Network Master Pro has dual SFP ports. -
Page 81: Typical Cpri Connection
4. Connect a 3-meter LC/LC Duplex Jumper from Port A on the optical TAP to the BBU. 5. Use a compatible SFP transceiver and Simplex fiber cable to connect the Anritsu test instrument to Port AB on the optical TAP. -
Page 82: Cpri Rf Measurement Setup
The primary application for CPRI RF is to check for interference on the RRH-to-BBU uplink. When monitoring traffic over the CPRI link, the Anritsu test instrument will extract the IQ data and process the signal into data points to be plotted on the instrument screen. -
Page 83: Center Frequency
CPRI RF Measurement Setup 5.4.1.2 Center Frequency When the carrier frequency is set as described above, the center frequency defaults to the same value. To allow the CPRI signal to move off center (pan), adjust the center frequency to a different value. Depending on the value entered, this may automatically adjust the frequency span, as there cannot be panning without zooming. -
Page 84: Scale
CPRI RF Application 5.4.2.2 Scale The sweep window on the instrument screen is a 10x10 grid. Enter the scale value to adjust the Y axis (amplitude) intervals for optimal viewing of the signal trace. The default setting is 10.0 dB/div. 5.4.3 Bandwidth Touch the BW button in the navigation area to view or change the bandwidth settings. -
Page 85: Vbw
CPRI RF Measurement Setup 5.4.3.3 VBW The video bandwidth ranges from 10 Hz to 3 MHz. Available settings are: 10 Hz, 30 Hz, 100 Hz, 300 Hz, 1 kHz, 3 kHz, 10 kHz, 30 kHz, 100 kHz, 300 kHz, 1 MHz, and 3 MHz. The default is 300 Hz. -
Page 86: Measurements
CPRI RF Application 5.4.4 Measurements Touch the Measurements button in the navigation area to access the “CPRI Configuration” and related screens. The Preset icon at the top of the Application toolbar resets all setup and measurement settings to their default values. 5.4.4.1 CPRI Configuration To view or set the CPRI Configuration settings, touch the CPRI Config button in the status area. - Page 87 CPRI RF Measurement Setup AxC Container/Group The CPRI AxC contains the IQ data used to generate the RF spectrum. Antenna container mapping determines the location of IQ data for a given carrier (that is, the signal). Container groups are used to achieve the desired sample rate by aggregating a number of containers into groups that form one basic frame.
-
Page 88: Radio Preset
CPRI RF Application 5.4.4.2 Radio Preset The easiest way to configure the Network Master for CPRI RF testing is to use one of the radio presets provided with the application. By doing so, the IQ bit width, number of reserve bits, and start container settings appropriate for the selected vendor will be applied automatically. -
Page 89: Measurement View
CPRI RF Measurement Setup Aggregation Aggregation is common with some LTE equipment manufacturers. It refers to the aggregation of smaller carriers to make one large carrier within one AxC. For example, two 5 MHz carriers can be aggregated to make a single 10 MHz carrier. For a single carrier, set CPRI aggregation off. - Page 90 CPRI RF Application Spectrogram View A spectrogram is a three-dimensional representation of frequency, time, and power. Color is used to represent the relative power levels. Touch the View button under Meas. View and select Spectrogram from the pop-up menu to display a screen similar to the illustration below.
- Page 91 CPRI RF Measurement Setup CPRI Alarm Touch the View button under Meas. View and select CPRI Alarm from the pop-up menu to display the SFP port alarm status and the Tx and Rx optical power levels. Pass status is shown as green; Fail is red. No color means there is no connection at the SFP port.
-
Page 92: Marker
CPRI RF Application 5.4.5 Marker Touch the Marker button in the navigation area to access the Marker Setup and Marker Search screens. The Preset icon at the top of the Application toolbar resets marker parameters and all other application settings to their default values. To reset only the markers, touch the Preset Markers button. -
Page 93: Marker Search
CPRI RF Measurement Setup Preset Markers Touch the Preset Markers button to remove previously set markers. Touch Yes to confirm. 5.4.5.2 Marker Search To access Marker Search functions, touch the Marker button in the navigation area, then touch the Marker Search button. Peak Search Places the selected marker number on the highest amplitude signal currently on screen. -
Page 94: Limit
CPRI RF Application Marker Right Touch this button to move the currently selected marker one display point to the right. You can also move the marker by entering a frequency value using the Edit Marker button on the Marker Setup screen or, simply press and hold the blue marker line until the color changes to pink, then drag. -
Page 95: Sweep
CPRI RF Measurement Setup 5.4.7 Sweep Touch the Sweep button in the navigation area to access the sweep and trace settings. The Preset icon at the top of the Application toolbar resets to default the sweep and trace parameters and all other application settings. To reset only the trace and sweep settings, touch the Preset Traces button. -
Page 96: Trace Mode
CPRI RF Application 5.4.7.5 Trace Mode Blank Hide the trace. Any active markers will still be visible. This is the default setting for Traces 2 and 3. Hold/View Freeze the trace display. Active Normal trace display is the default setting for Trace 1. 5.4.7.6 Average Count Sets the number of traces for use in calculating the average display value, when the selected trace type is Average. -
Page 97: Saving And Loading Files
Saving and Loading Files 5.5 Saving and Loading Files To save or load application data to the Network Master, touch one of the Application toolbar icons described below. Touch this icon to save the current setup parameters in a file (extension .cfg) either in internal memory or on an external USB device. - Page 98 CPRI RF Application 2. Select the SFP port to which the CPRI link you want to monitor is connected. 3. Set the line rate, AxC container group, and the CPRI bandwidth as appropriate. 4. Under the Frequency navigation tab, enter the carrier frequency. The center frequency will default to the value you enter here, while the span is approximately the carrier bandwidth plus 50%.
- Page 99 CPRI RF Configuration Example 7. If the preset is Ericsson, touch the CPRI Aggregation button and select On or Off as appropriate. 8. Touch the View button under Meas. View and select CPRI Spectrum from the pop-up menu. A trace view similar to the screen below will be displayed. The connection status of SFP Port 1 and Port 2 is displayed on the instrument screen, above the trace window.
-
Page 100: Base Band Unit Emulation (Option 10)
RRH initialization or to get VSWR or SFP data. If necessary, you can reload the scripts or download new scripts from an external USB drive to the Anritsu instrument’s internal memory, as described in “BBU Script Download”. -
Page 101: Activating The Gps Feature
Base Band Unit Emulation (Option 10) 5.7.2 Activating the GPS Feature GPS can optionally be used to enhance frequency reference oscillator accuracy. The MU100040B CPRI RF Module features a built-in GPS receiver, and an antenna is included with the product. Refer to the instrument Technical Data Sheet for antenna specifications. -
Page 102: Bbu Script Download
Script files are included with the Option 10 firmware. Follow this procedure only if you need to reload them, or download different scripts. To download scripts from a USB storage device to the Anritsu test instrument: 1. Insert a USB drive containing the script files into the test instrument USB port. -
Page 103: Lte Waveform Download
6. Touch Close to close the File Transfer dialog. 5.7.4 LTE Waveform Download To download LTE waveforms from USB to the Anritsu test instrument: 1. Insert a USB drive containing the waveform files into the test instrument USB port. -
Page 104: Bbu Test
RRH IP information, which may take a few minutes. If multiple radios are connected in a daisy chain, the Anritsu instrument assigns an IP address to each, using its built-in DHCP server. At the end of the process, a... - Page 105 Base Band Unit Emulation (Option 10) 5. Touch to select the desired IP address from the displayed list, then press Initialize. 6. A message box is displayed while information on the selected RRH is collected.
- Page 106 CPRI RF Application 7. Review the displayed RRH parameters as needed. 8. Following RRH initialization, you can optionally touch the BBU Emulation button and select RRH SFP Data to display the signal data and SFP vendor and compliance information at the CPRI ports. 9.
- Page 107 Base Band Unit Emulation (Option 10) 10.In the LTE Waveforms dialog, touch Select Radio Type and choose from the list the carrier configuration that matches the LTE radio type and bandwidth of the signal you want to transmit through the RRH. Touch Select. 11.Press Select Waveform and select a bandwidth from the list.
- Page 108 CPRI RF Application 12.On the displayed list, touch the waveform corresponding to the radio type selected earlier, then press Select. One waveform pattern may be transmitted at a time. 13.Optionally, press the Center Frequency button and adjust the carrier frequency of the radio.
- Page 109 Base Band Unit Emulation (Option 10) 18.Touch Close to return to the BBU Emulation menu, then press Return Loss/VSWR. Provided the RRH is transmitting, test results are displayed on the instrument screen. 19.You can optionally change the return loss limit and VSWR limit and press Measure to run the test again.
- Page 110 CPRI RF Application...
- Page 112 Anritsu Company 490 Jarvis Drive Anritsu utilizes recycled paper and environmentally conscious inks and toner. Morgan Hill, CA 95037-2809 http://www.anritsu.com...
Need help?
Do you have a question about the MT1000A and is the answer not in the manual?
Questions and answers