
Related Manuals for Berthold MicroPolar LB 566


Summary of Contents for Berthold MicroPolar LB 566
- Page 1 Concentration Meters MicroPolar (++) LB 566 User’s Guide Hardware Manual 41986BA2 Rev. Nr.: 06-E, 09/2017...
- Page 4 The units supplied should not be repaired by anyone other than Berthold Technologies Service engineers or technicians by Berthold Technologies. In case of operation trouble, please address to our central service department (address see below). The complete user’s guide consists of the hardware manual and the software manual.
-
Page 5: Table Of Contents
Table of Contents Table of Contents Page Chapter 1. Safety Summary 1.1 Symbols and Warnings 1.2 General Information 1.3 General Safety Instructions Chapter 2. General Information 2.1 Use and Function 2.2 Frequency License 2.3 Intended Use 2.4 Explanation of Terms Chapter 3. - Page 6 Table of Contents Chapter 6. Technical Data 6.1 Technical Data Evaluation Unit 6.2 Technical Data Sensors 6.3 Technical Data HF Cable 6.4 Format of Serial Data Output RS232 and RS485 Chapter 7. Certificates 7.1 EC Declaration of Conformity 7.2 Frequency License Chapter 8.
-
Page 7: Chapter 1. Safety Summary
Chapter 1. Safety Summary 1.1 Symbols and Warnings In this user manual, the term Berthold Technologies stands for the company Berthold Technologies GmbH & Co.KG. To rule out bodily injury and property damage, please keep in mind the warning and safety instructions provided in this user manual. -
Page 8: General Information
Chapter 1. Safety Summary Other symbols used in this documentation: Warning: No intervention, do not alter anything Requirement: Disconnect power Requirement: Wear safety boots 1.2 General Information The most important safety measures a summarized in this user manual. They supplement the corresponding regulations which must be studied by the personnel in charge. -
Page 9: General Safety Instructions
Chapter 1. Safety Summary 1.3 General Safety Instructions IMPORTANT The equipment housings have IP 65 protection and are suitable for outdoor applications. The units are factory tested and are delivered in a condition that permits safe and reliable operation. For outdoor applications, the measuring systems must be protected from direct sunlight and rain, for example by a suitable shelter. - Page 10 Chapter 1. Safety Summary Electrical hazards Disconnect power to ensure that contact with live part is avoided during installation and when servicing. Disconnect the power supply before opening the instrument. Work on open and live instruments is prohibited. Caution! Potential hazards, material damage! Device type: LB 566-12 MicroPolar ++ (ID no.
-
Page 11: Chapter 2. General Information
General Information 2.1 Use and Function The MicroPolar LB 566 has been designed as a concentration measuring system and may be used only for this purpose. If the devices are used in a manner that are not described in this user manual, the protection of the devices is compromised and the warranty will be lost. -
Page 12: Frequency License
Chapter 2. General Information 2.2 Frequency License This device complies with Part 15 of the FCC Rules and with In- dustry Canada licence-exempt RSS standard(s). Operation is subject to the following two conditions: this device may not cause harmful interference, and this device must accept any interference received, including interference that may cause undesired operation. - Page 13 Consult the dealer or an experienced radio/TV technician for help. Changes or modifications made to this equipment not expressly approved by BERTHOLD TECHNOLOGIES may void the FCC au- thorization to operate this equipment. The MicroPolar and MicroPolar ++ comply with the R&TTE Di- rective 1999/5/EC and thus meet all the requirements for this type of high-frequency devices.
-
Page 14: Intended Use
Chapter 2. General Information 2.3 Intended Use The LB 566 can be used to determine the water or moisture content and the concentration of virtually any material. The fol- lowing sensors and evaluation versions are available: The container probes have been designed for installation in- to containers and pipelines with a nominal width of ... -
Page 15: Explanation Of Terms
Chapter 2. General Information 2.4 Explanation of Terms Attenuation Weakening of microwave signals, microwaves measuring effect. Evaluation Unit Factory setting In the factory setting all parameters have been set to default values. In most cases this considerably facilitates the calibra- tion of the instrument. -
Page 17: Chapter 3. System Description
Chapter 3. System Description Chapter 3. System Description 3.1 Principle of Measurement As the microwaves pass through the product, their propagation velocity is slowed down (= phase shift) and their intensity is at- tenuated (= attenuation). Figure 3-1 illustrates the principle of measurement: Compared to a reference signal, the propagation velocity of microwaves passing through the product is slowed down (phase shift) and their intensity (attenuation) is reduced. -
Page 18: Calculation Of Measured Values
Chapter 3. System Description 3.2 Calculation of Measured Values The microwave parameters phase and attenuation are calibrat- ed according to an automatic plausibility analysis. During calibration, the phase and/or attenuation of a concentra- tion value (or density value) are assigned through sampling. The calibration is done automatically and the sampling process is supported by the evaluation unit. -
Page 19: Temperature Compensation
Chapter 3. System Description Conductive materials such as graphite or coke cannot be trans- mitted by microwaves. Metal walls can also not be transmitted by microwaves. Compensation In addition to the water content, the product temperature, product density and a varying material load (varying microwave irradiation path) may have an influence on the phase and at- tenuation. -
Page 20: Throughput Calculation And Output
Chapter 3. System Description 3.4 Throughput Calculation and Output For pipeline applications, the LB 566 allows you to calculate the throughput (mass flow) and to output the result via a current output. The calculation is based on the microwave measured value; if this value correlates with the product density, one can calculate the throughput, if some additional information is available. -
Page 21: Mechanical Components
(short HF-cable). The evaluation unit is available in two ver- sions: the standard model MicroPolar LB 566 and the high dy- namics version MicroPolar ++ LB 566 (see Figure 3-4 and Fig- ure 3-5). - Page 22 Chapter 3. System Description The probes/antenna pairs are available in different versions, as pipeline and container probe with or without flushing device (see Figure 3-6 to Figure 3-7). Figure 3-6: From left: Container probe LB 5650 and LB 5651 with flushing device Figure 3-7: FlowCell LB 5660-102-00x...
-
Page 23: Evaluation Units
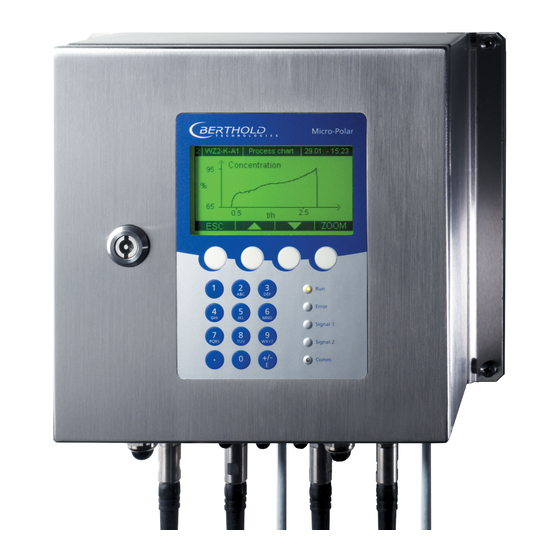
Chapter 3. System Description 3.5.1 Evaluation Units The evaluation units comprise the evaluation computer and the microwave unit. The microwaves are generated, received and analyzed in the microwave unit. Signal processing and commu- nication take place in the evaluation computer. For simple oper- ation, the measuring system includes a display, 4 softkeys and an alphanumeric keypad. - Page 24 Chapter 3. System Description Cable feed-through M 20 and M 16 Rs232 9 pole SubD-connector R-Rx M-Rx M-Tx R-Tx Figure 3-9: Evaluation unit – bottom view High-frequency connections Interpretation of LEDs Five LEDs on the instrument front panel indicate the current de- vice status.
-
Page 25: Flowcell
Chapter 3. System Description Terminal block The electrical connections of the LB 566 are located on a con- nector strip in the wall cabinet. The terminal block can be ac- cessed from the front by opening the cover of the housing. There, you also find the power cut-off switch and the fuses. - Page 26 Chapter 3. System Description The flow cell consists of a sturdy stainless steel body. The mi- crowave transmitter and receiver are firmly welded to the out- side of the pipe. The entire product pipe is PTFE-coated and thus meets the special requirements for use in food for use in food.
-
Page 27: Container Probe
Chapter 3. System Description 3.5.4 Container Probe The container probe is available in a version with and without flushing device (see Figure 3-12). The technical data are listed in chapter 6.2 Technical Data Sensors. Figure 3-12: Container probe versions A: High-frequency connections B: Process connection, flanges of different sizes Container probe type LB 5650 and type LB 5651 The container probe has been specially designed for concentra-... - Page 28 Chapter 3. System Description For the case depicted in Figure 3-13, the flow direction of the product being measured must be perpendicular to the drawing plane. This ensures a representative product between the measuring rods, provided the product is mixed thoroughly. Figure 3-13: Container probe LB 5650 PT100...
- Page 29 Chapter 3. System Description Container probe type LB 5651 with flushing device The flushing probe LB 5661 has been designed for processes in which depositions, for example, due to incrustations are likely to occur on the probe. The flushing probe has two flushing channels which keep the measuring rods free from incrustations;...
-
Page 30: High-Frequency Cable
Chapter 3. System Description 3.5.5 High-frequency Cable High-frequency cables (HF cable) are used to transmit micro- wave signals. HF cables change their conductivity (for microwaves) with tem- perature and would therefore produce measurement errors with varying ambient temperature. This error is compensated for by enabling the automatic cable compensation. - Page 31 Chapter 3. System Description Sensor side Figure 3-18: N-connector HF cable quad (ID-no. 20608) probe side: The ends of the reference line R-Rx and R-Tx are short-circuited using an N-connector. Version 2: It consists of a single HF-cable whose ends are ter- minated by an HF-connector (N-type).
-
Page 32: Assembly On A Pipeline
Chapter 3. System Description Assembly on a Pipeline The evaluation unit is installed close to the FlowCell to keep the HF cable between evaluation unit and probe as short as possi- ble. The shorter the cable connection, the better the stability of the measurement. -
Page 33: Assembly On A Container
Chapter 3. System Description 3.7 Assembly on a Container The evaluation unit is installed in the immediate vicinity of the container probe to keep the HF-cable between evaluation unit and probe fairly short. The shorter the cable connection, the better the stability of the measurement. The standard length is 2 m and the maximum length of the HF cable is 10 m. -
Page 35: Chapter 4. Getting Started
Chapter 4. Getting Started Chapter 4. Getting Started 4.1 Transport Warning: Possible material damage! System parts may get damaged during transportation! Transport all components in their original packaging. Protect parts against shocks. In particular, the measuring rods of the container probes must be protected against mechanical shock! After unpacking, make sure all parts listed on the packing list have been delivered and show no sign of damage;... -
Page 36: Commissioning The Flowcell
Chapter 4. Getting Started 4.2 Commissioning the FlowCell 4.2.1 Installing the FlowCell Note the following points when installing the FlowCell: The FlowCell is integrated at a suitable location in the pipe- line system. Keep in mind that material sampling directly behind the FlowCell should be possible for calibration. - Page 37 Chapter 4. Getting Started Abb. 4-1: Installation in a vertical riser Abb. 4-2: Horizontal installation: Orientation of HF connectors MicroPolar (++) LB 566...
-
Page 38: Installing The Evaluation Unit
Chapter 4. Getting Started 4.2.2 Installing the Evaluation Unit Note the following points when installing the evaluation unit: Position the evaluation unit depending on the length of the HF cable in the vicinity of the microwave probe. The evaluation unit has to be protected against vibrations. In some cases, it is advisable to set up the evaluation unit on a stand separated from the pipeline system. -
Page 39: Connecting The Hf Cable
2 x HF cables (as signal cable) 1 x HF cable (as reference cable) The decision for a certain cable version is taken by Berthold Technologies in the planning stage. It is subject to the applica- tion and the desired distance between evaluation unit and FlowCell. - Page 40 Chapter 4. Getting Started Abb. 4-4: FlowCell connection, version 1 Abb. 4-5: FlowCell connection, version 2 Hand tighten all screwed connections of the HF cable (2 Nm = 0.2 kg/m)! Before tightening, carefully screw on the cable by hand. Caution! Threaded joint jams easily. Check occasionally if the screwed connection is still properly tightened.
-
Page 41: Commissioning The Container Probe
Chapter 4. Getting Started As long as the cables are not connected, the coaxial sockets have to be covered with plastic caps and the cable connectors have to be protected against moisture and dirt. 4.3 Commissioning the Container Probe 4.3.1 Installing the Container Probe For installation of the probes, please keep in mind: ... - Page 42 Chapter 4. Getting Started remove the two eyebolts first. Then insert two longer screws (M8) into their bore holes up to the process flange. If you con- tinue to rotate the screws, you will push the probe away from the process flange. Installation in pipelines Container probes can be installed in pipelines with a nominal width ...
-
Page 43: Setting Up The Evaluation Unit
Chapter 4. Getting Started 4.3.2 Setting Up the Evaluation Unit Set up the evaluation unit as described in chapter 4.2.2. 4.3.3 Connecting the HF Cable Connect the container probe to the evaluation unit via the HF cable quad. Prerequisite for a correct measurement is the correct installation of cables! Please keep in mind: Make sure the cable does not get into contact with hot pipes over the entire length (corrugated tube and single cable... - Page 44 Chapter 4. Getting Started Figure 4-6: Connecting the container probe to the evaluation unit Hand tighten all screwed connections of the HF cable (2 Nm = 0.2 kg/m)! Before tightening, carefully screw on the cable by hand. Caution! Threaded joint jams easily. Check occasionally if the screwed connection is still properly tightened.
-
Page 45: Connecting The Evaluation Unit
Chapter 4. Getting Started 4.5 Connecting the Evaluation Unit Electrical hazards: Disconnect power to rule out any contact with live parts during installation and servicing. Turn off power before opening the instrument. NEVER work on open and live instruments. Caution! Potential hazards, material damage! Device type: LB 566-12 MicroPolar ++ (ID no. -
Page 46: Pin Configuration Of The Connector Strip
Chapter 4. Getting Started 4.5.1 Pin Configuration of the Connector Strip The connector strip of the evaluation unit includes the following terminals: Figure 4-7: LB 566 wiring diagram Power supply: Terminals 3 (L1, +), 2 (N, -) and 1 (PE, For MicroPolar, depending on device type, see name plate on the housing outer wall. - Page 47 Chapter 4. Getting Started PT100 (terminals 23+ and 11-) Connection for temperature measurement. When commissioning the container probe, connect the 4-core cable of the PT100 to the connector strip of the evaluation (see fig. 4-8). Connect the other end of the cable with the corre- sponding plug on the container probe (see fig.
-
Page 48: Digital Outputs, Relay
Chapter 4. Getting Started Digital input 3: DI3 (terminals 26+ and 14-) Configuration options: No function Start sampling, open: no action, closed: unique measure- ment starts Product selection Relay 1: (Terminals 4, 5 and 6) and Relay 2: (Terminals 16, 17 and 18) Changeover contacts (SPDT), insulated, configuration option: ... - Page 49 Chapter 4. Getting Started Relay no. Error, alarm, no product, Normal measurement stopped, Below load, currentless condition The relays with changeover contacts can either be operated as make contact, terminals 4 & 5 (open at error, alarm ...) or as break contact, terminals 5 &...
-
Page 51: Chapter 5. Service Instructions
Defective modules of the evaluation unit cannot usually be re- paired but must be replaced. The microwave module is firmly bolted to a screening hood and must not be opened. For device disposal, please contact the Berthold Service and ap- ply for a recycling passport. MicroPolar (++) LB 566... -
Page 52: Wear Parts
Chapter 5. Service instructions 5.2 Wear Parts The evaluation unit does not include any parts that are subject to wear or components that require special maintenance. The plastic caps of the measuring rods of the container probes and the PEEK Microwave window of the flow cell may be subject to abrasion over the course of time. -
Page 53: Instrument Cleaning
Chapter 5. Service instructions 5.3 Instrument Cleaning Clean all system components exclusively with a damp cloth with no chemical cleaning agent. Parts coming into contact with the product (during regular operation) can be cleaned with warm water, taking into account the temperature limits, see chapter 6.2 Technical Data Sensors. -
Page 54: Fuse Replacement
Chapter 5. Service instructions 5.5 Fuse Replacement The mains fuses of the LB 566 are located in the wall housing. Replace the fuses only if the instrument is disconnected from mains. Use only fuses with the correct rating, see chapter 6.1 Spare fuses must match the rating specified by the device manufacturer. -
Page 55: Technical Data
Chapter 6. Technical Data Chapter 6. Technical Data General specifications Method Microwave transmission measurement Operating frequen- 2.4 - 2.5 GHz (ISM band), depending on local regulations Transmission MicroPolar: < 0.1 mW (< - 10 dB) power MicroPolar ++: < 10 mW (< 10 dBm) All coaxial line power Application Concentration / moisture measurement in... - Page 56 Chapter 6. Technical Data Power supply For Micro Polar, depending on device type: 1.) 100 ... 240 V AC, 45 ... 65 Hz 2.) 24 V DC: 18...36 V; 24 V AC: -20%, +5%, 40 ... 440 Hz For MicroPolar++, depending on device type: 1.) 100 ...240 V AC, 45...65 Hz 2.) 24 V DC: 18...36 V, no reverse polarity protection...
- Page 57 Chapter 6. Technical Data Digital input 3 x digital inputs (DI1..3), for floating connectors Configuration options: DI1: none, measurement start/stop DI2: none, measurement hold, product selection DI3: none, sampling, product selection Function description: 1. Measurement (Start/Stop), open: Meas- urement stopped, closed: Measurement started and/or measurement running 2.
-
Page 58: Technical Data Sensors
Chapter 6. Technical Data 6.2 Technical Data Sensors Flow cells Application Microwave FlowCell with various nominal diame- ters and flanges for measurement on pipelines Material Stainless steel, PEEK microwave window Two versions: Process coupling 1. Hygiene milk pipe screw connection DIN 11853 2. - Page 59 Chapter 6. Technical Data Overview ASA flange adapter ID no. Designation ASA flange adapter set for Flow Cell 50 62324 ASA flange adapter set for Flow Cell 65 62319 ASA flange adapter set for Flow Cell 80 62328 ASA flange adapter set for Flow Cell 100 62331 ASA flange adapter set for Flow Cell 150 62335...
- Page 60 Chapter 6. Technical Data Container Probes Application Container probes with and without flushing device for concentration measurement in process containers and pipelines with nominal width 200 Material Plastic caps, stainless steel PT100 connection cable: Silicon / Teflon Process coupling Flange according to DIN EN 1092 type 05 DN65 / PN6, DN 80, 100, 150 / PN16;...
-
Page 61: Technical Data Hf Cable
Chapter 6. Technical Data 6.3 Technical Data HF Cable HF cable Quad Material Corrugated tube: Polyamide (PA6) Cable sheath: Polyethylene (PE) Protection type IP 66 In operation: -30 ... +70 °C Temperature When installing: -20 ... +70 °C Cable length [m] ID no. -
Page 62: Format Of Serial Data Output Rs232 And Rs485
Chapter 6. Technical Data 6.4 Format of Serial Data Output RS232 and RS485 Headline Date·TimeStateStatusSynchronizerProductAttPhiR2TintIN1IN2PT100 CCmC2C2mMF1MF2 Following lines 01.01.2005·00:00:0000000010.435.300.070.00.00.00.0 75.3675.000.000.000.0000.000¶ Column no. Description Format Date and time DD.MM.YY·HH:MM:SS State 4 digits, HEX Status: Information about the quality of the last : Measurement OK measurement <... -
Page 63: Certificates
Chapter 7. Certificates Chapter 7. Certificates 7.1 EC Declaration of Conformity MicroPolar (++) LB 566... - Page 64 Chapter 7. Certificates MicroPolar (++) LB 566...
-
Page 65: Frequency License
Chapter 7. Certificates 7.2 Frequency License MicroPolar (++) LB 566... - Page 66 Chapter 7. Certificates MicroPolar (++) LB 566...
- Page 67 Chapter 7. Certificates MicroPolar (++) LB 566...
- Page 68 Chapter 7. Certificates MicroPolar (++) LB 566...
- Page 69 Chapter 7. Certificates MicroPolar (++) LB 566...
- Page 70 Chapter 7. Certificates MicroPolar (++) LB 566...
- Page 71 Chapter 7. Certificates MicroPolar (++) LB 566...
- Page 72 Chapter 7. Certificates MicroPolar (++) LB 566...
-
Page 73: Technical Drawings
Chapter 8. Technical Drawings Chapter 8. Technical Drawings 8.1 Dimensions Drawings Evaluation Unit Wall Housing MicroPolar (++) LB 566... - Page 74 Chapter 8. Technical Drawings MicroPolar (++) LB 566...
-
Page 75: Electrical Wiring Diagram
Chapter 8. Technical Drawings 8.2 Electrical Wiring Diagram Line in for MicroPolar: 1. / 2. depending on configuration AC 100-240V, 45-65 Hz DC 24 V (18-36 V) or AC 24 V -20/+5%, 40-440 Hz ------------------------------------------- Line in for MicroPolar ++: 1. -
Page 76: Dimensional Drawings Flowcell
Chapter 8. Technical Drawings 8.3 Dimensional Drawings FlowCell 8.3.1 Type LB 5660-102-00X FlowCell DN 50 VFL. FOA MicroPolar (++) LB 566... -
Page 77: Type Lb 5660-112-00X Flowcell Dn 50 G-Bs/M
Chapter 8. Technical Drawings 8.3.2 Type LB 5660-112-00X FlowCell DN 50 G-BS/M MicroPolar (++) LB 566... -
Page 78: Dimensional Drawings Container Probes
Chapter 8. Technical Drawings 8.4 Dimensional Drawings Container Probes 8.4.1 Type LB 5650-01 MicroPolar (++) LB 566... -
Page 79: Type Lb 5650-02
Chapter 8. Technical Drawings 8.4.2 Type LB 5650-02 MicroPolar (++) LB 566... -
Page 80: Type Lb 5650-03
Chapter 8. Technical Drawings 8.4.3 Type LB 5650-03 MicroPolar (++) LB 566... -
Page 81: Type Lb 5650-04
Chapter 8. Technical Drawings 8.4.4 Type LB 5650-04 MicroPolar (++) LB 566... -
Page 82: Type Lb 5650-05
Chapter 8. Technical Drawings 8.4.5 Type LB 5650-05 MicroPolar (++) LB 566... -
Page 83: Type Lb 5650-09
Chapter 8. Technical Drawings 8.4.6 Type LB 5650-09 MicroPolar (++) LB 566... -
Page 84: Installation Situation In Pipelines
Chapter 8. Technical Drawings 8.4.7 Installation Situation in Pipelines MicroPolar (++) LB 566... -
Page 85: Dimensional Drawings Container Flush Probes
Chapter 8. Technical Drawings 8.5 Dimensional Drawings Container Flush Probes 8.5.1 Type LB 5651-01 MicroPolar (++) LB 566... -
Page 86: Type Lb 5651-02
Chapter 8. Technical Drawings 8.5.2 Type LB 5651-02 MicroPolar (++) LB 566... -
Page 87: Type Lb 5651-03
Chapter 8. Technical Drawings 8.5.3 Type LB 5651-03 MicroPolar (++) LB 566... -
Page 88: Installation Situation In Pipelines
Chapter 8. Technical Drawings 8.5.4 Installation Situation in Pipelines MicroPolar (++) LB 566... - Page 89 Index Index Accuracy · 55 Factory setting · 15 Adapter flange · 42 Fitting flange · 41 ASA flange adapter · 59 Flat gasket · 41 Assembly on a container · 33 Flow cell · 25 Assembly on a pipeline · 32 Flow cell installation ·...
- Page 90 Index Overview sealing washers · 60 Synchronization · 20 Pipeline pressure · 36 technical data · 55 Power radiation · 14 Technical data HF cable · 61 Power supply · 45 Technical data sensors · 58 Principle of measurement · 17 Technical drawings ·...
- Page 91 Notes Notes MicroPolar (++) LB 566...
- Page 92 Notes Notes MicroPolar (++) LB 566...
- Page 93 Concentration Meters MicroPolar (++) LB 566 User’s Guide Software Manual 41986BA2 Rev. Nr.: 06-E, 09/2017...
- Page 95 The units supplied should not be repaired by anyone other than Berthold Service en- gineers or technicians by Berthold. In case of operation trouble, please address to our central service department (ad- dress see below). The complete user’s guide consists of the hardware manual and the software manual.
- Page 96 Table of Contents Table of Contents Page Chapter 1. Safety Summary Chapter 2. Communication with MicroPolar Chapter 3. Getting Started Guide Chapter 4. Software Functions 4.1 Information on the Menu Structure 4.2 Menu Structure 4.2.1 Start Menu 4.2.2 Diagnostic 4.2.3 Setup 4.2.4 Access Level 4.2.5 Language 4.2.6 Configuration...
- Page 97 Table of Contents Chapter 6. Calibration 6.1 System Adjust 6.1.1 Verifying the Reference Values 6.2 Sampling 6.2.1 Entering the Lab Values 6.3 Calibration Chapter 7. Start-up of MicroPolar ++ Chapter 8. Calibration and Advanced 8.1 Plausibility | Configuring Phi/Att Ratio 8.1.1 Phi/att Ratio 8.1.2 Process Recording 8.2 Adjusting the Calibration...
-
Page 99: Chapter 1. Safety Summary
Chapter 1. Safety Summary Chapter 1. Safety Summary Please observe all safety instructions in the Hardware Manual, es- pecially those in chapter 1 Safety Summary. Parameter settings Never change the installation and the parameter settings without a full knowledge of these operating instructions, as well as a full knowledge of the behavior of the connected controller and the possible influence on the operating process to be controlled. -
Page 101: Chapter 2. Communication With Micropolar
Chapter 2. Communication with MicroPolar Chapter 2. Communication with MicroPolar The communication with MicroPolar and MicroPolar ++ is car- ried out via 4 softkey buttons. The function of the individual buttons changes relative to the position in the menu. Values and texts are entered via an alphanumeric keyboard. -
Page 103: Chapter 3. Getting Started Guide
Chapter 3. Getting Started Guide Chapter 3. Getting Started Guide To get started, please carry out the steps described below one after the other. Please read chapter 8 Start-up of the MicroPolar ++ before you take the high dynamics version into operation. Chapter 4 Software Functions describes all software functions and also serves as a reference guide. -
Page 105: Chapter 4. Software Functions
Chapter 4. Software Functions Chapter 4. Software Functions Information on the Menu Structure The menu structure on the following pages provides an over- view of all functions of the LB 566. Using the page numbers indicated you can look up the function of the depicted win- dow. -
Page 106: Menu Structure
Chapter 4. Software Functions Menu Structure Live Display – | Live Display | 07.05 13:25 Diagnostic Diagnostic Concentration av. Setup Datalog Access Level Errorlog Page 16 65.50 Language Info Print Setup Page 16 Conc. act. 64.35% Setup Conc. av. ESC SAMPLE ..▼▲.. ZOOM See next page Setup See next page... - Page 107 Chapter 4. Software Functions Configuration Setup General Data General Data Live Display Configuration Date Measurement Diagnostic Calibration System Adjust Time Page 27 Page 22 Plausibility Input / Output Setup Adjust Microwave Service Access Level Ref. values Mass Flow Product Language Measure- Chart Phi Units...
-
Page 108: Start Menu
Chapter 4. Software Functions 4.2.1 Start Menu Live Display Shows the live display. 1 | - | LB 566 | 07.05 - 13:25 Diagnostic: Live Display This menu item contains the submenu items data logger, Diagnostic error log, device information and print setup. Setup Access Level Language... - Page 109 Shows the logged error The last 20 error messages will be stored with date and time. Info: :... Device type : LB 566 Supplier : Berthold Technologies Manufacturer : Berthold Technologies Device no. : ... Production no. : ...-...
-
Page 110: Setup
Chapter 4. Software Functions 4.2.3 Setup Configuration: Setup of 1 | - | Setup | 07.05 – 13:25 General data Measurement-specific data Configuration Plausibility data Calibration Input / Output Microwave data Service Units Product Marker Change password ⌂◄... -
Page 111: Access Level
Chapter 4. Software Functions 4.2.4 Access Level Read only: In this mode, the measuring system can be protected against unauthorized access. You can exit this level only by entering a password. The measuring system cannot be 1 | - | Access Level | 07.05 – 13:25 started and stopped. -
Page 112: Configuration
Chapter 4. Software Functions 4.2.6 Configuration General Data: Enter date, time and tag 1 | - | Configuration | 07.05 – 13:25 General Data Measurement: Measurement Meas. Mode (batch/continuous) Plausibility Start Mode (keyboard/external) Microwave Averaging (number of measured values used for aver- Mass Flow Units aging) -
Page 113: General Data
Chapter 4. Software Functions Markers: Enter a value and a name (up to 5 characters) for the marker here. The presentation takes place in the live dis- play and refers to the bar chart. To disable the marker, select a marker value outside of the chart limits or the current output limits. -
Page 114: Plausibility
Chapter 4. Software Functions 4.2.9 Plausibility Process Limits: 1 | - | Plausibility | 07.05 – 13:25 Enter a permissible measuring range exceeding. If the Process limits concentration exceeds the range, the concentration aver- Phase Measure age is put on hold and an error message is displayed (er- Offline mode ror state). -
Page 115: Phase Measurement
Chapter 4. Software Functions 4.2.10 Phase Measurement Sigma max.: 1 | - | Phase Measure | 07.05 – 13:25 Here you set the maximum sigma of the regression Phase Sigma max. vs. Frequency. Phi/att ratio During normal measurement operation, sigma lies be- Auto set tween 0 and 100. -
Page 116: Massflow
Chapter 4. Software Functions 4.2.12 Massflow The MASSFLOW menu appears only if two prerequisites have been fulfilled: 1. The density unit g/cm^3 is selected for the concentration. 2. Current input 2 is enabled and m/s has been selected as unit for current input 2. For this case, the mass flow (throughput) in tons per hour can be displayed and output via the current output, based on the density reading with indication of the pipe cross-section... -
Page 117: Calibration
Chapter 4. Software Functions 4.2.13 Calibration System Adjust: 1 | - | Calibration | 07.05 – 13:25 System calibration is started here. System Adjust For details see chapter 4.2.14 System Adjust. Calibrate Conc Calibrate Conc2 Advanced Calibrate Conc: Opens the calibration menu of concentration 1. ⌂◄... -
Page 118: Calibrate Concentration
Chapter 4. Software Functions 4.2.15 Calibrate Concentration Sampling: 1 | Calibrate Conc | 07.05 –13:25 Shows all measured samples and entered lab values. Sampling Calibration Calibration: Tuning Result Here - you select the calibration parameters, the temperature ⌂◄ ▲ ▼ ►... -
Page 119: Sampling
Chapter 4. Software Functions 4.2.16 Sampling The header includes the following information (from left to 1 | 1/1 | Sample # 1 | 07.05 –13:25 right): Next sample Product no. Active Current table position / Total number of entries Measured value 65.50% Lab value... -
Page 120: Sample Data (Expanded)
Chapter 4. Software Functions 4.2.17 Sample Data (expanded) Current In 1: 1 | 1/1 | Sample # 1 | 07.05 –13:25 Editable display of the first compensation input. Current In 1 Current In 2 Current In 2: PT100 Editable display of the second compensation input. Phi(fm): Attenuation ◄... -
Page 121: Calibration
Chapter 4. Software Functions 4.2.19 Calibration Calibration is performed using the following formula: Eq. 4-4 Measured value = A ∙ Phase + B ∙ Attenuation + C + D ∙ PT100 + E ∙ Input1 + F ∙ Input2 + G ∙ Load where: Meas. -
Page 122: Inputs / Outputs
Chapter 4. Software Functions Compensation Input Here you can select the analog inputs (PT100, current in- put 1 and 2) required for compensation. Depending on the enabled analog inputs, the following options can be select- None In1 + In2 ... -
Page 123: Current Output
Chapter 4. Software Functions 4.2.21 Current Output 1 | - | Current Output | 07.05 –13:25 Current Out 1 IMPORTANT Current Out 2 If a measurement is running, enabling a current input which is not used or not adjusted may cause an error. ⌂◄... -
Page 124: Current Out
Chapter 4. Software Functions To check the current loop and possibly connected remote displays, you can set a current between 4 and 20 mA via the test function. If you quit the test function, the system automatically switches back to the live current. Error current: If the measurement switches to the fault state, a fault current is output via the current output;... -
Page 125: Current Input
Chapter 4. Software Functions 4.2.25 Current Input 1 Status: 1 | - | Current Input 1 | 07.05 –13:25 Status Select yes/no to enable or disable the current input. Range 0/4 mA Range: 20 mA Adjust Change the current output Live current ... -
Page 126: Pt100
Chapter 4. Software Functions 4.2.27 PT100 Enabled: If a PT100 is connected, the input has to be enabled first. 1 | - | PT100 |07.05 –13:25 IMPORTANT Enabled If a measurement is running, enabling a PT100 input PT100 Adjust PT100 Live which is not used or not adjusted may cause an error. -
Page 127: Digital Output
Chapter 4. Software Functions 4.2.28 Digital Output The meter has two relays. Relay 1 is linked with LED signal 1 and relay 2 with LED signal 2. Relay 1: 1 | - | Digital Output | 07.05 –13:25 Different functions can be assigned to relay 1: Relay 1 ... - Page 128 Chapter 4. Software Functions DI 2 Function The following functions can be assigned to DI 2: None Hold (averaging is stopped) Product (external product selection) DI 3 Function Assignments for DI 3: None Sample (external control of sampling) ...
-
Page 129: Service
Chapter 4. Software Functions 4.2.30 Service Factory setting and General reset: 1 | - | Service | 07.05 – 13:25 See table on the next side. Factory setting General Reset Memory Tool: Memory Tool Data printout Refers to the communication with the external memory tool (optional accessory). - Page 130 Chapter 4. Software Functions Factory setting General reset Language selection unchanged unchanged Access level unchanged default: User mode Measurement stopped stopped Password unchanged default: PASS1 Product selection unchanged all products deleted Error log not deleted deleted Data log not deleted, default deleted, default set- settings tings...
-
Page 131: Trend Display
Chapter 4. Software Functions Trend Display 1 | - | Live Display | 07.05 – 13:25 Push the ZOOM button to enlarge the measurement value Concentration av. which is surrounded by a frame. 43.20 % Conc. av. Conc. act. 45 % ▲▼... -
Page 133: Chapter 5. Configuration
Chapter 5. Configuration Chapter 5. Configuration Before doing any calibration work, you have to enable and configure the required analog inputs and check and, if neces- sary, correct the configuration parameters. If the required inputs are not enabled, some menus are not displayed and a proper configuration and calibration is not possible under certain circumstances. -
Page 134: Measurement
Chapter 5. Configuration Example: 1 | - | General Data | 07.05 – 13:25 Select the respective entry, edit and store it. Date 07.05.2004 Time 13:25 DATE ⌂◄ ▲ ▼ ► 1 | - | General Data | 07.05 – 13:25 Push to delete the entry and then enter the new date. -
Page 135: Microwave
Chapter 5. Configuration 5.1.4 Microwave 1 | - | Microwave | 07.05 – 13:25 Cables CABLES ⌂◄ ▲ ▼ ► 1 | - | Cables | 07.05 – 13:25 If the factory-set cable lengths do not match the actual geome- try conditions, you have to correct the values. -
Page 136: Marker
Chapter 5. Configuration 1 | - | Units | 07.05 – 13:25 Conc % TS Conc 2 Current In 1 °C CURRENT IN 1 ⌂◄ ▲ ▼ ► 1 | - | Units | 07.05 – 13:25 Current in 1 None ... -
Page 137: Start Calibration Coefficients
Chapter 5. Configuration Start Calibration Coefficients Starting from the main menu, go to the display shown on the left via: 1 | Calibrate Conc | 07.05 –13:25 ESC | SETUP | CALIBRATION | CALIBRATE CONC | Sampling Calibration CALIBRATION Tuning Result ⌂◄... -
Page 138: Configure Plausibility
Chapter 5. Configuration Configure Plausibility Starting from the main menu, go to the display shown on the left via: | SETUP | CONFIGURATION | PLAUSIBILITY | PHASE MEAS- URE | The display on the left shows the default settings, which may 1 | - | Phase measure | 07.05 –... -
Page 139: Chapter 6. Calibration
Chapter 6. Calibration Chapter 6. Calibration Note: The measuring system must have reached normal operat- ing temperature (approx. 45 min. warm-up time)). The flow cell must be completely filled with product or the con- tainer probe is completely surrounded by product. The measuring system has to operate at a normal throughput and/or material flow and the usual material under actual operat- ing conditions. - Page 140 Chapter 6. Calibration 1 | - |System Adjust | 07.05 –13:25 Adjust ADJUST Ref. values Chart Phi Chart Attenuation ⌂◄ ▲ ▼ ► 1 | - |System Adjust | 07.05 –13:25 Confirm System adjustment now? ..X..√.. 1 | - |System Adjust | 07.05 –13:25 System adjustment is in process.
-
Page 141: Verifying The Reference Values
Chapter 6. Calibration 6.1.1 Verifying the Reference Values Starting from the main menu, go to the display shown on the 1 | - |System Adjust | 07.05 –13:25 left via | SETUP | CALIBRATION | SYSTEM ADJUST | Adjust Ref. values ... - Page 142 Chapter 6. Calibration The display to the left appears if you push RUN. 1 | - | Live Display | 07.05 – 13:25 Concentration av. 65.50 Note: Push the SAMPLE button to start measurement of the raw data. At the same time, the laboratory sample has to be taken Conc.
-
Page 143: Entering The Lab Values
Chapter 6. Calibration 6.2.1 Entering the Lab Values 1 | - | Live Display | 07.05 – 13:25 Push to go to the main menu. A measurement can be stopped only in the main menu. Concentration av. 65.50 Conc. av. Conc. -
Page 144: Calibration
Chapter 6. Calibration 1 | Calibrate Conc | 07.05 –13:25 SAMPLING Sampling Calibration Tuning Result ⌂◄ ▲ ▼ ► 1 | 1/1 | Sample # 1 | 07.05 –13:25 Next sample Active LAB VALUE Measured value 65.50% Laborwert 0.00 % Advanced ◄... -
Page 145: Chapter 7. Start-Up Of Micropolar
Chapter 7. Start-up of MicroPolar ++ Chapter 7. Start-up of MicroPolar ++ System adjustment and calibration are carried out in just the same way for MicroPolar ++, as they are for the standard system MicroPolar. However, please keep in mind that the ++ unit requires a minimum attenuation of 40 dB over the entire concentration range and during system adjustment. -
Page 147: Chapter 8. Calibration And Advanced
Chapter 8. Calibration and Advanced Chapter 8. Calibration and Advanced Plausibility | Configuring Phi/Att Ratio Starting from the main menu, go to the display shown on the left via | SETUP | CONFIGURATION | PLAUSIBILITY | PHASE MEASURE | 1 | - | Phase measure | 07.05 – 13:25 Check or correct corresponding to the settings shown on the left. -
Page 148: Process Recording
Chapter 8. Calibration and Advanced 8.1.2 Process Recording Prerequisite: The steps described in chapter 5. Configuration 6.1 System Calibration have been completed. The process recording is used to determine the ratio of phase and attenuation (Phi/att), a parameter of the plausibility analysis for correct determination of the phase. - Page 149 Chapter 8. Calibration and Advanced 1 | Phase Measure | 07.05 –13:25 Auto set ▲▼ ..?..√.. 1 | Phase Measure | 07.05 –13:25 Sigma max. 100.00 Phi/att ratio 5.32 Auto set Pause recording: ⌂◄ ▲ ▼ ► You have the option to pause recording by turning the re- cording off.
-
Page 150: Adjusting The Calibration
Chapter 8. Calibration and Advanced Adjusting the Calibration A correction factor and an offset may be entered later to ob- tain a subsequent adjustment of the calibration (fine tuning). Below please find an example for an offset adjustment. The display to the left appears if you push RUN. The display reading is now compared with the analysis value 1 | - | Live Display | 07.05 –... - Page 151 Chapter 8. Calibration and Advanced 1 | Calibrate Conc | 07.05 –13:25 Sampling Calibration TUNING Tuning Result ⌂◄ ▲ ▼ ► 1 | - | Calibration | 07.05 –13:25 Factor 1.00000 Offset 0.000 OFFSET ⌂◄ ▲ ▼ ► Calculation formulas see chapter 4.2.16 Calibrate Concentra- tion.
-
Page 152: Output Of The Start-Up Protocol
Chapter 8. Calibration and Advanced Output of the Start-up Protocol Starting from the main menu, go to the display on the left by selecting | DIAGNOSTIC | 1 | - | Diagnostic | 07.05 – 13:25 Datalog PRINT SETUP Error log Info Print Setup... -
Page 153: Calibration
Chapter 8. Calibration and Advanced Calibration There are several setup options for calibration; for details see chapter 4.2.20 Calibration. Furthermore, the default settings are displayed, which, as a rule, are the best choice. Prerequisite: The steps described in chapter 5. Configuration 6.1 System Calibration 6.2 Sampling have been completed. - Page 154 Chapter 8. Calibration and Advanced Set the desired compensation: For compensation such as temperature compensation 1 | - | Calibration | 07.05 – 13:25 proceed as follows: Start Calibr. Cal. Base COMPENSATION Loading comp. Comp. input None Coefficients Here you can select the analog inputs (PT100, current input 1 and 2) required for compensation (e.g.
- Page 155 Chapter 8. Calibration and Advanced 1 | - | Calibration | 07.05 –13:25 The graph on the left shows the measured value versus the lab value. .►. ► 1 | - | Calibration | 07.05 –13:25 Output of the correlation between measured value and lab value.
-
Page 156: Calibration With Two Concentrations
Chapter 8. Calibration and Advanced 8.4.1 Calibration with Two Concentrations Calibration for two concentrations starts by changing the process type as described below. Starting from the main menu, go to the display shown on the left via | SETUP | CALIBRATION | 1 | - | Calibration | 07.05 –... - Page 157 Chapter 8. Calibration and Advanced There is only one sample table for both calibrations. The lab values have to be entered for all samples used for cali- bration of concentration 1. All other samples have to be disabled (Active: Yes/No). 1 | 1/4 | Sample # 1 | 07.05 –13:25 Next sample Active...
- Page 158 Chapter 8. Calibration and Advanced 1 | 2/4 | Sample # 2 | 07.05 –13:25 Make sure that all samples have been processed and only those Next sample samples are active which are relevant for this calibration. Active Measured value 74.35 % Lab value 67.80 %...
- Page 159 Chapter 8. Calibration and Advanced 1 | - | Calibration | 07.05 – 13:25 Start Calibr. Push twice to return two pages. ⌂◄ Cal. Base Loading comp. Comp. input None Coefficients ⌂◄ ▲ ▼ ► 1 | - | Calibration | 07.05 – 13:25 System Adjust Calibrate Conc Calibrate Conc2...
-
Page 160: Calibration With Split Value
Chapter 8. Calibration and Advanced 8.4.2 Calibration with Split Value With this type of calibration, two characteristic curves (con- centrations) are combined in one measuring range; their point of intersection defines the split value. Conc 1 for the lower and conc 2 for the upper measuring range can be output only together via current output. - Page 161 Chapter 8. Calibration and Advanced Sample measurements are carried out continuously over the en- tire measuring range with the display depicted to the left. See chapter 6.3 Sampling 1 | - | Live Display | 07.05 – 13:25 Concentration av. 65.50 After completion of sampling, the individual samples will be Conc.
-
Page 162: Typical Calibration Coefficients/Start Values
Chapter 8. Calibration and Advanced 1 | - | Calibration | 07.05 – 13:25 System Adjust Calibrate Conc CALIBRATE CONC Calibrate Conc2 Advanced ⌂◄ ▲ ▼ ► 1 | - |Calibrate Conc2|07.05 –13:25 Sampling CALIBRATION Calibration Tuning Result The lower concentration is now calibrated. -
Page 163: Chapter 9. Password
Chapter 9. Password Chapter 9. Password The measuring system can be protected against unauthorized access by passwords. The access levels are as follows. Read only The measuring system cannot be started and stopped. You can only switch from the live display to Diagnostic and to Ac- cess Level. -
Page 165: Chapter 10. Error Lists And Device States
HF unit. Check connector on the mother- board. Caution! First, disconnect the evaluation unit from the power supply! For all other error messages, please contact the Berthold Technologies Service. 10.2 Input Error Error Probable Cause Value too large... -
Page 166: Measurement Error And Error Prompts
The concentration calculated on out of range the basis of the current is out- side the current range Date/Time Please enter the date and time. not set For all other error messages, please contact the Berthold Technologies Service. MicroPolar (++) LB 566... -
Page 167: Device States
Chapter 10. Error Lists and Device States 10.4 Device States Error state: This state occurs also in error codes 50 to 56, 60 to 62 and 70 to 71 (see table above). The evaluation units behave as follows: LEDs: RUN flashes, ERROR on, signal 1 and 2 depending on the configuration. -
Page 169: Chapter 11. Start-Up Protocol
Chapter 11. Start-up Protocol Chapter 11. Start-up Protocol The log can be output via RS232 and RS485. The printout takes place on the menu | DIAGNOSTIC | PRINT SETUP |. The serial interfaces RS232 and RS485 have the following port settings: Data transfer rate 38400 Bd, 8 data bits, no parity, 1 stop bit The log is saved to a TXT file using a terminal program. - Page 170 Chapter 11. Start-up Protocol Parameter Code Information Calibration Exp. cal. input selection: input None selection Input 1 Input 1 + Input 2 Input 1 + PT100 Input 1 + Input 2 + PT100 Input 2 Input 2 + PT100 PT100 Calibration Calibration base: variable...
- Page 171 Chapter 11. Start-up Protocol Parameter Code Information AI Ena- State current in 2 bled[2] DO Function Function of digital outputs: None Error Hold No product Alarm min. Alarm max. DO Assign- Digital output: the min./max. ment alarm is assigned to the following: Concentration Concentration 2 Current input 1...
-
Page 172: Example Of Start-Up Protocol
Chapter 11. Start-up Protocol 11.1 Example of Start-up Protocol Menu: Start-up Protocol Interpretation: Start of Setup: (* Only relevant for service) Prod- Prod. Prod. Product Entry Product1 uct2 Log type : Log type: see code list Data log Log time: Log time: see code list Number of errors : Number of entries in the error log... - Page 173 Chapter 11. Start-up Protocol Calibrate Exp. Cal. input selection: see code list Calibration input selection : Conc Calibration mode Calibration variable : Calibration basis: see code list Phase coefficients : Phase coefficient Attenuation coefficients : Attenuation Coefficient Constant coefficient : Constant d coefficient Comp-coefficient for PT100 input...
- Page 174 Chapter 11. Start-up Protocol Current Enabled: output 1 AI Enabled : Disabled: 0 AI Range selection : Range: see code list AI Upper range value : Upper value AI Lower range value : Lower limit Analog input filter constant : Current Enabled: output 2...
- Page 175 Chapter 11. Start-up Protocol System adjustment data: Start of Reference Data Product 1: Mean Atten.: 46.8509 dB Phase at fm: 42.6285 deg/GHz Phase slope: 380,984 deg/GHz Phase sigma: 0.24575 Transformed Frequency[GHz] Phase[Deg] ] Atten.[dB] Phase[Deg 2.42 35.64 35.64 21.98 2.43 361.81 361.81 21.95...
Need help?
Do you have a question about the MicroPolar LB 566 and is the answer not in the manual?
Questions and answers