Table of Contents

Related Manuals for Keysight N9320B


Summary of Contents for Keysight N9320B
- Page 1 Keysight N9320B Spectrum Analyzer Notice: This document contains references to Agilent. Please note that Agilent’s Test and Measurement business has become Keysight Technologies. For more information, go to www.keysight.com. User’s Guide...
-
Page 2: Safety Notices
Ed ition data. Do not proceed beyond a pose. Keysight shall not be liable for CAUTION notice until the indicated errors or for incidental or consequential Fourth Edition, June 2014... -
Page 3: Table Of Contents
Contents Overview Keysight N9320B at a Glance Front Panel Overview Rear Panel Overview Front and rear panel symbols Getting Started Check the Shipment and Order List Safety Notice Power Requirements Power On and Check Environmental Requirements South Korea Class A EMC Declaration... - Page 4 Contents Viewing a Signal Measuring Multiple Signals Comparing Signals on the Same Screen Using Marker Delta Comparing Signals not on the Same Screen Using Marker Delta Resolving Signals of Equal Amplitude Resolving Small Signals Hidden by Large Signals Measuring a Low-Level Signal Reducing Input Attenuation Decreasing the Resolution Bandwidth Trace Averaging...
- Page 5 Contents Analysis the Modulated Signals AM/FM Modulation Analysis ASK/FSK Modulation Analysis Measuring Channel Power Viewing Catalogs and Saving Files Locating and Viewing Files in the Catalog Saving a File Loading a File Copying a File Deleting a File Key Reference Amplitude Auto Tune Back <-...
- Page 6 Contents Intermod (TOI) Spectrum Emission Mask MODE Tracking Generator Power Meter AM/FM Modulation Analysis ASK/FSK Modulation Analysis Peak Search Preset/System SPAN Sweep/Trig Trace Instrument Messages Overview Command Errors Execution Conflict Device-Specific Errors Troubleshooting Check the basics Contact Keysight Technologies Index...
- Page 7 Contents Menu Maps Amplitude Menu BW/Avg Menu Det/Display Menu File Menu (1 of 2) File Menu (2 of 2) Frequency Menu Marker Menu Marker-> Menu Measure Menu (1 of 2) Measure Menu (2 of 2) MODE - Tracking Generator MODE - Power Meter MODE - AM/FM Modulation Analysis MODE - ASK/FSK Modulation Analysis Name Editor Menu...
- Page 8 Contents...
-
Page 9: Overview
Keysight N9320B at a Glance Front Panel Overview Rear Panel Overview Front and rear panel symbols This chapter provides a description of the Keysight N9320B spectrum analyzer and an introduction to the buttons, features, and functions of the front and rear instrument panels. -
Page 10: Keysight N9320B At A Glance
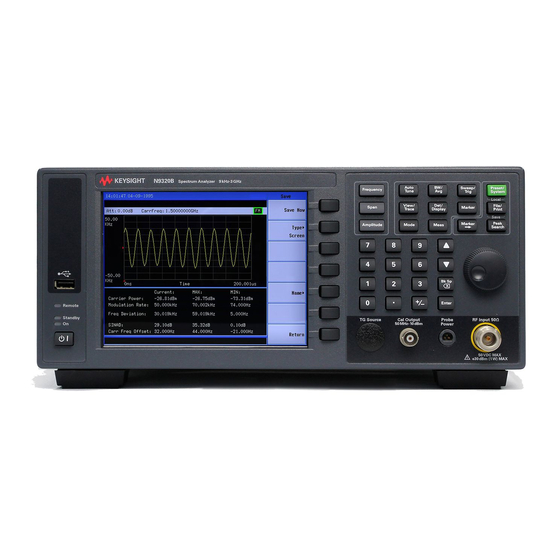
Overview Keysight N9320B at a Glance Keysight N9320B at a Glance The Keysight N9320B spectrum analyzer is a portable, swept spectrum analyzer with a frequency range of 9 kHz to 3.0 GHz. It can be a fundamental component of an automated system. - Page 11 Overview Keysight N9320B at a Glance • Modulation Analysis Function provides optional AM/FM and ASK/FSK modulation analysis function. (AM/FM: Option- AMA ASK/FSK: Option- DMA) • Tracking Generator provides an RF source for scalar network analysis (Option- TG3). For the latest product information, please refer to the link below: http://www.keysight.com/find/n9320b...
-
Page 12: Front Panel Overview
Overview Front Panel Overview Front Panel Overview N9320B 9 kHz - 3.0 GHz SPECTRUM ANALYZER Preset/ Frequency Auto Sw eep/ Tune Trig System Local View / Det/ File/ SPAN M arker Print Trace Display Save M arker Peak Amplitude M ODE... - Page 13 Overview Front Panel Overview • Auto Tune searches the signal automatically and locates “Auto Tune” on the signal to the center of the graticule. see page • BW/Avg activates the resolution bandwidth function and accesses the softkeys that control the bandwidth functions and averaging.
- Page 14 Overview Front Panel Overview Data Control Keys includes the numeric keypad, ENTER key and backspace key, change the numeric value of an active function such as center frequency, start frequency, resolution bandwidth, and marker position. RF IN connector is the signal input for the analyzer. The maximum damage level is average continuous power +40 dBm, DC voltage 50 VDC or max pulse voltage 125 V.
- Page 15 Overview Front Panel Overview Display Annotations Item Description Notes (Associated function key) Amplitude scale [Amplitude] > Scale Type Detector mode [Det/Display] > Detector Reference level [Amplitude] > Ref Level Active function block The function in use Time and date display [Preset/System] >...
- Page 16 Overview Front Panel Overview Softkey menu Refer to for details. “Key Reference” Dependent on current function key selection. Frequency span [SPAN] Sweep time [Sweep/Trig] > Sweep Time Video bandwidth [Bw/Avg] > Video BW Display status line Display status and instrument messages. Resolution bandwidth [Bw/Avg] >...
-
Page 17: Rear Panel Overview
Overview Rear Panel Overview Rear Panel Overview SERIAL LABEL ATTACH HERE REF OUT 10MHz REF IN ~100-240 V TRIG IN GPIB 50-60 Hz 100 W MAX 10MHz HIPOT LABEL ATTACH HERE T T L REF OUT connector provides a frequency of 10 MHz, amplitude of –10 dBm reference output. -
Page 18: Front And Rear Panel Symbols
WEEE Directive(2002/96/EC) marking requirements and you must not discard this equipment in domestic household waste. Do not dispose in domestic household waste. To return unwanted products, contact your local Keysight http://www.keysight.com/environment/product/ office, or refer to... -
Page 19: Getting Started
Getting Started Getting Started Check the Shipment and Order List Safety Notice Power Requirements Power On and Check Environmental Requirements South Korea Class A EMC Declaration Helpful Tips This chapter helps you in preparing the spectrum analyzer for use and provides the information to start using the spectrum analyzer correctly. -
Page 20: Check The Shipment And Order List
You will not need to wait for a claim settlement. • Keep the shipping materials for the carrier’s inspection. • If you must return an analyzer to Keysight Technologies, use the original (or comparable) shipping materials. For any questions about your shipment, please contact... - Page 21 K to the product number and then specify which option you are ordering. For example, N9320BK- TG3. For the latest information on Keysight N9320B spectrum analyzer options and upgrade kits, visit the following http://www.keysight.com/find/n9320b...
-
Page 22: Safety Notice
To install the spectrum analyzer in other racks, note that they may C A U T I O N promote shock hazards, overheating, dusting contamination, and inferior system performance. Consult your Keysight customer engineer about installation, warranty, and support details. -
Page 23: Power Requirements
Getting Started Power Requirements Power Requirements The spectrum analyzer has an auto- ranging line voltage input. The AC power supply must meet the following requirements: Voltage: 100 to 240 VAC (90 to 264 VAC) Frequency: 50 to 60 Hz Power: Maximum 100 W AC Power Cord The analyzer is equipped with a three- wire power cord, in... - Page 24 Getting Started Power Requirements AC Power Cords Plug Type Cable Part For use in Plug Number Country & Region Description 8121-1703 BS 1363/A Option 900 United Kingdom, Hong Kong, Singapore, Malaysia 250V 10A 8120-0696 AS 3112:2000 Option 901 Australia, New Zealand 250V 10A 8120-1692 IEC 83 C4...
-
Page 25: Power On And Check
Getting Started Power On and Check Power On and Check Connect the AC power cord into the instrument. Insert the plug into a power socket provided with a protective ground. Set the tilt adjustors for your preference. Figure 1 Plug in and angle adjustment Press the AC line switch on the rear panel. - Page 26 System delete the messages. Cycle the power to the analyzer and re- check to see if the instrument messages are still there. If the error messages cannot be resolved, please contact the Keysight Customer Contact Center for assistance or service.
-
Page 27: Environmental Requirements
Getting Started Environmental Requirements Environmental Requirements Keysight Technologies has designed this product for use in Installation Category II, Pollution Degree 2, per IEC 61010- 1. Keysight has designed the spectrum analyzer for use under the following conditions: • Indoor use •... - Page 28 Getting Started Environmental Requirements Rack Mount It is recommended to use the Keysight rackmount kit (option 1CM) to install the spectrum analyzer into a rack. Do not attempt to rack mount the spectrum analyzer by the front panel handles only. This rackmount kit will allow mounting of the spectrum analyzer with or without handles.
- Page 29 Installing the spectrum analyzers into other racks may promote shock C A U T I O N hazards, overheating, dust contamination, and inferior system performance. Consult your Keysight customer engineer about installation, warranty, and support details.
-
Page 30: South Korea Class A Emc Declaration
Getting Started South Korea Class A EMC Declaration South Korea Class A EMC Declaration This equipment is Class A suitable for professional use and is for use in electromagnetic environments outside of the home. -
Page 31: Helpful Tips
Perform a Self Alignment The N9320B provides a self alignment function to manually align the amplitude based on the time base. The analyzer should warm up for approximately 30 minutes before self alignment. -
Page 32: Using An External Reference
Enable an Options Option license key information is required to enable product options. Contact your nearest Keysight office for purchasing a license. Refer to the procedures below to activate the options you have purchased. > More > More > Licensing > Option... -
Page 33: Firmware Upgrade
Follow this procedure to finish the firmware update: Download the firmware package from web. Extract and copy the file version and folder “n9320b” into the root directory of a USB stick. > Upgrade Preset/ Plug the USB stick into the connector. -
Page 34: Power Preset Last
(essentially uplugging, replugging). > {Pwr On/Preset} > {Power On Last} to activate this Preset/ Press System function. For the standard N9320B, this operation only save the last state if the analyzer is turned off by the front panel power switch. -
Page 35: Functions And Measurements
Functions and Measurements Functions and Measurements Making a Basic Measurement Measuring Multiple Signals Measuring a Low-Level Signal Improving Frequency Resolution and Accuracy Tracking Drifting Signals Making Distortion Measurements Measuring Phase Noise Stimulus Response Transmission Measuring Stop Band Attenuation of a Lowpass Filter Making a Reflection Calibration Measurement Measuring Return Loss with the Reflection Calibration Routine Making an Average Power Measurement... -
Page 36: Making A Basic Measurement
Functions and Measurements Making a Basic Measurement Making a Basic Measurement In this guide, the keys labeled with [ ], for example, [Preset/System] refer to front- panel hardkeys. Pressing many of the hardkeys accesses softkey menus that are displayed along the right side of the screen. The softkey menu labels are aligned so that they are located next to the softkeys at the right side of the display screen. -
Page 37: Presetting The Spectrum Analyzer
Functions and Measurements Making a Basic Measurement Presetting the Spectrum Analyzer Preset function provides a known instrument status for making measurements. There are two types of presets, factory and user: Factory Preset When this preset type is selected, it restores the analyzer to its factory- defined state. -
Page 38: Viewing A Signal
Functions and Measurements Making a Basic Measurement Viewing a Signal Refer to the procedures below to view a signal. > Pow on/Preset > Preset Type > Factory to enable Preset/ Press System the factory- defined preset state. > Preset to restore the analyzer to its Preset/ Press System... - Page 39 Functions and Measurements Making a Basic Measurement Note that the frequency and amplitude of the marker appear both in the active function block, and in the upper- right corner of the screen. Figure 3-1 10 MHz Internal Reference Signal Marker Annotation Active function block Marker 10.000000 MHz...
-
Page 40: Measuring Multiple Signals
Functions and Measurements Measuring Mul tiple Signals Measuring Multiple Signals This section provides the information on how to measure multiple signals. Comparing Signals on the Same Screen Using Marker Delta The delta marker function allows the user to compare two signals when both appear on the screen at the same time. - Page 41 Functions and Measurements Measuring Mul tiple Signals Move the second marker to another signal peak using the front- panel knob or by using Peak Search. > Next Peak or Peak Press Search > Next Pk Right or Next Pk Left. Continue pressing Peak Press Search...
-
Page 42: Comparing Signals Not On The Same Screen Using Marker Delta
Functions and Measurements Measuring Mul tiple Signals Comparing Signals not on the Same Screen Using Marker Delta The analyzer will compare the frequency and amplitude differences between two signals which are not displayed on the screen at the same time. (This technique is useful for harmonic distortion tests.) In this example, the analyzer’s 10 MHz signal is used to measure frequency and amplitude differences between a... - Page 43 Functions and Measurements Measuring Mul tiple Signals Figure 3-3 shows the reference annotation for the delta marker (1R) at the left side of the display, indicating that the marker set at the 50 MHz reference signal is at a lower frequency than the frequency range currently displayed.
-
Page 44: Resolving Signals Of Equal Amplitude
Functions and Measurements Measuring Mul tiple Signals Resolving Signals of Equal Amplitude In this example a decrease in the resolution bandwidth (RBW) is used in combination with a decrease in video bandwidth (VBW) to resolve two signals of equal amplitude with a frequency separation of 100 kHz. - Page 45 Functions and Measurements Measuring Mul tiple Signals If the signal peak is not present on the display, increase the frequency span out to 20 MHz, turn signal tracking on, decrease the span back to 2 MHz and turn signal tracking off: >...
- Page 46 Functions and Measurements Measuring Mul tiple Signals Figure 3-6. Use the Two signals are now visible as shown in front- panel knob or arrow keys to further reduce the resolution bandwidth and better resolve the signals. Decreasing the resolution bandwidth improves the resolution of the individual signals and increases the sweep time.
-
Page 47: Resolving Small Signals Hidden By Large Signals
Functions and Measurements Measuring Mul tiple Signals Resolving Small Signals Hidden by Large Signals This example uses narrow resolution bandwidths to resolve two RF signals that have a frequency separation of 50 kHz and an amplitude difference of 60 dB. Connect two sources to the RF IN as shown in Figure 3-4. - Page 48 Functions and Measurements Measuring Mul tiple Signals Reduce the resolution bandwidth filter to view the smaller signal. The smaller signal will be hidden by the larger signal when the bandwidth settings are wider, as in Figure 7. Reducing the RBW setting will allow less of the larger signal to pass through the analyzer and the smaller signals peak will then rise out of the noise floor.
-
Page 49: Measuring A Low-Level Signal
Functions and Measurements Measuring a Low-Level Signal Measuring a Low-Level Signal This section provides information on measuring low- level signals and distinguishing them from spectrum noise. Reducing Input Attenuation The ability to measure a low- level signal is limited by internally generated noise of the spectrum analyzer. - Page 50 Functions and Measurements Measuring a Low-Level Signal Set the center frequency, span and reference level: > Center Freq > 300 > MHz Press Frequency > Span > 2 > MHz Press SPAN > Ref Level > 40 > –dBm. Press Amplitude Move the desired peak to the center of the display: Peak...
-
Page 51: Decreasing The Resolution Bandwidth
Functions and Measurements Measuring a Low-Level Signal A lower attenuation value will mean that more of the signal strength will be displayed on screen: > Attenuation > 0 > dB Press Amplitude Figure 3-11 Measuring a low-level signal using 0 dB Attenuation Decreasing the Resolution Bandwidth Resolution bandwidth settings affect the level of internal noise but have little affect on the displayed level of... -
Page 52: Trace Averaging
Functions and Measurements Measuring a Low-Level Signal Figure 3-12 Decreasing Resolution Bandwidth A “#” mark appears next to the Res BW annotation in the lower left corner of the screen, indicating that the resolution bandwidth is uncoupled. Uncoupled indicates that the function is in manual control mode, not auto control mode. - Page 53 Functions and Measurements Measuring a Low-Level Signal the number of trace sweeps to be included in the process. The averaging function uses the most recent trace sweep values so that the display shows any signal changes. Selecting averaging, when the analyzer is auto- coupled, changes the detection mode to Sample, smoothing the displayed noise level.
-
Page 54: Improving Frequency Resolution And Accuracy
Functions and Measurements Improving Frequency Resolution and Accuracy Improving Frequency Resolution and Accuracy This section provides information on using the frequency counter function to improve frequency resolution and accuracy. > Preset (With Preset Type of Factory) Preset/ Press System Connect a cable from the front panel CAL OUT to RF IN; >... - Page 55 Functions and Measurements Improving Frequency Resolution and Accuracy The marker readout in the active frequency function changes while the counted frequency result (upper- right corner of display) does not. For an accurate count, the marker need not be placed at the exact peak of the signal response. The Frequency counter properly functions only on stable, CW signals N O T E or discrete spectral components.
-
Page 56: Tracking Drifting Signals
Functions and Measurements Tracking Drifting Signals Tracking Drifting Signals This section provides information on measuring and tracking signals that drift in frequency. Measuring a Source’s Frequency Drift The analyzer will measure source stability. The maximum amplitude level and the frequency drift of an input signal trace can be displayed and held by using the maximum hold function. - Page 57 Functions and Measurements Tracking Drifting Signals Turn off the signal track function: > Signal Track (Off) Press Frequency Measure the excursion of the signal with maximum hold: > Max Hold View/ Press Trace As the signal varies, maximum hold maintains the maximum responses of the input signal.
-
Page 58: Making Distortion Measurements
Functions and Measurements Making Distortion Measurements Making Distortion Measurements This section provides information on measuring and identifying signal distortion. Identifying Analyzer Generated Distortion High- level input signals may cause analyzer distortion products that could mask the real distortion measured on the input signal. - Page 59 Functions and Measurements Making Distortion Measurements The signal produces harmonic products (spaced 200 MHz from the original 200 MHz signal) in the analyzer input Figure 3-16. mixer as shown in Change the center frequency to the value of the first harmonic: >...
- Page 60 Functions and Measurements Making Distortion Measurements Notice the MarkerD amplitude readout. This is the difference of the distortion product amplitude between 0 dB and 10 dB input attenuation settings. If the MarkerΔ absolute amplitude ≥ is approximately 1 dB for an input attenuator change, the analyzer is generating, at least in part, the distortion.
-
Page 61: Third-Order Intermodulation Distortion
Functions and Measurements Making Distortion Measurements Third-Order Intermodulation Distortion Two- tone, third- order intermodulation distortion is a common specification in communication systems. When two signals are present in a non- linear system, they may interact and create third- order intermodulation distortion (TOI) products that are located close to the original signals. - Page 62 Functions and Measurements Making Distortion Measurements The coupler should have a high degree of isolation between the two N O T E input ports so the sources do not intermodulate. Set one source (signal generator) to 300 MHz and the other source to 301 MHz, for a frequency separation of 1 MHz.
- Page 63 Functions and Measurements Making Distortion Measurements Measure the difference between this test signal and the Figure 3-17): second distortion product (see > Delta > Delta (On) Marker Press > Next Peak Peak Press Search Figure 3-17 Measuring the Distortion Product...
-
Page 64: Measuring Phase Noise
Functions and Measurements Measuring Phase Noise Measuring Phase Noise Phase noise is a frequency domain measure of stability. Phase noise is specified as single- sideband power in relation to the fundamental RF output frequency. It is measured at various offset frequencies from the carrier, normalized to a 1 Hz measuring bandwidth. -
Page 65: Stimulus Response Transmission
Functions and Measurements Stimulus Response Transmission Stimulus Response Transmission The procedure below describes using the built- in tracking generator of the analyzer to measure the rejection of a low pass filter. A type of transmission measurement. To measure the rejection of a low pass filter, connect the Figure 3-18. - Page 66 Functions and Measurements Stimulus Response Transmission To reduce ripples caused by source return loss, use 6 dB or greater N O T E output attenuation. Tracking generator output attenuation is normally a function of the source power selected. However, the output attenuation may be controlled in the Tracking Generator menu.
- Page 67 Functions and Measurements Stimulus Response Transmission Measure the rejection of the low pass filter: > Normal > 370 > MHz, Delta > 160> MHz Press Marker The marker readout displays the rejection of the filter at 160 MHz above the cutoff frequency of the low pass filter. See Figure 3-19 as below.
-
Page 68: Measuring Stop Band Attenuation Of A Lowpass Filter
Functions and Measurements Measuring Stop Band Attenuation of a Lowpass Fil ter Measuring Stop Band Attenuation of a Lowpass Filter When measuring filter performance, it is useful to look at the stimulus response over a wide frequency range. Setting the analyzer y- axis (amplitude) to Log scale type presents the measurement data in a usable format for determining filter characteristics. - Page 69 Functions and Measurements Measuring Stop Band Attenuation of a Lowpass Fil ter Set the resolution bandwidth to 10 kHz: > Res Bw > 10 > KHz Press Excessive signal input may damage the DUT. Do not exceed the C A U T I O N maximum power that the device under test can tolerate.
- Page 70 Functions and Measurements Measuring Stop Band Attenuation of a Lowpass Fil ter In this example, the attenuation over this frequency range is - 17.98 dB/octave (one octave above the cutoff frequency). Use the front- panel knob to place the marker at the highest peak in the stop band to determine the minimum stop band attenuation.
-
Page 71: Making A Reflection Calibration Measurement
Functions and Measurements Making a Reflection Calibration Measurement Making a Reflection Calibration Measurement The following procedure makes a reflection measurement using a coupler or directional bridge to measure the return loss of a filter. This example uses a 370 MHz low pass filter as the DUT. - Page 72 Functions and Measurements Making a Reflection Calibration Measurement For greatest accuracy, use a coupler or bridge with the correct test N O T E port connector. Any additional adapters or components placed between the test port and DUT degrades coupler/bridge directivity and system source match.
- Page 73 Functions and Measurements Making a Reflection Calibration Measurement Normalize the trace: > Tracking Generator > More > Normalize > Store Ref (1 Press MODE 3) > Normalize (On) → This activates the trace 1 minus trace 3 function and 3-23). The normalized displays the results in trace 1 (Figure trace or flat line represents 0 dB return loss.
-
Page 74: Measuring Return Loss Using The Reflection Calibration Routine
Functions and Measurements Measuring Return Loss Using the Reflection Calibration Routine Measuring Return Loss Using the Reflection Calibration Routine This procedure uses the reflection calibration routine in the “Making a Reflection Calibration proceeding procedure Measurement” on page 63 to calculate the return loss of the 370 MHz low pass filter. -
Page 75: Making An Average Power Measurement
To prevent damage in most situations when directly coupling an analyzer to a base station, use a high power attenuator between the analyzer and the BTS. The N9320B spectrum analyzer supports the U2000 Series USB power sensors. The U2000 Series USB power sensors do not need manual calibration and zero routines performed. - Page 76 Functions and Measurements Making an Average Power Measurement accuracy. For best accuracy, users are recommended to perform external zeroing for input signals below - 30 dBm for best accuracy. If you suspect other signals may be present, it is recommended that N O T E you turn off all the other channels and measure average power only on the signal of interest.
- Page 77 Functions and Measurements Making an Average Power Measurement To Make a Basic Average Power Measurement Follow the steps below to make a basic average power measurement. > Preset. (With Preset Type of Factory) Preset/ Press System , rotate the knob or press the arrow hardkey to Press MODE highlight Power Meter, then press [ENTER] to turn on the...
- Page 78 Functions and Measurements Making an Average Power Measurement Setting Power Meter Resolution You can choose from four levels of Power Meter resolution. Higher resolutions provide more accuracy but slow the measurement speed. > Preset. (With Preset Type of Factory) Preset/ Press System , rotate the knob or press the arrow hardkey to...
-
Page 79: Demodulate The Am/Fm Signal
Functions and Measurements Demodulate the AM/FM signal Demodulate the AM/FM signal The N9320B provide you the AM/FM demodulation function. Demodulating an AM Signal The demodulation functions listed in the menu under > {Demod} allow you to demodulate and hear signal SPAN information displayed on the analyzer. -
Page 80: Demodulating An Fm Signal
Functions and Measurements Demodulate the AM/FM signal Demodulating an FM Signal This section demonstrates how to demodulate and listen to an FM signal using the built- in FM demodulator. Using the built in FM demodulator you can tune to an FM signal and view the results of the detector output as displayed in the time- domain. - Page 81 Functions and Measurements Demodulate the AM/FM signal Turn on the FM demodulator: >{Demod} > {FM ON}. Press SPAN Listen to the FM signal. >{Demod} > {Speaker Vol}, rotate the knob to Press SPAN adjust the speaker volume. The headphone jack is availabe for the audio signal output alternatively.
-
Page 82: Analysis The Modulated Signals
Functions and Measurements Analysis the Modulated Signals Analysis the Modulated Signals The N9320B provides the optional AM/FM (Option AMA) and ASK/FSK (Option- DMA) modulation analysis function for analysis the modulated signals. These functions can be activated by license key. AM/FM Modulation Analysis... - Page 83 Functions and Measurements Analysis the Modulated Signals 4 Set the attenuation state to Auto (default): Press {More} > {More} > {Attenuation Auto} > {More} 5 Press {Y Scale} > {Auto Scale} > {Return} to set the Y scale. 6 Set the AM depth limit and turn on the limit function: Press {More} >...
- Page 84 Functions and Measurements Analysis the Modulated Signals 3 Press {Carries Freq} > [1.5] > {GHz} to set the carrier frequency. 4 Set the attenuation state to Auto (default): Press {More} > {More} > {Attenuation Auto} > {More} 5 Press {Y Scale} > {Auto Scale} > {Return} to set the Y scale. 6 Set the FM deviation limit and turn on the limit function: Press {More} >...
-
Page 85: Ask/Fsk Modulation Analysis
Functions and Measurements Analysis the Modulated Signals ASK/FSK Modulation Analysis The ASK/FSK modulation analysis function supports four display modes: • Symbol • Waveform • ASK/FSK Error • Eye Diagram. User definable limits provide Pass/Fail indicators of four types: • Maximum carrier power •... - Page 86 Functions and Measurements Analysis the Modulated Signals 4 Press {Symbol Rate} > [10] > {MHz} to set the symbol rate. 5 Press {Filter Setup} > {Ref Filter} > {Nyquist} > {Return} to set the filter type. 6 Set the attenuation state to Auto (default): Press {More} >...
- Page 87 Functions and Measurements Analysis the Modulated Signals 8 Setting the FSK deviation limit and turn on the limit function: Press {More} > {Limits} > {FreqDev UP} > [85] > {kHz} > {FreqDev Low} > [80] > {kHz} > {Limits on} The figure below indicates the FSK EYE Diagram as a measurement result.
-
Page 88: Measuring Channel Power
Functions and Measurements Measuring Channel Power Measuring Channel Power Channel Power measures the power and power spectral density in the specified channel bandwidth. A white frame on the display indicates the edge limits of the channel bandwidth. The user must specify the center frequency, reference level, and channel bandwidth to be used for the measurement. - Page 89 Functions and Measurements Measuring Channel Power Press Standard Customize in the submenu to choose the radio stadard. There are four wireless standard options: WCDMA, CDMA, LTE, GSM. Press WCDMA as an example. Once the standard is set, the integration bandwidth and span will be automatically set according to the standard.
- Page 90 Functions and Measurements Measuring Channel Power Press Center Freq to change the center frequency of the current signal channel. Adjust the center frequency to measure other channel power in the same standard. Please follow the similar procedure as above to measure the channel power in the CDMA and LTE standard.
-
Page 91: Viewing Catalogs And Saving Files
Functions and Measurements Viewing Catalogs and Saving Files Viewing Catalogs and Saving Files The analyzer will store and retrieve data files similar to using a PC. The analyzer allows you to view and save files in the internal storage of the analyzer or to a USB storage device. -
Page 92: Saving A File
Functions and Measurements Viewing Catalogs and Saving Files The entry fields show the parameters for the files viewed: Name states the filename. Type displays the type of files viewed. displays the location of the files (Local or USB). Path There are four column headings in this area of the display: Name displays the filename. - Page 93 Functions and Measurements Viewing Catalogs and Saving Files Select the trace to save (1, 2, 3, 4 or all traces). For this example, we will select trace 3: Press Source > Trace 3 Enter a filename by pressing Name. Assume you name the file “TEST1”.
-
Page 94: Loading A File
Functions and Measurements Viewing Catalogs and Saving Files Loading a File This feature will recall (load) onto the displayed screen a previously saved filename and type compatible with this analyzer. The file types are described above. Select the directory where your file is located. In this example, select the internal storage (Local/): >... -
Page 95: Copying A File
Functions and Measurements Viewing Catalogs and Saving Files Copying a File To copy a file from internal storage to a USB storage device, follow this procedure: > Catalog > Local to select the path. File/ Press Print Connect a USB storage device to the USB connector (DEV). Select the type of file. - Page 96 Functions and Measurements Viewing Catalogs and Saving Files...
-
Page 97: Key Reference
Key Reference Key Reference Amplitude Auto Tune Back <- BW/Avg Det/Display Enter File Frequency Marker Marker-> Meas MODE Peak Search Preset/System SPAN Sweep/Trig Trace This chapter describes each front panel hardkey and their associated softkeys (menus). The front panel key descriptions are organized alphabetically. -
Page 98: Amplitude
Key Reference Amplitude Amplitude Press Amplitude hardkey to activate the reference level function and access the amplitude softkey menu. The softkey menu selections are described as follows: Ref Level Sets the reference level. This function is activated when Amplitude is pressed. The reference level is the amplitude power or voltage represented by the top line of the graticule on the display. - Page 99 Key Reference Amplitude Scale Toggles the amplitude Scale for each graticule. The vertical On Off divisions are linearly scaled with default amplitude units of volts. The default unit is dBm. This softkey is only valid when the Scale Type is set to Lin. Key access: Amplitude Int Preamp...
- Page 100 Key Reference Amplitude Att limit Toggles the attenuation limit function between On and Off. On Off When this softkey is set to On, the reference level will not exceed the maximum value = (attenuation + 20) dBm. > More Key access: Amplitude Corrections Accesses the corrections submenu to enable the corrections...
- Page 101 Key Reference Amplitude only be entered using the numeric keypad. The preamplifier gain value is not affected by an instrument preset or a power cycle. > More Key access: Amplitude Impedance Toggles the computational input impedance between 50ohm 50ohm 75ohm and 75ohm.
-
Page 102: Auto Tune
Key Reference Auto Tune Auto Tune Hardkey activates the autotune function to view the signal, This hardkey performs the following functions automatically: Run Peak Search in full span Run Mkr -> CF Select the appropriate reference level according to the amplitude of searching signal. -
Page 103: Back
Key Reference Back <- Back <- The backspace hardkey is located in the numeric keypad area of the front panel and is used to change or correct an active function entry, or to change a text entry before you save data to a file. -
Page 104: Bw/Avg
Key Reference BW/Avg BW/Avg Hardkey activates the resolution bandwidth function and accesses the softkey menus that control the bandwidth and averaging functions. Res BW Softkey controls the 3 dB resolution bandwidth of the Auto Man analyzer from 10 Hz to 3 MHz using the knob or arrow keys. There are four available bandwidths less than 1 KHz are 10, 30, 100 Hz or 300 Hz. - Page 105 Key Reference BW/Avg VBW/RBW Sets the ratio between the video and resolution bandwidths. Auto Man When a signal is weak and is visually masked by the noise floor, set the ratio to less than 1 to lower the noise. When the Preset Type is set to Factory and Preset is pressed, the ratio is set to 1.
- Page 106 Key Reference BW/Avg Average Initiates a digital averaging routine that averages the trace On Off points in a number of successive sweeps resulting in trace “smoothing”. The number of sweeps (average number) is changeable when setting Average (Off). Increasing the average >...
- Page 107 Key Reference BW/Avg When trace average is on, the average type is shown on the left side of the display. Selecting an average type manually causes the analyzer to use that type without regard to other analyzer settings and sets Avg Type to Man. Key access: Video Avg Video averaging averages the data as appropriate for the y- axis scale.
-
Page 108: Det/Display
Key Reference Det/Display Det/Display Press this hardkey to control detector and display functions. Detector Softkey presents a submenu to select a specific detector (detector type) type, or allows the analyzer to select the appropriate detector (select Auto) for a particular measurement. Auto Man Regarding detectors, it is important to understand what is a trace “bucket”. - Page 109 Key Reference Det/Display When the detector is set to Auto, Pressing > Average (On) changes the detector. The Auto choice will depend on marker functions, trace functions, and the trace averaging function. If a marker function or measurement is running, the Auto choice of detector is either Average or Sample.
- Page 110 Key Reference Det/Display Average measures the average value of the amplitude Video RMS across each trace interval (bucket). When Average is selected, “Avg” appears on the left corner. > Detector Auto Man Det/ Key access: Display Sample Sample detection is used primarily to display noise or noise- like signals.
- Page 111 Key Reference Det/Display Display Line Activates an adjustable horizontal line that is used as a On Off visual reference line. The line, which can be used for trace arithmetic, has amplitude values that correspond to its vertical position when compared to the reference level. The value of the display line appears in the active function block and on the left side of the display.
- Page 112 Key Reference Det/Display Test Toggles the testing of the limit lines On Off between on and off. If trace 1 is at or within the bounds of the set limit or margin, “Limit_# Pass” or “Margin_# Pass” is displayed in the upper left corner of the measurement area limit line.
- Page 113 Key Reference Det/Display Frequency Edits the frequency value for a limit point. After editing, the limit table will place the frequency or time in correct order. For a new point, the Amplitude default is 0 dBm, and Connected default is Yes. >...
-
Page 114: Enter
Key Reference Enter Enter Terminates a front- panel keypad numeric entry and enters that value into the analyzer. (For most applications, it is better to use the units softkeys to terminate value entry.) When in File menu, the [Enter] key is used to terminate filename entries. -
Page 115: File
Key Reference File File Hardkey accesses the softkeys menus to manage the file “Viewing Catalogs and Saving system of the analyzer. Refer to Files” on page 83, for more information. Catalog Displays all files located on the selected catalog, depending upon the preferences set under the Type and Sort keys defined below. - Page 116 Key Reference File Local Accesses the internal storage of the analyzer. > Catalog File/ Key access: Print Accesses the external USB storage device. > Catalog File/ Key access: Print Save Accesses menu keys that allow the user to save the analyzer screen, state, trace, and limit data to a USB storage device or to the internal storage.
- Page 117 Key Reference File Trace Displays all previously saved trace files (.TRA) and detects the current trace in preparation to save it in a file (.TRA). Save individual traces or a group of traces. Limits Displays all previously saved limits files (.LIM) and detects the current limits in preparation to save them in a file (.LIM).
- Page 118 Key Reference File File/ Key access: Print Load Executes the load file function. When load completed, the message “local(USB)/XXX file loaded” appears in the status bar (where XXX is the filename). > Load File/ Key access: Print Type To select the type of file to be loaded. >...
- Page 119 Key Reference File Delete Enter the submenu for deletion. File/ Key access: Print Delete Executes the delete file function. After a successful delete, the message “local(USB)/XXX file deleted” appears in the status bar on the display (where XXX is the filename). >...
- Page 120 Key Reference File Displays all file types. Screen Displays all screen files. State Displays all state files. Trace Displays all trace files. Limits Displays all limits files. Sort Sorts the files according to a file attribute to be copied, including By Date, By Name and Order Up Down.
-
Page 121: Frequency
Key Reference Frequency Frequency Press Frequency to activate the center frequency function, and access the menu softkeys for frequency functions. The center frequency, or start and stop frequency values appear below the graticule on the display. When changing both the center frequency and span, change the N O T E frequency first. - Page 122 Key Reference Frequency Freq Offset Allows you to input a frequency offset value that is added to the frequency readout of the marker, to account for frequency co versions external to the analyzer. Offset entries are added to all frequency readouts including marker, start frequency, and stop frequency.
-
Page 123: Marker
Key Reference Marker Marker Hardkey accesses the marker control softkey menus to select the type and number of markers. Markers are shown on the display as diamond- shaped characters that identify points of traces. Up to twelve pairs of markers (when using Delta Pair markers) may appear on the display simultaneously;... - Page 124 Key Reference Marker Use the data control keys to position the delta marker. Annotation in the active function block and in the upper- right corner indicates the differences between the two markers, frequency/time and amplitude. Delta (Off) moves the reference marker to the active marker position, allowing you to make delta measurement from differing reference points without having to turn off the markers and begin again.
- Page 125 Key Reference Marker All Off Turns off all markers, including markers used for signal track, and marker annotations. Key access: Marker Function Accesses the marker function softkeys listed below. Key access: Marker Freq Accesses the frequency counter function. Counter > Function Key access: Marker Freq Counter...
- Page 126 Key Reference Marker Optimize This softkey is valid only when span fall in the Phase Noise range of 100 Hz and 100 kHz. After enabling this softkey, the 1st LO Loop filter bandwidth will be changed from approx. 5 kHz to 120- 150 kHz automatically, which optimizes the phase noise close in to the carrier.
- Page 127 Key Reference Marker The noise marker averages 5% of the trace data values (one- half a horizontal division), centered on the location of the marker on the frequency or time scale. Marker noise indicates noise power density per Hertz or noise voltage per root Hertz depending upon the amplitude units selected.
- Page 128 Key Reference Marker Marker Trace Places a marker on the selected trace, if no markers have Auto 1 2 3 4 been previously turned on. If a marker is currently active, press Marker Trace until 1, 2, 3, or 4 is underlined: the active marker moves to the selected trace.
-
Page 129: Marker
Key Reference Marker-> Marker-> Marker Press accesses the following marker function softkeys: Sets the frequency of the marker to the center frequency. In delta mode, Mkr CF sets the displayed trace center frequency to the frequency of the marker delta value. CF is not available in zero span. -
Page 130: Meas
Key Reference Meas Meas In the Spectrum Analyzer mode (see MODE), Meas key displays a menu for measurements such as adjacent channel power, occupied bandwidth, channel power, spectrum emission mask and TOI. Press Measure Off to turn the measurement off. Channel Power Channel Power measures the power and power spectral density in the specified channel bandwidth. - Page 131 Key Reference Meas Avg Mode Toggles the average mode between Exp or Repeat. This Exp Repeat determines the averaging action after the specified number of measurements (average count) is reached. When selecting Exp, each successive data acquisition after the average count is reached is exponentially weighted and combined with the existing average.
-
Page 132: Occupied Bw
Key Reference Meas Occupied BW Occupied Bandwidth integrates the power of the displayed spectrum. The power- bandwidth routine first computes all signal power contained in the trace, then calculates the span containing the power of the specified percentage. The percentage value default is 99% of the occupied bandwidth power. - Page 133 Key Reference Meas as the difference between the (f )/2 and the tuned center frequency of the signal. To get the correct measurement result, first set the center frequency, N O T E reference level, and channel spacing. Avg Number Select On to specify the number of measurement averages On Off used when calculating the measurement result.
- Page 134 Key Reference Meas OBW Span Specifies the integration range used to calculate the total power from which the percent occupied bandwidth is then calculated. The analyzer span will be set to the same value as the OBW Span for the measurement. OBW Span should be set to an approximate multiple of 2 times the expected occupied bandwidth result.
-
Page 135: Acp
Key Reference Meas Adjacent Channel Power (ACP) measures the power present in adjacent transmit channels. The span is automatically set according to the six available offsets and their associated integration bandwidths as defined by the user. Figure 4-6 Adjacent Channel Power Measurement Avg Number Pressing On specifies the number of measurements that will On Off... - Page 136 Key Reference Meas When selecting Repeat, after reaching the average count, all previous data is cleared and the average count is back to 1. > ACP Meas Key access: Chan Integ BW Specifies the range of integration used in calculating the power in the main channel.
- Page 137 Key Reference Meas Meas Type Specifies the reference for the measurement, either Total Pwr Ref or PSD Ref. Relative values are displayed referenced to either the total power (Total Pwr Ref) or the power spectral density (PSD Ref) measured in the main channel. >...
-
Page 138: Intermod (Toi)
Key Reference Meas Intermod (TOI) The third order intermodulation (TOI) measurement computes and displays the output intercept point (IP3), and places arrows upon the trace to indicate the measured signals and third- order products. Figure 4-7 TOI Measurement Avg Number Set Avg Number to On to specify the number of measurement On Off averages used when calculating the measurement result. - Page 139 Key Reference Meas When Avg Mode is Repeat, after reaching the average count, all previous data is cleared and the average count is back to 1. > More> Intermod (TOI) Meas Key access: TOI Span Specifies the frequency span in which intermodulation products are measured.
-
Page 140: Spectrum Emission Mask
Key Reference Meas Spectrum Emission Mask Spectrum Emission Mask measurement includes the in- band and out- of- band spurious emissions. As it applies to W- CDMA (3GPP), this is the power contained in a specified frequency bandwidth at certain offsets relative to the total carrier power. - Page 141 Key Reference Meas Total Pwr Ref When Total Pwr Ref is selected, the power in the carrier is used as the reference in computing the relative power values for the offsets. > More > Spectrum Emission Meas Key access: Mask > Meas Type PSD Ref When PSD Ref is selected, the mean power spectral density of the carrier is used in...
- Page 142 Key Reference Meas Total Pwr Ref Displays the type of power measurement (PSD Ref) Meas Type. reference selected by Auto Man Total Pwr Ref is the power in the carrier that is used as the reference in computing the relative power values for the offsets. When Man is selected, this can be set by the user.
- Page 143 Key Reference Meas Table 2 Offsets & Limits Defaulted for W-CDMA (3GPP) Mobile Station Measurements Offset Start Stop Res BW Rel Stop Meas Freq Freq (kHz) Start Stop Couple Start (dBc) (MHz) (MHz) (dBm) (dBm) (dBc) A. On 2.515 3.485 30.00 -71.07 -71.07...
- Page 144 Key Reference Meas Table 4 Offsets & Limits Defaulted for 802.11b Radio Standard Offset Start Freq Stop Freq Abs Start Abs Stop Rel Start Rel Stop Meas (MHz) (MHz) (dBm) (dBm) (dBc) (dBc) A. On 11.00 22.00 -10.00 -10.00 -30.00 -30.00 B.
- Page 145 Key Reference Meas Res BW Specifies the resolution bandwidth used in measuring the Auto Man offset pair. When set to Auto, the Res BW from the default “Offset/Limits” on page 134 tables for are used. When set to Man, the allowed range is 1 kHz to 1MHz. >...
- Page 146 Key Reference Meas Absolute Sets the limit test to show Fail if one offset is larger than the corresponding limit for Abs Start and/or Abs Stop. This is the default selection for each offset for BTS measurements. Relative Sets the limit test to show Fail if one offsets spectrum emission mask measurement results is larger than the corresponding limit for Rel Start and/or Rel Stop.
-
Page 147: Mode
Key Reference MODE MODE Selects the measurement mode of your analyzer. Spectrum Analyzer mode is the default mode and is for general purpose measurement use. Tracking Generator Accesses the tracking generator functions. (Option TG3) Key access: MODE Amplitude TG Activates (On) or deactivates (Off) the On Off tracking generator output. - Page 148 Key Reference MODE Amptd Step To set the step size of the power level range of the Auto Man tracking generator. The default setting is one vertical scale division when in a logarithmic amplitude scale. > Tracking Generator Key access: MODE Power Sweep the output offset of the tracking generator.
- Page 149 Key Reference MODE between the tracking generator and the analyzer input. Notice that the frequency response is not perfectly flat, showing the response of the cables, as well as the flatness of both the tracking generator and the analyzer. Now press Store Ref (1->3), Normalize (On).
- Page 150 Key Reference MODE Tracking Activates a routine that automatically adjusts fine Peak frequency tracking to obtain the peak response of the tracking generator on the spectrum analyzer display. Tracking Peak is performed in the current resolution bandwidth. > Tracking Generator > More Key access: MODE Man Track...
-
Page 151: Power Meter
Key Reference MODE Power Meter Use the arrow keys to highlight the mode and press [ENTER] to make a measurement using the power meter function. When this mode is selected, the power meter related softkey menu will be displayed and many of the instrument hardkeys will be disabled as they are not necessary for this mode. - Page 152 Key Reference MODE Disp Accesses the associated Disp Range submenu. Range > Power Meter > Meas Disp Key access: MODE Auto Toggles the auto range function between Range On and Off. When the Auto Range is set to On, the Top and Bottom value of the power meter’s display range will be set automatically according to the measurement data:...
- Page 153 Key Reference MODE Dis Mode Changes the display mode between Meter and Chart. Meter Chart The default mode is Meter. > Power Meter > Meas Setup Key access: MODE Chart View Accesses the Chart View submenu. This soft key is disabled when the measurement is in process or if the display mode is set to Meter.
-
Page 154: Am/Fm Modulation Analysis
Key Reference MODE AM/FM Modulation Analysis Use the arrow keys to highlight the mode you need and press [ENTER] as a terminator. When this mode is selected, the AM/FM modulation analysis menu will be displayed. Carrier Freq Sets the modulated carrier frequency. >... - Page 155 Key Reference MODE AM Error - displays the AM error. Eye Diagram - Displays the Eye diagram. > AM/FM Modulation Analysis Key access: MODE X Scale Accesses the submenu to configure the X scale parametes: Scale/Div sets the number of symbols in one division. Ref Value sets the starting value in term of times at the reference position.
- Page 156 Key Reference MODE Trigger Enables you to configure the trigger. When using a trigger source other than Free Run, the analyzer will begin a sweep only with the selected trigger conditions are met. A trigger event is defined as the point at which your trigger source signal meets the specified trigger level.
- Page 157 Key Reference MODE Single When the analyzer is in continuous sweep mode, pressing this softkey will change the sweep setting to single sweep. It will then begin a sweep after the trigger conditions are met. If the analyzer is already in single sweep, pressing this softkey will execute a new sweep as soon as the trigger condition is met.
-
Page 158: Ask/Fsk Modulation Analysis
Key Reference MODE ASK/FSK Modulation Analysis Use the arrow keys to highlight the mode you need and press [ENTER] as a terminator. When this mode is selected, the ASK/FSK modulation analysis menu will be displayed. Carrier Freq Sets the modulated carrier frequency. >... - Page 159 Key Reference MODE X Scale Accesses the submenu to configure the X scale parametes: Scale/Div sets the number of symbols in one division. Ref Value sets the starting value in term of times at the reference position. Ref position sets the display reference position to either Left, Ctr (center), or Right.
- Page 160 Key Reference MODE Trigger Enables you to configure the trigger. When using a trigger source other than Free Run, the analyzer will begin a sweep only with the selected trigger conditions are met. A trigger event is defined as the point at which your trigger source signal meets the specified trigger level.
- Page 161 Key Reference MODE Single When the analyzer is in continuous sweep mode, pressing this softkey will change the sweep setting to single sweep. It will then begin a sweep after the trigger conditions are met. If the analyzer is already in single sweep, pressing this softkey will execute a new sweep as soon as the trigger condition is met.
-
Page 162: Peak Search
Key Reference Peak Search Peak Search Places a marker on the highest peak based on the settings of “Search Criteria” on page 155. Refer to “Peak Search Type” on page 156, for more information on the effect of settings. All peak search functions ignore the LO feed through signal. The process N O T E for determining if the Peak is the LO feed through takes into account Start Frequency, Span, Resolution Bandwidth, Resolution Bandwidth shape... - Page 163 Key Reference Peak Search Min Search Moves the active marker to the minimum detected amplitude. Peak Key access: Search Pk-Pk Search Finds and displays the frequency (or time, if in zero span), and amplitude differences between the highest and lowest trace points.
- Page 164 Key Reference Peak Search Two signal peaks, which are so close together that the amplitude drop N O T E between them is less than the peak-excursion value, are not recognized as two peaks. A signal peak is recognized only if it has a peak excursion drop above the noise floor, on both sides of the signal.
- Page 165 Key Reference Peak Search Excursion & When Peak Search Type is Excursion & Threshold Threshold, a peak search places a marker on a peak that meets the Peak Excursion and Peak Threshold parameters. If Peak Search Type is Excursion & Threshold and no peak satisfies the selected parameters, a marker is placed at the center of the trace, and the error message,...
-
Page 166: Preset/System
Key Reference Preset/System Preset/System Accesses the Preset and System softkeys. When the analyzer Preset/ is in the remote mode, pressing returns the analyzer to System the local control mode and enables front- panel inputs. Preset Provides a known state of the instrument for making measurements. - Page 167 Key Reference Preset/System Factory Default Preset State Attenuation 20 dB(Auto) Average Type Video (Auto) Center frequency 1.5 GHz Averaging 1(Off) CF step size 300 MHz Peak Excursion 6 dB Start Frequency 0 Hz Peak Threshold -90 dBm Stop Frequency 3 GHz Peak Search Type Max Value Signal Track...
- Page 168 Key Reference Preset/System Pwr on/Preset Accesses the following softkeys for the preset settings. Preset/ Key access: System Power on Determines the state of the analyzer when the Last Preset analyzer is turned on. Power On set to Preset recalls the analyzer settings previously with the Preset function.
- Page 169 Key Reference Preset/System Language Accesses the softkeys for selecting the screen menu language. In addition to English, there are ten more user- selectable, on- screen languages, including Chinese, Japanese, Korean and a number of European languages. Preset/ Key access: System Diagnostics Accesses the Front Panel Test softkey to verify the functionality of each front- panel key.
- Page 170 Key Reference Preset/System Time/Date Accesses the following Time/Date menu keys used to set and display the real- time clock: > More Preset/ Key access: System Time/Date Toggles the time/date display between on and On Off off. Date Format Changes the display format of date from MDY DMY month- day- year to day- month- year.
- Page 171 Key Reference Preset/System Activate Activates the license for the option whose License number was previously input in License Key. If the entry is correct, the option will be enabled and the message: “Option activated” will appear in the status line of your display. If the entry is incorrect, the error message “License key invalid”...
-
Page 172: Span
Key Reference SPAN SPAN Accesses the span function and the submenu softkeys for changes the frequency range span functions. Pressing SPAN symmetrically about the center frequency. The frequency- span readout describes the total displayed frequency range. To determine frequency span per horizontal graticule division, divide the frequency span by 10. - Page 173 Key Reference SPAN Activating AM demodulation turns off FM On Off demodulation (if it is on). > Demod Key access: SPAN Turning FM demodulation on turns off AM On Off demodulation (if it is on). For best results, Turn on the optional Internal Preamplifier, set the RBW to 100 kHz and Attenuation to 0 dB.
-
Page 174: Sweep/Trig
Key Reference Sweep/Trig Sweep/Trig Accesses the Sweep/Trigger softkeys for selection of the sweep mode and trigger mode of the analyzer. The softkey menu selections are defined as follows: Sweep Time Selects the length of time the analyzer takes to tune across Auto Man the displayed frequency span (or, in zero span, the time the analyzer takes to sweep the full screen). - Page 175 Key Reference Sweep/Trig Free Run New sweep starts as soon as possible after the current sweep ends. > More Sweep/ Key access: Trig Video Activates the trigger condition that starts the next sweep if the detected RF envelope voltage rises to a level set by the video trigger level.
-
Page 176: Trace
Key Reference Trace Trace Accesses the trace keys to store and manipulate trace information. Each trace consists of a series of points in which amplitude data is stored. The analyzer updates the information for any active trace with each sweep. Select Trace Selects the trace for current use. - Page 177 Key Reference Trace Trace Math This softkey provides a submenu for the traces operation. View/ Key access: Trace Variable A, B, C Press those softkeys to select a trace (for variable A,B, and C) or a display line (for variable A and B) for the trace calculation.
- Page 178 Key Reference Trace...
-
Page 179: Instrument Messages
Instrument Messages Instrument Messages Overview Command Errors Execution Conflict Device-Specific Errors... -
Page 180: Overview
Instrument Messages Overview Overview If an improper operation occurs during the instrument configuration, a message will appear on the status line indicating the incident and the how the spectrum analyzer > More > Show Preset/ corrected the setting automatically. press System errors to read the specific descriptions of those messages. -
Page 181: Command Errors
Instrument Messages Command Errors Command Errors The messages listed below are command errors, which are saved into local registers. -100 Command error An unrecognized command or data type was encountered. This message is used when the device cannot detect more specifics described for errors - 101 to - 109. - Page 182 Instrument Messages Command Errors -112 Program mnemonic too long The header contains more than 12 characters. -113 Undefined header The header is correct in syntax, but it is undefined for this device. -128 Numeric data not allowed A legal numeric data element was received, but the device does not accept one in this position for the header.
-
Page 183: Execution Conflict
Instrument Messages Execution Conflict Execution Conflict The system messages listed below are execution conflicts, indicating settings conflict during your operation. -200 Execution Error This is the generic syntax error for devices that cannot detect more specific errors. -222 Data out of range A legal program data element was parsed but could not be executed because the interpreted value was outside the legal range defined by the device. - Page 184 Instrument Messages Execution Conflict -330 Self-test failed A self- test failure occurred. Report this error to Keysight Technologies. -340 calibration failed An expected file was not found while trying to load internal calibration.
-
Page 185: Device-Specific Errors
1st LO Unlock The first LO on has lost phase lock. Report this error to the nearest Keysight Technologies sales or service office. 2nd LO Unlock The second LO has lost phase lock. Report this error to the nearest Keysight Technologies sales or service office. - Page 186 Instrument Messages Device-Specific Errors TG start freq is less than 1/2 res bw Tracking generator uncalibrated at start frequencies below 1/2 the current resolution bandwidth. Option not licensed The selected option requires a license. Refer to the installation procedures in the user guide provided for this particular option.
- Page 187 Instrument Messages Device-Specific Errors Connect CAL OUT to RF IN you must connect the CAL OUT to RF IN with the appropriate cable. Instrument state set to initial values While trying to load a trace or state, the state information was found to be in error.
- Page 188 Attempt to initialize the instrument state has failed. Cycle instrument power. If this fails to correct the problem, contact your nearest Keysight Technologies service center. Unable to load user state Attempt to load a state failed, because the state was...
-
Page 189: Troubleshooting
Troubleshooting Troubleshooting This chapter includes information on how to check for a problem with your Keysight Technologies spectrum analyzer, and how to return it for service. If you experience a problem or would like additional information about your analyzer, Keysight Technologies’ worldwide organization is ready... -
Page 190: Check The Basics
Troubleshooting Check the basics Check the basics Before calling Keysight Technologies, or returning an analyzer for service, perform the quick checks listed below. This check may eliminate the problem. • Is there power at the receptacle? • Is the analyzer turned on? Listen for internal fan noise to determine if the analyzer cooling fan is running. - Page 191 A button cell provides power to the real time clock of the spectrum N O T E analyzer. It is not rechargeable. If you find your N9320B encounters a clock defect, please contact your nearest Keysight Customer Contact Center (CCC) for service.
-
Page 192: Contact Keysight Technologies
Troubleshooting Contact Keysight Technologies Contact Keysight Technologies Keysight Technologies has offices around the world to provide you with complete support for your spectrum analyzer. To obtain servicing information or to order replacement parts, contact the Keysight Technologies customer contact center listed below. -
Page 193: Menu Maps
Menu Maps Menu Maps This chapter provides a visual representation of the front panel keys and their associated menu keys (in Spectrum Analyzer mode). Refer to Chapter 4, Key Reference,” on page 89 for key function descriptions. The name editor menu is shown separately, though it is accessed when entering data for many keys. -
Page 194: Amplitude Menu
Menu Maps Amplitude Menu Amplitude Menu Amplitude Apply Corrections Y Axis Freq Interp Ref Level Units Attenuation Antenna Ref Lvl Offset Corrections Auto Man [OFF] File Cable Scale/Div Corrections [OFF] Scale Type Other Att Limit [OFF] On Off User Scale >Ext Amp Gain Delete All [OFF]... -
Page 195: Bw/Avg Menu
Menu Maps BW/Avg Menu BW/Avg Menu Res BW Auto Auto Man Video BW Video Avg Auto Man VBW/RBW Pwr Avg Auto Man Average On Off Avg Type > Auto Man EMI Res BW Sweep Type Swept... -
Page 196: Det/Display Menu
Menu Maps Det/Display Menu Det/Display Menu Det/ Display Detector > Auto Auto Man Positive Center Peak Active Fctn Negative Bottom Position> Peak Average Video RMS Display Line Sample Normal Limits > Type Limit 1 > Point Upper Lower Limit Frequency Limit 2 >... -
Page 197: File Menu (1 Of 2)
Menu Maps File Menu (1 of 2) File Menu (1 of 2) File Catalog> By Date Save Screen Type> By Name Load State Sort> Delete> Trace Order Limits Copy Local Down Return Return Save Now Delete Now Lim it 1 By Date Type>... -
Page 198: File Menu (2 Of 2)
Menu Maps File Menu (2 of 2) File Menu (2 of 2) File Catalog Load Now By Date Save> Type> By Name State Load> Sort> Delete> Trace Destination> Order Limits Copy> Up Down Return Return Trace 1 Copy Now By Date Limit 1 Screen Trace 2... -
Page 199: Frequency Menu
Menu Maps Frequency Menu Frequency Menu Frequency Center Freq Start Freq Stop Freq CF Step Auto Man Freq Offset Signal Track... -
Page 200: Marker Menu
Menu Maps Marker Menu Marker Menu Marker Select Marker > Freq Counter Delta Freq Counter > 1,2,3…12 On Off Resolution Delta Pair Normal Auto Man Delta Span Pair Delta > Phase Noise > Span Center Opti F Noise On Off Marker Noise All Off Funtion >... -
Page 201: Marker-> Menu
Menu Maps Marker-> Menu Marker-> Menu Marker -> Mkr-> CF Mkr-> CF Step Mkr-> Start Mkr-> Stop Mkr-> Ref Lvl... -
Page 202: Measure Menu (1 Of 2)
Menu Maps Measure Menu (1 of 2) Measure Menu (1 of 2) Meas Avg Number X dB Avg Number On Off On Off Avg Mode Avg Mode Measure Off Exp Repeat Exp Repeat Integ BW Max Hold Channel Power > Chan Pwr Span Occ BW% Pwr Occupied BW >... -
Page 203: Measure Menu (2 Of 2)
Menu Maps Measure Menu (2 of 2) Measure Menu (2 of 2) Total Pwr Ref Avg Number Chan Integ BW Absolute Meas On Off Avg Mode PSD Ref Relative Chan Span Exp Repeat Measure Off Sweep Time Abs AND Rel TOI Span Auto Man Channel Power... -
Page 204: Mode - Tracking Generator
Menu Maps MODE - Tracking Generator MODE - Tracking Generator MODE Spectrum Amplitude TG Power Sweep Store Ref Analyzer (1->3) Tracking Attenuation Normalize Generator Auto Amptd Offset Normalize Norm Ref Lvl Power Meter AM Modulation Amptd Step Tracking Peak Norm Ref Posn Analysis Auto FM Modulation... -
Page 205: Mode - Power Meter
Menu Maps MODE - Power Meter MODE - Power Meter Zero MODE Power Meter Zero Type Auto Range Zero/Cal Dis Range Range Meas Disp Lower Upper Resolution Meas Setup Disp Mode Limits Meter Char Preset Chart View Upper Limit Pause Lower Limit Freq Limit Beep... -
Page 206: Mode - Am/Fm Modulation Analysis
Menu Maps MODE - AM/FM Modulation Analysis MODE - AM/FM Modulation Analysis Peak+ Auto Scale AM /FM Carrier Freq MODE M odulation Analysis Peak- Ref Value IFBW Peak+?/2 EqLPF Ref Position Scale/Div Detector Ext Gain X Scale Peak Hold Y Scale Return Return More... -
Page 207: Mode - Ask/Fsk Modulation Analysis
Menu Maps MODE - ASK/FSK Modulation Analysis MODE - ASK/FSK Modulation Analysis MODE Symbol Meas Filter ASK/FSK Auto Scale Carrier Freq Modulation Analysis Waveform Ref Filter Ref Value Symbol Rate ASK/FSK Error Alpha/BbT Filter Setup Ref Position Eye Diagram Filter Symbols Scale/Div View Ext Gain... -
Page 208: Name Editor Menu
Menu Maps Name Ed itor Menu Name Editor Menu Name ABCDEFG HIJKLMN OPQRSTU VWXYZ Return... -
Page 209: Peak Search Menu
Menu Maps Peak Search Menu Peak Search Menu Peak Search Peak Max Value Peak Search Excursion Excursion Peak Next Peak & Threshold Threshold Threshold Next Pk Right Hidden Peak Search Next Pk Left Type > Min Search Pk-Pk Search More Return 1 of 2 Continuous Pk... -
Page 210: Preset/System Menu
Menu Maps Preset/System Menu Preset/System Menu Preset/ Power O n Align (Ext Cable) Preset Alignment> System Last Preset Pwr on/Preset Preset Type> Save User Alignment > Preset Language> Timebase CAL OUT Upgrade Load defaults Diagnostics> More Return Return Return 1 of 3 Show System User Prev Page... -
Page 211: Span Menu
Menu Maps SPAN Menu SPAN Menu SPAN Span Full Span Zero Span Speaker Vol Last Span Demod... -
Page 212: Sweep/Trig Menu
Menu Maps Sweep/Trig Menu Sweep/Trig Menu Sweep/ Trig Sweep Time Free Run Auto Man Sweep Video Single Sweep External Pos Cont External Neg More More 2 of 2 1 of 2... -
Page 213: Trace Menu
Menu Maps Trace Menu Trace Menu Trace Tr ace Variable A Trace math 1 2 3 4 Trace 1 Variable B Clear Write Trace 2 Variable C Max Hold Trace 3 A-B->C Min Hold On Off >A+B->C View Math By Blank LogPWR Return... - Page 214 Menu Maps Trace Menu...
-
Page 215: Index
Index Numerics low-level signal, multiple signals, 3GPP W-CDMA, Enter key, occupied BW, 802.11a, error message, SEM, 802.11b, ESD, source’s frequency drift, external reference, TOI, 53, measuring phase noise, Abs Start, menu maps, Abs Stop, factory preset state, messages, Active Fctn Position, Fail Mask, Min Search, adjacent channel power,... - Page 216 requirements ventilation, Res BW, resolving signals equal amplitude, hidden by large signals, Save, Scale/Div, Search Criteria, Show System, Signal Track, SPAN key, spectrum emission mask, Start Freq, Stop Freq, Sweep/Trig key, symbols, Threshold Hidden, Meas key, measuring, TOI Span, tracking drifting signals, Uncoupled, definition, using frequency counter, VBW/RBW,...
- Page 218 © Keysight Technologies, Inc. 2008-2014 Printed in China Fourth Edition, June 2014 *N9320-90007* N9320-90007...
Need help?
Do you have a question about the N9320B and is the answer not in the manual?
Questions and answers