Table of Contents
Advertisement
Quick Links
Advertisement
Table of Contents

Related Manuals for Sencore VB330


Summary of Contents for Sencore VB330
- Page 1 VB3xx 10G Probes Applies to software release v5.3 Form 8046E February 2017...
- Page 2 Inquiries should be made directly to those companies. This document may also have links to third-party web pages that are beyond the control of Sencore. The presence of such links does not imply that Sencore endorses or recommends the content on those pages. Sencore acknowledges the use of third-party open source software and licenses in some Sencore products.
-
Page 3: Table Of Contents
........1.1.1 VB330 – Overview ....... . . 1.1.2 10G Probe –... - Page 4 4.8.4 Initial Setup Troubleshooting ......QUICK SETUP GUIDE Basic Setup ......... . Input Signal Definitions .
- Page 5 6.6.2 RDP — Setup ........Traffic .
- Page 6 6.12.4 About — Credits ........187 A Appendix: VB330 Versus VBC Alarms B Appendix: Monitoring Practices RTP Monitoring .
- Page 7 Appendix: Restoring probe factory defaults VB3xx 10G Probe User’s Manual version 5.3...
-
Page 8: Document Revision History
Document Revision History Date Version Description February 2017 Updated manual to reflect changes in v5.3 software March 2016 Updated manual to reflect changes in v5.2 software February 2015 Updated manual to reflect changes in v5.1 software January 2014 Updated manual to reflect changes in v5.0 software VB3xx 10G Probe User’s Manual version 5.3... -
Page 9: Introduction
The VB330 10G Probe can also be managed via the VideoBRIDGE Controller. The VideoBRIDGE Controller will add management features like alarm aggregation and report functionality. The VB330 10G Probe is a module housed in a 1 RU chassis. Several VB330 modules may be installed in one chassis, extending the monitoring capacity. -
Page 10: Probe - Functionality
1.1.2 10G Probe – Functionality An IP-based network is fully transparent with respect to signal contents quality, provided that the IP packets arrive, and provided that they arrive in time. The 10G Probe therefore uses the patented MediaWindow to allow monitoring at-a-glance of packet loss and errors in inter-packet arrival time. This way the operator can conveniently ensure correct signal quality at IP-level. -
Page 11: How To Use This Manual
Chapter 6 THE 10G PROBE GRAPHICAL USER INTERFACE describes the graphical user interface (GUI) as seen when pointing a web browser to the 10G Probe’s IP address. A Appendix: VB330 Versus VBC Alarms describes the alarm handling in the 10G Probe versus the VideoBRIDGE Controller. -
Page 12: Principle Of Operation
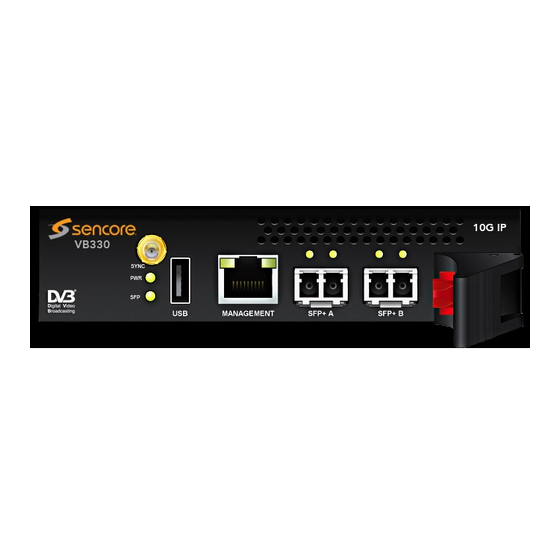
2 PRINCIPLE OF OPERATION The VB330 module is equipped with two SFP+ optical ports and one RJ45 Ethernet port. The user selects which transport stream signal input to be used by the monitoring engine. Management of the probe is conducted via the Ethernet management port or alternatively in-band via the video/data ports. - Page 13 SNMP Alarm Alarms Lists Alarm Settings Threshold Settings Signal Measurements Figure 2.2: Simplified Diagram of the Alarm Handling in the 10G Probe VB3xx 10G Probe User’s Manual version 5.3...
-
Page 14: Safety
3 SAFETY Read the installation instructions before connecting the chassis unit to the power source. Do not install the chassis unit with power on. The chassis is intended for installation in restricted access areas. A restricted access area can be accessed only through the use of a special tool, lock and key, or other means of security. Blank face plates and cover panels serve three important functions: they prevent exposure to hazardous voltages and currents inside the chassis, they provide electromagnetic interference shielding and they direct the flow of cooling air through the chassis. -
Page 15: Installation And Initial Setup
4 INSTALLATION AND INITIAL SETUP 4.1 Quick Installation Guide 1. Read the safety instructions, refer to chapter 3 2. Install the unit in a 19 inch rack for rack mount probes, refer to section 4.6 3. Connect the signal cables, refer to section 4.5 4. -
Page 16: Dual Power Supply
4.2.1 Dual Power Supply The Enhanced Chassis (VB300) is delivered with two 100–240V AC / 75W power supplies, providing power redundancy. In normal operation load is shared between the two power supplies. If mains fall-out occurs for one of the power sources or one of the power supplies fails, the power supply still in operation will take the full load, seamlessly. -
Page 17: Cooling System
4.3.2 Cooling System The chassis is equipped with six long-life fans that suck in air from front of the chassis. The air exits at the back of the unit. The fans are temperature controlled, allowing them to run at an optimum speed. Venting holes at the sides of the chassis provide an optional air intake, ensuring good aerodynamical properties of the cooling air flow. -
Page 18: Serial Number Location
SFP+ B: SFP+ optical interface – main data input. The VB330 module’s SFP+ B port is shipped with an SR (short range) SFP+ module. This should be replaced if the system requires a different SFP+ module, e.g. for use with single mode fibre. Note that using other SFP+ modules than the type shipped may imply that special safety precautions must be taken, like using protective glasses. -
Page 19: Installing The Unit In A Rack
STAT: Green status LED for future use MANAGEMENT: The green LEDs indicate link and activity. A blinking LED indicates activity, whereas a steadily lit LED indicates link without activity (traffic). If the left LED is active the speed is 10/100Mbps, the right LED indicates 1000Mbps. LINK: Green LED indicating SFP link status ACT:... -
Page 20: Powering Up The Unit
the six screws covering the mid mounting holes to the front mounting holes. Remount the rack ears at the middle of the unit. Figure 4.5: Rack Ears Mounting – Side View of Enhanced Chassis Showing Screw Holes 4.7 Powering up the Unit Once the chassis is securely mounted and signal cables are connected, it can be powered up by connecting the power cable to a mains source. -
Page 21: Initial Configuration Via Serial Console Emulated Over Usb
10.0.20.100 and the subnet mask to 255.255.0.0. When the IP address of the PC has been set to match the VB330 factory setting, the permanent network settings can be configured through the VB330 web browser interface. Refer to sections 4.8.3 and 6.10.5 for details on how to launch the VB330 graphical user interface and how to set the network parameters. - Page 22 Figure 4.7: Connecting to the serial console over USB Most operating systems will have native support for the FT232 driver needed. When a USB cable is connected between a PC and the 10G Probe, the operating system will detect a new USB device. For Windows, the new device will appear as a COM port in the Device Manager view as shown in figure 4.7.
- Page 23 Menu: /ewe/probe/core/setup/ethernet/ ============================================================================== <0> Back <9> Exit <1> ethStatusDoc ------------------------------------------------------------------------------ <A> data_dhcp - false SFP+ B port (eth0) DHCP <B> data_ipa - 10.0.30.101 SFP+ B port (eth0) IP address <C> data_mask - 255.255.255.0 SFP+ B port (eth0) netmask <D> data_gateway - 10.0.30.1 SFP+ B port (eth0) IPv4 GW <E>...
-
Page 24: Verifying Correct Initial Setup Of The 10G Probe
Make sure Management is enabled (set to true) – otherwise management via web will not be possible. To configure the data/video interface, enter values for data_ipa, data_mask, data_gateway or alternatively enable data_dhcp. Set data_management to true to enable web access via the data interface. When all the listed parameters have been configured, the probe must be rebooted to let the parameters take effect. - Page 25 Figure 4.9: Web-based management view Make sure that the management and data/video subnets do not overlap (even if only one is physically connected) Make sure the probe was rebooted to activate the new settings Clear the browser’s cache VB3xx 10G Probe User’s Manual version 5.3...
-
Page 26: Quick Setup Guide
5 QUICK SETUP GUIDE This quick setup guide is intended to provide a step-by-step explanation of how to setup a probe once the initial setup has been performed (as described in chapter 4). More detailed instructions are found in chapter 6 of this manual. The Return Data Path and Full Service Monitoring features are not covered by this quick setup guide. -
Page 27: Ott Input (Ott Engine Option Only)
2. Define stream page name(s) in the Setup — Pages view (not strictly necessary). 3. Join multicasts in the Multicasts — Join view or in the Multicasts — Streams view. 5.2.2 OTT Input (OTT Engine Option Only) 1. Define the OTT channel manifest URLs and channel names in the OTT — Channels view. Leave the Threshold and VBC threshold settings at default values for now. - Page 28 Multicasts — Ethernet thresh. view. These thresholds are associated with streams in the Multicasts — Streams view. In addition to the miscellaneous thresholds, that affect only the streams with which they are associated, the Alarm — Alarm setup view allows the user to enable and disable alarms on an overall basis. It is also possible to define the alarm severity levels for different alarms in this view.
- Page 29 VB3xx 10G Probe User’s Manual version 5.3...
-
Page 30: The 10G Probe Graphical User Interface
6 THE 10G PROBE GRAPHICAL USER INTERFACE VB3xx 10G Probe User’s Manual version 5.3... - Page 31 The VB330 web interface is reached by pointing a web browser to the IP address of the 10G Probe as shown in the screen shot above. The following web browsers are recommended: Microsoft Edge Microsoft Internet Explorer 11 or higher...
-
Page 32: Main
Below this display, the following parameters are shown: NTP/timesync (Bulb): The NTP/timesync bulb indicates whether the VB330 clock is locked to an external time reference signal. Green indicates that the VB330 is locked to an external reference whereas gray indicates that the VB330 runs in unlocked mode. - Page 33 RDP view. Counters and alarms Clear all: Click the Clear all button to reset all counters, graphs and alarms. All VB330 measurement and alarm history is cleared. Note that it is not possible to undo this operation.
- Page 34 IPv4 status: The IPv4 status as defined in the Setup — Ethernet view IPv4 address: The probe IPv4 Ethernet data/video interface IP address as defined by the user in the Setup — Ethernet view IPv4 netmask: The probe IPv4 Ethernet data/video interface IP address as defined by the user in the Setup —...
-
Page 35: Main - Cpu Usage
The number of enabled OTT channels. Profiles: The total number of profiles in the enabled OTT channels. At the very bottom of the Summary page, an overview of the Ethernet network interfaces on the VB330 are displayed. Network interfaces Interface: The ID of the selected network interface. -
Page 36: Main - Thumb Overview
button will display the historical maximum value for an averaging period of 10s and 60s respectively. To clear peak values click the Clear peaks button. CPU capacity is automatically allocated by the probe, and core 8 always handles ‘User’ processes, like the web server and thumbnail extraction. -
Page 37: Main - Eii Graphing
White: Unknown (typically due to the VB330 being unable to decode video) Grey: freeze-frame detection is disabled. Green: freeze-frame detection is enabled, no freeze-frame is detected. - Page 38 Eii is short for External Integration Interface and constitutes a set of XML files accessible through the probe web server interface for machine access to measurement data. Portions of the Eii interface are available in this view for simple trend graphing over arbitrary long time by the web browser.
-
Page 39: Alarms
6.2 Alarms SNMP Alarms Alarm Lists Alarm Settings System Events and Scheduling FSM Settings FSM Measurements OTT Thresholds ETR Thresholds ETH Thresholds PID Thresholds Service Thresholds OTT Channel ETH Multicast OTT Analysis ETH Measurements OTT Option ETR 290 Option Figure 6.1: Alarm handling in the 10G Probe. Figure 6.1 shows an overview of the alarm handling in the 10G Probe. -
Page 40: Alarms - All Alarms
These alarms will also be sent as SNMP traps to support third party management systems. Refer to Appendix: VB330 Versus VBC Alarms for a description of alarm handling in the VideoBRIDGE Controller. -
Page 41: Alarms - Alarm Setup
6.2.2 Alarms — Alarm setup The Alarm setup represents the final filtering stage for VB330 alarms. The user selects whether an alarm should be enabled or ignored, and associates an error severity level with each alarm, and associates an error severity level with each alarm. - Page 42 If enabled, the alarm will be present in the alarm list, color green Warning: If enabled, the alarm will be present in the alarm list, color yellow Error: If enabled, the alarm will be present in the alarm list, color orange Major: If enabled, the alarm will be present in the alarm list, color red Fatal:...
- Page 43 TTL changed: The Time-To-Live field is changing Default: Enabled, severity Error TOS changed: The Type-Of-Service field is chang- Default: Enabled, severity Error Multiple mcast sources: There multiple multicast Default: Enabled, sources severity Error Mcast source changed: The multicast source changed to Default: Enabled, one of the valid multicast sources severity Error...
- Page 44 CRC: Table checksum error Default: Enabled, severity Major PCR: Program Clock Reference error Default: Enabled, severity Major PCR Accuracy: Program Clock Reference accuracy Default: Enabled, error (PCR jitter) severity Major PTS: Presentation Time Stamp error Default: Enabled, severity Major CAT: Conditional Access Table error Default: Enabled, severity Major...
- Page 45 CA System: CA System error Default: Enabled, severity Major PID min. bitr. PID minimum bitrate below thresh- Default: Enabled, severity Major PID max. bitr. PID maximum bitrate exceeds Default: Enabled, threshold severity Major PID checks: PID check error Default: Enabled, severity Major Service min.
- Page 46 The number of profiles changed: The number of profiles flagged in Default: Enabled, the manifest file changed severity ‘Warning’ Profile stream type changed: The stream type of the profile Default: Enabled, changed in the manifest severity ‘Warning’ Minimum profiles The channel has less profiles than Default: Enabled, specified in the threshold severity Warning...
-
Page 47: Alarms - Flash Alarms (Flash Option)
HTTP server error: HTTP 5xx server error Default: Enabled, severity ‘Major’ Static manifest: Manifest file unchanged for longer Default: Enabled, than configured threshold. severity Major Manifest parse error: Failed to parse manifest file. Invalid Default: Enabled, format severity ‘Major’ Unknown manifest: Cannot recognize manifest XML for- Default: Enabled, severity ‘Fatal’... -
Page 48: Ott (Option)
6.3 OTT (Option) 6.3.1 OTT — Active testing The OTT option enables monitoring of up to 500 OTT channels. Up to 50 OTT engines (depends on license) can operate in parallel, and each engine licensed allows any channels to be analyzed. Each engine analyses channels in series and can be configured with any number of channels up to the maximum allowed by the license. -
Page 49: Ott - Details
Thumb: If the selected channel is of type HLS, HDS, DASH or RTMP a thumbnail of the content will be decoded and updated. Thumbnail decoding is a process asynchronous of the channel analysis and therefor should not be expected to be updated at the same time. The main purpose of the thumbnails is to provide brief information about the channel contents. -
Page 50: Ott - Details - Profiles
6.3.2.1 OTT — Details — Profiles The Profiles view in this pop-up consists of two tables detailed below: The following information relevant for the overall OTT channel is shown in the first part of the Details — Profiles pop-up window: Channel: The channel name defined by the user and linked to a URL in the OTT —... - Page 51 Profile status: The channel health bar displays the current status for individual channel profiles. Profiles are separated by vertical black lines. Colors indicate profile alarm status: Green: OK Yellow: Warning Orange: Error Red: Major Black: Fatal Stream type: Channel and profile information is resolved from the manifest files. At channel level the OTT format is displayed (Smoothstream, HLS, Adobe HDS, MPEG DASH or SHOUTcast).
-
Page 52: Ott - Details - Manifest
6.3.2.2 OTT — Details — Manifest The Manifest view shows health information on the overall manifest file for the channel as well as for the manifest files for the individual profiles. Channel: The channel name defined by the user and linked to a URL in the OTT — Channels view. - Page 53 Profile info: The type of stream is shown here. Apple HLS, Microsoft Smoothstream, Adobe HDS, MPEG DASH or SHOUTcast. Manifest size: The size in bytes of the main/top manifest file for the overall channel. Manifest file: Clickable URL for displaying the manifest file as text for the overall channel. Manifest URL: A clickable link to the current main/top manifest file for the overall channel.
-
Page 54: Ott - Details - Alarms
6.3.2.3 OTT — Details — Alarms The Details — Alarms view gives an at-a-glance overview of any active OTT alarms for the selected channel. An alarm log for the selected channel is also provided here. In the right corner of the pop-up window is a free text search field used to narrow down the entries in the alarm log. -
Page 55: Ott - Details - Thumbnails
6.3.2.4 OTT — Details — Thumbnails The Thumbnails tab will provide information about the current thumbnails in the channel. The quality of the content in the selected profile can be viewed in the thumbnail section, and the user may alter the selected profile in the drop down list. The section on the right hand side provides specific decoder and chunk information. -
Page 56: Ott - Details - Alignment
Chunk Information Engine ID: The OTT engine monitoring the selected channel. Channel ID: The ID of selected channel corresponding to the list of channels defined by the user. Profile ID: The ID of the selected profile. Bitrate: Bitrate rate of the a chunk. Streamtype: The type of the stream detected;... - Page 57 Chunk/Sequence Number: The chunk or sequence number for the current thumbnail. This is either signaled in the stream, or generated by the probe. If the sequence numbers are highlighted in yellow, the thumbnails are not generated from the same chunk for all profiles, and may therefor appear to be out of synchronization.
-
Page 58: Ott - Latency
6.3.3 OTT — Latency The OTT Channel Latency Distribution feature makes it possible to measure the delay from when a chunk is available through different caches, compared to its origin. Before using this feature, you must set aside a number of OTT engines to exclusively measure the timings of one channel on one server. -
Page 59: Ott - Channels
Clicking Distribute selected will distribute the selected channels across the licensed OTT engines (the VB330 can be licensed with up to 50 OTT engines). Clicking Edit selected will open the Edit channel pop-up view associated with the highlighted channel. Batch editing is supported;... - Page 60 General Enabled: Check the ‘Enabled’ check box to start monitoring the OTT ser- vice. Select engine: A number between 1 and 50, depending on license activated, indicating which OTT engine the channel uses. Threshold: The OTT threshold that should be assigned to the OTT channel. OTT thresholds that have been defined in the OTT —...
- Page 61 Adv. manifest Enable adv. settings: Check this box to enable the advanced manifest settings. If unchecked, all settings on this page are ignored. Method: Determines which HTTP method to use when requesting the top-level mani- fest file. Supported methods are GET and POST. Content-Type: When requesting the manifest using the HTTP POST, use this Content-Type for the submitted request body.
-
Page 62: Ott - Settings
These engines will not be available for regular OTT monitoring, and the value must be less than the total number of licensed OTT engines on the probe (up to 50 for the VB330). See OTT — Latency for more info. 6.3.6 OTT — Thresholds The OTT Threshold presets list shows OTT threshold templates configured by the user. - Page 63 To add a threshold template to the list click the Add new threshold button. This will open the Edit threshold pop-up view, allowing the user to define threshold parameters. A threshold template entry can be selected by clicking the threshold template; the list entry will be highlighted. Several list entries can be selected by using regular Ctrl + click functionality.
-
Page 64: Multicasts
6.4 Multicasts 6.4.1 Multicasts — Parameters The Multicasts — Parameters view displays detailed information about each stream. The user selects which group of measurements should be displayed. Selections are IP parameters, TS parameters, Ethernet parameters, RTP and FEC parameters, User-defined parameters and Statistical parameters. - Page 65 Peak and aggregate measurements are cleared when the Clear counters or Clear counters all pages button is clicked. Clicking the Export button will allow export of the measurement data as an XML file that is opened in a new window. Click the Trim ch-list button to unjoin streams with current status ‘No signal’, thereby removing them from the list.
- Page 66 Joined multicasts Click the information icon to access the Detailed Monitoring pop-up view. Thumb: A thumbnail is displayed for each stream. Click the small thumbnail to view a larger image that is updated more frequently. Name: The stream name specified by the user in the Edit Multicast view Signal: Time since last signal loss Page:...
- Page 67 Max bitrate: The maximum current bitrate measurement IP packets: The number of IP packets received Dst address: Multicast/unicast destination address : port TOS: Type-Of-Service (also called Differentiated Services Field) TTL: Time-To-Live VLAN ID: Native VLAN ID of this stream Src address: Multicast/unicast source address : port Joined src: The source address of the originally joined multicast.
- Page 68 Max hole size: Maximum number of consecutive dropped RTP packets. The sequence 1,2,3,10,11,12,15 gives a max hole size of 6. Min hole sep: Minimum number of RTP packets separating any holes. The sequence 1,2,3,10,11,12,15 gives a min hole sep of 3. Num holes: Number of packet loss sequences.
- Page 69 Shown if no data is received for the stream. There should be a match between presenting this icon and a No-signal alarm; however since the alarm and thumbnail mechanisms work independently of each other they have been given different names (loss of signal and no signal).
- Page 70 The Detailed Monitoring pop-up is activated by clicking a stream line in the monitoring list. The 10G Probe is continuously gathering detailed information for the selected multicast. The VB330 will continue updating the detailed information for the selected multicast until another is selected. Clicking the Clear button will clear all information about the selected stream, including PSI/SI analysis data.
- Page 71 Directly beneath this list, the current parameters for the selected stream are displayed, as in the Joined multicasts list. In the Detailed Monitoring — IAT view the Inter Arrival Time histogram shows the accumulated number of IAT measurements within each presented interval. Vertical green lines indicate the maximum and minimum IAT values.
- Page 72 Thumb View The Thumb View pop-up is accessed by clicking an information icon in the Detailed Monitoring — Services view. This view presents a large thumbnail, as well as video and audio metadata for the selected stream, with an increased update rate compared to non-selected streams. Service audio level is indicated by one audio level bar per audio component.
- Page 73 Multicast Name: The name of the multicast containing the selected service, as defined by the user Type: The type of the stream containing the selected service; multicast or unicast Multicast address: The multicast address of the stream containing the selected service Multicast port: The port number of the multicast containing the selected service Transport stream ID:...
- Page 74 Pixel aspect ratio: The video pixel aspect ratio of the selected service, or “N/A” if no information is available Codec: The video encoding format of the selected service Quality: The video sampling format of the selected service Frame rate: The video frame rate of the selected service (Hz) Audio PID/Component PID/Component: The audio PID of the selected service for MPEG-TS services, or...
-
Page 75: Multicasts - Parameters - Fields
6.4.2 Multicasts — Parameters — Fields The Multicasts — Parameters — Fields view enables selection of the parameters to be displayed in the Multicasts — Parameters view. Note that thumbnails must also be enabled in the Setup — Params view for thumbnail availability. VB3xx 10G Probe User’s Manual version 5.3... -
Page 76: Multicasts - Summary
6.4.3 Multicasts — Summary The intention of this page, together with the alarm list, is to provide enough information for the operator to immediately see if there is anything seriously wrong with one or more Ethernet input streams. The overall status for the Full Service Monitoring (FSM) is also shown. Throughout this view the bulb colors indicate the most severe active alarm. -
Page 77: Multicasts - History
The error-second statistics interval is selected by clicking the buttons. For example, clicking the ES–8h button will present error-seconds for the last 8 hours. If 10 streams for a page have been without signal for the last 8 hours, the nosig will show as 80hours. The following parameters are presented (note that the error second values are accumulated from probe boot time, and they will only be cleared by reboot or by clicking the Clear all counters button in the Main view):... - Page 78 hour (when 4 days is selected). Clicking the Clear history button will reset all history graphs. Tool-tip information is available for each bar and shows the time-interval for the bar and its exact value. For example, the tool-tip information ‘1315-1330:2’ means that within the time interval 13:15–13:30 there were 2 occurrences.
-
Page 79: Multicasts - Join
6.4.5 Multicasts — Join In order for the defined Ethernet multicasts to be monitored by the probe, they must be joined. The Multicasts — Join view and the Multicasts — Streams view allow the user to select which multicasts that are joined by the probe. Streams defined in the Multicasts —... -
Page 80: Multicasts - Streams
6.4.6 Multicasts — Streams In this view the operator can define multicasts available to the probe and associate a name with each multicast address. This name will be used by the probe when referring to the multicast. If no name has been defined the probe will use the multicast address:port notation. - Page 81 General Name: A name should be assigned to each unicast/multicast. The name will be used throughout the VB330 user interface when referring to this stream. It may also be used by an external management system like the VideoBRIDGE Controller. Address: The IP address of the unicast or multicast.
- Page 82 SSM source 1: The SSM address is only needed for IGMP v3 systems. A name may be associated with the SSM source address. SSM source 2: Additional SSM source addresses may be specified to enable back-up solutions. Note that it is the operator’s responsibility to ensure that a multicast is only transmit- ted by one SSM source at any time.
- Page 83 Select ETR engine: If the probe is licensed for several Ethernet ETR engines the user may select which engine should be used to analyze the stream. The default ETR engine selection is Ethernet1. It is also possible to use the Distribute ETR engines button described above to assign streams to engines.
- Page 84 Redundancy Has FEC: The stream carries COP3 (SMPTE 2022-5) Forward Error Correction. If enabled, statistics about FEC drops and correctible errors will be reported for the stream. First stream: For a Seamless Protection Switching (SMPTE 2022-7) protected stream, select the first of the two redundant RTP streams here. For other streams, (none) should be selected.
-
Page 85: Multicasts - Ethernet Thresh
6.4.7 Multicasts — Ethernet thresh. Thresholds are used to determine when to actually raise an alarm upon detection of an error. The Ethernet thresholds are used for generating Ethernet probe alarms as well as for calculating error-seconds. Error seconds and ETH probe alarms are issued whenever measurements exceed the defined threshold levels for a parameter. - Page 86 Ethernet thresholds Name: A text string that identifies the Ethernet threshold IAT:MLR error: This threshold contains error limits for IAT (Inter-packet Arrival Time) and MLR (Media Loss Rate). The IAT limit is the first parameter (before the colon), the MLR limit is the last parameter.
-
Page 87: Mw (Media Window)
PCR packets do not carry a valid CC field). The patented Sencore VideoBRIDGE Media Window presents both jitter and packet loss measurements in one graph, with jitter (IAT) values growing upwards (+ve Y) and packet loss (MLR) growing downwards... - Page 88 (-ve Y). Each sample along the x-axis corresponds to a measurement time-interval that depends on the range of the graph selected. Periods of no sync are also displayed in the graph. Error-second statistics for the graph-interval is displayed to the right. As the graphs are zoomed or scrolled the error-second statistics is updated as well as the graphs.
-
Page 89: Media Window - Selected Channel
6.5.1 Media Window — Selected channel The Media Window — selected channel view is activated by clicking a multicast label in the MW page. By clicking the pop-up button a pop-up window will appear, the user can have this separate window showing selected channel even when navigating away from the probe. -
Page 90: Media Window - Bandwidth Graph
6.5.2 Media Window — Bandwidth graph By clicking the BW:MLR button the graph displays the peak bandwidth as a function of time. The negative part of the composite graphs is still the packet loss (i.e. the MLR). If the stream contains a transport stream (mapping TS/x) the bitrate corresponds to the Multicasts parameter Net bitrate (i.e. -
Page 91: Rdp (Return Data Path)
By clicking the IAT:RTP button the graph displays the packet jitter as a function of time. The composite graphs displays the RTP packet loss below the X-axis. If the monitored stream is not RTP encapsulated, IAT will be represented by grey color and there will never be any indication of packet loss in the graph. 6.6 RDP (Return Data Path) The Return Data Path feature enables forwarding of streams from any probe interface to another destination IP address. -
Page 92: Rdp - Setup
6.6.2 RDP — Setup Each of the RDP engines is configured separately. First the Mode is selected. Depending on the mode either the Relay or Record settings needs to be configured. The Input selects the stream or interface to relay or record. These are the settings: Mode and Input Mode:... - Page 93 Port: The port to forward to. The combination of IP address and port fully describes the destination address. TTL: The Time-To-Live flagging of the relayed signal. The default value is 64. Timeout: The relaying period in minutes. If the value 0 is selected, no timeout applies, and relaying will continue until it is stopped manually.
-
Page 94: Traffic
6.7 Traffic 6.7.1 Traffic — Protocols The Protocols view allows monitoring of IP traffic on the selected port in terms of the protocols used. The interface can be selected using the drop-down at the bottom of the page. Clicking the Clear statistics button will reset displayed values. - Page 95 Bitrate graph: Click the bitrate graph button to display a detailed bitrate graph for the specified protocol Frames Statistic: As above Frames/sec: Traffic speed for this protocol expressed in number of IP packets per second Frames: A graph displaying frames per second over time, displaying the last five minutes Frames graph: Click the frames graph button to display a detailed frames per second graph for the specified protocol...
-
Page 96: Traffic - Detect
6.7.2 Traffic — Detect The Traffic Detect view displays all UDP traffic sensed by the probe. Note that promiscuous network mode should be enabled in the Setup — Params view for the probe to detect all traffic, and not only multicasts already joined by the probe. -
Page 97: Traffic - Filter Statistics
Click the blue information icon to pop up the detailed stream info. Dst address: The multi- or unicast address Src address: The streams source address Name: The stream name, as defined in the Multicasts — Streams view. A generic name will be used for multi- or unicasts not defined by the user. - Page 98 RTP loss %: Percentage of time an average stream that matches the filter experiences RTP packet loss inside selected time period. Example: If the Last 1m period is selected and there are totally three streams caught by filter: stream A: present for 60 seconds, 4 RTP error seconds stream B: present for 30 seconds, 0 RTP error seconds stream C: present for 30 seconds, 5 RTP error seconds RTP loss % = 9ES / 120s...
- Page 99 The detailed graph window displays up to 4 days of history. Trending Clicking the Trending last 60m button will present at-a glance trending graphs for each parameter for the last 60 minutes. Clicking a graph icon displays the corresponding detailed graph for the selected filter. Clicking the trend graphs itself will bring up the same detailed graph but will plot all the filters so that they can easily be compared.
-
Page 100: Traffic - Filter Setup
6.7.4 Traffic — Filter setup The Traffic — Filter setup view makes it possible to define stream filter requirements affecting the Traffic — Detect and Traffic — Filter statistics views. Ten filters can be defined and enabled by the user. Statfilter settings: Name: A text string defining the filter... - Page 101 VB3xx 10G Probe User’s Manual version 5.3...
-
Page 102: Traffic - Microbitrate
6.7.5 Traffic — Microbitrate The Microbitrate feature allows sampling of bitrate at various sampling intervals. When enabling this feature, each Ethernet frame is timestamped in hardware on probe ingress. This timestamp is used to calculate exact bitrates at various sampling intervals. The Interval is the sampling interval of each bitrate calculation. -
Page 103: Ethernet
For multicast type traffic the traffic pattern will look more like the graph above. Here the bitrate is much more steady even for short intervals. The network never experiences near line-speed bursting since each stream is bitrate controlled by the sender. 6.8 Ethernet 6.8.1 Ethernet —... -
Page 104: Ethernet - Fsm - Monitor
6.8.1.1 Ethernet — FSM — Monitor The following parameters are continuously monitored for each service: Status: Red = active alarm, Green = no alarm Name: User defined service name Protocol: Type of protocol. HTTP or Ping IP address: IP address. Must be numeric, host name is not accepted Total number of valid checks Fail: Total number of invalid checks... -
Page 105: Ethernet - Fsm - Setup
6.8.1.2 Ethernet — FSM — Setup Each of the 10 FSM services may be defined or edited by clicking on the corresponding Edit button in the left hand table. The probe supports ping and generic HTTP-Get protocols for online status verification of arbitrary targets. After completing configuration of the selected service Apply changes must be pressed to save and apply the changes. - Page 106 These fields are common for both the ping and the HTTP-Get protocols: Enable: Enable by checking toggle button. Name: User-defined name of service Protocol: Select between ping and HTTP. Device: Ethernet interface to use for this service. Probe cycle: Time interval in seconds to wait between each activation. A value below 30 is not recommended.
-
Page 107: Ethernet - Fsm - Syslog
6.8.1.3 Ethernet — FSM — Syslog The VB330 has a built-in syslog server which captures all incoming messages (UDP, port 514). Messages are displayed in a pageable grid with the following columns: Facility, Severity, Timestamp, Hostname, Agent and Message. Currently displayed page can be exported as an XML-document. -
Page 108: Ethernet - Igmp
6.8.2 Ethernet — IGMP The IGMP view shows all IGMP (version 2 or 3) messages detected by the probe. This includes IGMP query messages sent by routers, IGMP reply messages sent by the probe itself and IGMP reply messages sent by other probes and devices on the same subnet. The live IGMP page can be paused by clicking the View list offline button. -
Page 109: Ethernet - Pcap
6.8.3 Ethernet — PCAP The VB330 can make PCAP recordings on the data interface of up to approximately 2 Gbyte (depending on the amount of free disk) based on simple user configurable filters. The PCAP format supports microsecond timing accuracy. -
Page 110: Etr 290 (Option)
Buffer use %: Current buffer utilization. At 100% the Dropped packets will start counting. Disk free: Remaining disk size. Capture: The recorded capture. May be invalid if recording is still in progress. Start recording: Click to start a new recording. This will clear the current rec.pcap file. Stop recording: Click to stop the current recording. -
Page 111: Etr 290 - Etr Overview
6.9.1 ETR 290 — ETR Overview The ETR 290 — ETR Overview view will show ETR 290 status for ETR 290 monitored streams. ETR 290 monitoring may be enabled for Ethernet streams in the Multicasts — Streams — Edit view. The streams currently being analyzed are highlighted and a circular progress icon shows the monitoring progress. -
Page 112: Etr 290 - Etr Details
The ETR 290 parameters are grouped into five different categories. The first three groups are defined in the ETSI TR 101 290 guidelines. The fourth category contains checks defined by Sencore allowing CA system checks, custom PID and service checks, content checks (checking the video for freeze-frames etc) and the Gold TS reference checks. - Page 113 If the Clear status button is clicked the error counts are reset and the ETR 290 analysis restarts. The details of the individual ETR 290 measurements are described in a separate document called Sencore VideoBRIDGE ETR 290 Details — Extended ETSI TR 101 290 Testing. Clicking the Show alarm graph button opens the Alarm graph pop-up view.
-
Page 114: Etr 290 - Pids
color representation. Periods of time when the stream has not been ETR monitored due to round-robin operation are represented by grey. By using the arrow buttons it is possible to view alarm occurrences up to 24 hours back in time even if the highest graph time resolution is selected. If alarms have occurred during the selected time period, the status timeline will not be all green. - Page 115 or resumed. A DVB or ATSC icon indicates the analysis mode. The analysis mode is defined as part of the ETR thresholds. By clicking the button Clear counters the minimum and maximum bitrates and the CC error counters will be reset. Note that this cannot be undone. When clicking the blue information icon associated with a PID details concerning that PID will be displayed.
-
Page 116: Etr 290 - Services
6.9.4 ETR 290 — Services The ETR290 — Services view lists the services and service components of the current stream of the selected input. The name of the current stream is displayed in addition to the two round-robin indicator icons when relevant: the time cycle icon and the lock icon. - Page 117 PID: Service component PID value Type: Service and component encoding format Bitrate: Individual current bitrate of services and components When clicking a service, details about the service and service components will be displayed. If a PID is scrambled this is indicated in the service tree by the color green or blue (for even and odd scrambling respectively).
- Page 118 Components: A list of the component PIDs and reference types. For PIDs which have a language descriptor (typically audio PIDs) the language code is also shown. EPG: If DVB EIT is present in the stream and EIT table IDs are configured in the Setup —...
-
Page 119: Etr 290 - Bitrates
Scrambling: An indication of whether the PID is scrambled or not. If the PID is not scrambled, the value will be ‘No’. If the PID is scrambled, information about the current control word is displayed: ‘Even 0x3’ or ‘Odd 0x2’. Number of CC errors: The number of CC errors detected during the monitoring period References:... -
Page 120: Etr 290 - Tables
The user may select to view either a list of services and component PIDs, to view PIDs only or to view PIDs without the null PID. This is selected by clicking the Show Services, Show only PIDs or Show only PIDs but not NULL PID button respectively. 6.9.6 ETR 290 —... - Page 121 By clicking the plus-icon at a table the table contents is displayed in detail. Clicking one of the table entries will allow viewing the table contents as a hexadecimal dump for detailed inspection. The selected table entry is highlighted in the table dump. Note that values shown in the table list may not correspond directly to the highlighted hex dump byte(s), because some of the table entries do not add up to whole bytes.
- Page 122 For streams which have electronic program guide information in the EIT table and the extraction of this information is enabled (in ETR thresholds and in Setup — ETR) the tree will show the text EIT. Clicking on this will bring up the list of present/following events (the current program and the next program to be broadcast) for the current stream will be displayed.
-
Page 123: Etr 290 - Pcr
6.9.7 ETR 290 — PCR The PCR jitter histogram displays PCR jitter as measured by the probe. A list of detected PCR PIDs in the selected stream is shown together with their current and maximum PCR jitter values. A PCR PID is selected for histogram presentation by clicking the associated table entry. - Page 124 to be enabled. The name of the current stream is displayed in addition to the two round-robin indicator icons when relevant: the time cycle icon and the lock icon. By clicking the lock icon the round-robin cycling is stopped or resumed. The pushbuttons Zoom in and Zoom out enables rescaling of the graph. This makes it possible to view PCR jitter values that are outside the range defined by the auto-scaling.
-
Page 125: Etr 290 - T2Mi (Requires T2Mi-Opt)
6.9.8 ETR 290 — T2MI (requires T2MI-OPT) T2MI monitoring is a licensing option available for transport streams over Ethernet. T2MI is enabled on a per stream basis, most of the information is found in this GUI extracted from the L1 current packets in the T2MI streams. - Page 126 Crc Errors whole packet: The number of CRC errors calculated over the whole T2MI packet since the monitoring of the stream started. L1 information: T2 version: The version of the T2 spec used. Up to version 1.3.1 is supported including T2 lite.
- Page 127 Start RF idx: The starting RF index. Frame idx: The frame index. Sub slice interval: The interval between sub slices. Type 2 start: The value of the type 2 start parameter. Regen flag: The value of the regen flag. PLP (Physical Layer Pipes) information: Current PLP: The PLP currently being received.
- Page 128 Detailed PLP information: PLP: The ID of the signalled PLP. Type: The signaled type of the PLP. Data PLP Type 1 is the most common, some signals can have a common PLP as well as well as other PLP types. Payload: Payload type of this PLP.
-
Page 129: Etr 290 - Scte 35 (Requires Scte35-Opt)
Rotation: Specifies if IQ rotation is enabled for this PLP. FEC type: Specifies the FEC coding type for this PLP. PLP num blocks max: The maximum number of blocks which can be used by this PLP. Frame interval: The frame interval for this PLP. Time IL length: The length of the time interleaver. - Page 130 SCTE 35 requires a license for the probe and also an ETR 290 engine to connect it to. The SCTE 35 option enables monitoring of SCTE 35 events of all streams captured by the ETR engines. It is recommended to one ETR engine dedicated to each SCTE 35 streams to get continuous monitoring. The SCTE 35 option enables monitoring of SCTE 35 events of all streams captured by the ETR engines.
-
Page 131: Etr 290 - Status
transport stream. Splice NULL messages are not logged. 6.9.10 ETR 290 — Status The ETR 290 — Status view shows a stream content overview linked to current alarms, making it easy to view what services and PIDs are currently affected by errors. By clicking any of the ‘Service view’, service or component nodes it is possible to view the same details that are available in the ETR 290 —... -
Page 132: Etr 290 - Compare
6.9.11 ETR 290 — Compare The Compare view is based on analysis performed by the ETSI TR 101 290 engine and will only be visible if the probe is licensed with the ETR 290 option. To get this functionality go to ETR 290 — Compare. The Compare view allows comparison of services or transport streams across different probe interfaces. - Page 133 the list. Clicking the Compare selected button will launch a condensed overview page that allows status parameters for services or streams to be viewed side by side. Key parameters are presented in one column for each service/stream, and it is easy to recognize differences in signal contents or alarm status. The number of streams that can be compared depends on screen size.
- Page 134 Max. eff. bitr: The maximum effective bitrate (null packets removed) measured for the selected stream or the stream containing the selected service Min. tot. bitr: The minimum total bitrate (including null packets) measured for the selected stream or the stream containing the selected service Max.
- Page 135 If a service is selected for comparison this subview simply shows the selected service and any active alarms affecting the service. Services If a transport stream is selected for comparison the Services subview displays a list of services present in the stream. Clicking the plus icon at a service will expand the service tree, displaying the service’s individual components.
-
Page 136: Etr 290 - Etr Thr
The Alarm graph subview shows similar alarm graphs as the ETR 290 — ETR Details — Alarm graph popup view. Please refer to the ETR 290 — ETR Details section of this user’s manual for a comprehensive description of this view. ETR Details The ETR details subview shows the same alarm overview as the ETR 290 —... - Page 137 Optimised IP-SPTS CMTS downlink Analog carrier These predefined thresholds may be used when defining a monitoring configuration, but it is a good idea to create editable copies of these threshold templates and use these copies rather than the originals. Doing so will allow fine-tuning of parameters later on. There are two different ways of creating user-defined thresholds.
- Page 138 The ETR threshold template has the following settings: ETR Thresholds — Parameters: Name: A text field with the name of the ETR threshold template Description: Text field that should contain a meaningful description of the threshold Analysing Mode: The mode of table analysis. DVB or ATSC may be selected. Error timeout (s): The number of seconds after an error has occurred before the alarm is cleared as long as no new alarms are generated.
- Page 139 Tuning duration (s): The time (in seconds) the probe will stay tuned to a frequency/multicast during the round-robin loop.For setting the tuning duration, use the following expression:max_table_rep*2+10 Use the maximum table repetition, multiply by 2 and then add 10 seconds. E.g. with TDT table repetition set to 30 seconds, use 30*2+10=70 seconds tuning duration.
- Page 140 PAT – Allowed When this field is left blank all TS IDs are considered valid. If one or more Transport Stream IDs: TS IDs are specified (separated by commas or as a range) only these IDs are considered valid, and any other TS ID will trigger an alarm. Example of a valid field: ‘100-120, 300,320’...
- Page 141 PCR Accuracy – Maximum The maximum allowed PCR jitter for PCR_OJ measurements. PCR_OJ jitter (ns): PCR_OJ measurement does not apply to IP streams. Default: 500 ns PTS: Enable or disable alarming of Presentation Time Stamp errors PTS – Maximum The maximum allowed interval between the reception of two PTS interval (ms): values.
- Page 142 NIT – Satellite If set to ‘Required’ an alarm will be generated if a DVB-S2 Satellite descriptor (DVB-S2): descriptor is not present in the NIT for the monitored frequency. Similarly if set to ‘Not allowed’, an alarm will be generated if the DVB-S2 Satellite descriptor is present.
- Page 143 EIT: Enable or disable alarming of Event Information Table errors. Only relevant when DVB mode is selected. EIT – Maximum The maximum allowed section repetition interval for the EIT Actual table. interval Actual (ms): Default: 2 000 ms EIT – Minimum The minimum allowed section gap interval for the EIT tables.
- Page 144 MGT – Maximum The maximum allowed section repetition interval for the MGT table. interval (ms): Default: 150ms VCT: Enable or disable alarming of Virtual Channel Table errors. Only relevant when ATSC mode is selected. Require TVCT: Require presence of the Terrestrial Virtual Channel Table. Require CVCT: Require presence of the Cable Virtual Channel Table.
- Page 145 ETT – Maximum The maximum allowed section repetition interval for the ATSC ETT–1 to interval ETT–1 to ETT–3 tables. Default: 5000ms ETT–3 (ms): ETT – Maximum The maximum allowed section repetition interval for the ATSC ETT–4 to interval ETT–4 to ETT–127 tables.
- Page 146 PID checks: Enable or disable alarming of PID presence errors, scrambling/clear requirements and PID type checks. The checks are set in the PID threshold template. Service minimum Enable or disable alarming of service minimum bitrate errors. Require- bitrate checks: ments are specified in the service threshold template associated with the stream.
- Page 147 Gold TS check – Do verification of the SDT actual table against the stored reference SDT Verify SDT actual table: actual table. Gold TS check – Do verification of the SDT other tables against the stored reference SDT Verify SDT other tables: other tables.
-
Page 148: Etr 290 - Pid Thresh
6.9.13 ETR 290 — PID thresh. The PID thresholds make it possible to define detailed conditions for alarm triggering on a PID or PID type basis. There is one predefined PID threshold template that cannot be edited by the operator: ‘Default’. - Page 149 The PID threshold template has the following settings: VB3xx 10G Probe User’s Manual version 5.3...
- Page 150 Edit PID Threshold: Name: The name of the PID threshold template Description: Text field that should contain a meaningful description of the threshold template PID Threshold Parameters: Selection: The user selects if the requirements should apply for a specific PID or for all PIDs of a specified type.
-
Page 151: Etr 290 - Service Thresh
6.9.14 ETR 290 — Service thresh. The Service thresholds make it possible to define detailed conditions for alarm triggering on a per- service basis. There is one predefined service threshold template that cannot be edited by the operator: Default. The Default service threshold template contains no service definitions and will therefore not alter alarming for any service. - Page 152 Edit Service Threshold Name: A text string that identifies the service threshold group Description: Text field that should contain a meaningful description of the threshold Service Threshold Parameters Selection: The user selects if the requirements should apply for a specific service ID, for all services of a specified type or for a service with a specified service name.
- Page 153 Report name: It is possible to define the service name that should be used for alarm traps and for alarm reporting to the VideoBRIDGE Controller. This can be convenient to be able to track a service that changes name (as signalled in PSI/SI) in the signal chain, when services within an MPTS are unnamed (no service names in the SDT) or when services should be recognized by the VideoBRIDGE Controller under a different name...
-
Page 154: Etr 290 - Gold Ts Thresholds
appears in a stream. This is done by creating a threshold template listing the service IDs that are allowed to be present in a stream, and associating it to the stream. A complementary ETR threshold template should be created, that has the ‘Only allow services listed in service template’ check enabled. This ETR threshold template should also be associated with the stream. - Page 155 There are two different ways of creating a Gold TS reference template: Creating a template for the currently tuned stream on a specific input Creating a template for all streams on a specific input (or all inputs) When creating a template for a specific stream the table set is saved immediately. It is therefore recommended that the ETR tuning is locked to this stream to avoid the round-robin operation from tuning to a new frequency just before the table set is stored.
- Page 156 The reference check needs to be set to alarm if the Gold TS reference checking are to be performed. The settings are as follows: Also check version By default the version number and the original CRC of the tables are not number and CRC checked.
- Page 157 Verify SDT actual table When enabled the SDT table for the current stream will be checked. This allows the operator to catch changes is service and operator names, service types and the various descriptors, both DVB defined and private descriptors Verify SDT other tables When enabled the SDT tables for the other streams will be checked.
- Page 158 All the different tables and sections monitored are listed here. If there have been any changes to the tables the check will turn red and alarms be sent. When the ETR engine is tuned to a stream it is possible to compare the tables for this stream with the stored reference tables by clicking on the entry in the list.
- Page 159 If the tables are inspected and the change found to be OK the operator can then go back to ETR 290 — Gold TS thr. and update the stored table set to the new version. VB3xx 10G Probe User’s Manual version 5.3...
-
Page 160: Setup
6.10 Setup 6.10.1 Setup — Params The Setup — Params view contains the following settings: Various Probe name: Each probe can be assigned a user defined name. The name is shown in the Main — Summary view, which is the probe default page, as well as in the browser’s title line. - Page 161 Treat Ethernet events as alarms: When enabled each event is treated as an alarm that is active for 5 seconds. This may be useful when reporting to external systems that do not support events but only active or cleared alarms. This setting affects the local alarm list and SNMP traps. Network settings Promiscuous network mode: The probe will only be able to detect additional multicasts if the...
-
Page 162: Setup
SNMP Community string: The probe SNMP community string can be changed. Trap destination 1–3: SNMP traps will be sent to the specified destinations. Set to 0.0.0.0 to disable SNMP trap transmission. 6.10.2 Setup — Pages The Setup — Pages view allows names to be associated with different pages. Individual multicasts can be assigned to different pages in the Multicasts —... -
Page 163: Setup - Time
The Setup — Colors view allows the user to define colors that should be recognized if a color-freeze condition should occur. A mono-colored freeze frame condition may in some cases indicate what equipment is failing, resulting in the color-freeze. A freeze color is defined by clicking the Add new color button and assigning an RGB value to a name. A maximum of four colors may be defined. -
Page 164: Setup - Ethernet
6.10.5 Setup — Ethernet The Setup — Ethernet menu defines the Ethernet setup parameters for the management interface (eth1) and the data/video interface (SFP+B/eth0). If the second data interface is license-enabled then it will show up as SFP+A/eth2. The link statuses for the interfaces are updated live to reflect the current settings. -
Page 165: Setup - Ethernet - Ipv6 Settings
IP settings – management (eth1) Enable DHCP: If enabled, IP address (eth1), netmask (eth1) and gateway are updated by a remote DHCP server next time the probe boots. IPv4 address: IPv4 address of the data/video interface IPv4 netmask: IPv4 netmask of data/video interface Enable management: If enabled a web server will be started on eth2 next time the probe boots. - Page 166 IPv6 Gateway: Required to allow clients with an address outside the probe subnets to access the probe (HTTP, FTP, SSH, TELNET, SNMP). It is also required for the probe to access an NTP server or DNS server with IPv6 address outside the probe’s subnets.
-
Page 167: Example 1 - Separate Management Ipv4
6.10.5.2 Example 1 – Separate Management IPv4 This model is useful if the management traffic is to be separated from the data/video traffic by utilizing two completely disjointed networks. In this example the management subnet is defined as 192.168.0.0/16 and the data/video subnet is 10.0.30.0/24. Parameter Management Data/video... -
Page 168: Example 3 - Mixed Mode Ipv4
6.10.6 Setup — VLANs The VB330 probe supports a large number of VLAN interfaces. The VLAN interfaces can be associated with any of the physical interfaces. Once enabled, these VLAN interfaces can be used for routing and joining of multicasts. -
Page 169: Setup - Vbc
The VideoBRIDGE Controller can automatically detect the 10G Probe and add it to the VBC equipment list, provided that the auto-detect functionality is enabled and the VBC server address is known to the VB330. Note that the network must be transparent to traffic between the VBC server and 10G Probes for auto-detection to work. -
Page 170: Setup - Login
By default, there is no access control and all users have access to all features. Access control can be enabled for the VB330, restricting users to read-only access until they log in. Any user can enable access control, but only users who are logged in can disable it or change the password. -
Page 171: Setup - Etr
6.10.9 Setup — ETR The Setup — ETR view allows the user to select miscellaneous ETR handling modes. Note that settings that apply to optional interface cards are not relevant for the VB330. 6.10.9.1 Parsing rules for private descriptors Probe recognition of a number of selected private descriptors may be defined by the user: 129 (0x81): ‘Disabled’... -
Page 172: Etr 290 Tuning Control
231 (0xe7): ‘Disabled’ or ‘private cable delivery system descriptor’ 233 (0xe9): ‘Disabled’ or ‘ip_delivery_system_descriptor’ The default value for private descriptors is ‘Disabled’. To change this value, select a new descriptor interpretation from the drop-down menu and click the Apply changes button. 6.10.9.2 ETR 290 tuning control By default authorized users will be allowed to lock the ETR 290 analysis to one stream for an infinite length of time and unauthorized users will not be allowed to lock the analysis. -
Page 173: Inactive Inputs
It is possible to extend EIT analysis to include EIT schedule, however this is not recommended except for ad-hoc troubleshooting, as analysis of EIT schedule can be extremely demanding on probe processing resources. If full-time monitoring of all EIT information is required, dedicated probes should be used for this task. - Page 174 The reason for using error second thresholds is to avoid alarms that toggle on and off, which for a large monitoring system might otherwise lead to an unintelligible user interface. The VBC thresholds will allow masking of minor error incidences thus resulting in a control system GUI that presents persistent alarms only.
- Page 175 VBC thresholds Name: The name of the VBC threshold template No signal: Number of seconds with ‘No signal’ RTP error: Number of seconds with RTP packet drops. This measurement will be zero unless the stream is encapsulated in RTP headers MLR error: Number of seconds with packet drops in the TS layer (seconds when media loss rate is non-zero).
-
Page 176: Setup - Scheduling
Number of seconds the bitrate can fall below the error-threshold before a VBC alarm is generated ETR Pri 1 errors: ETR error seconds are not relevant for the VB330 10G Probe ETR Pri 2 errors: ETR error seconds are not relevant for the VB330 10G Probe... -
Page 177: Setup - Routing
When a scheduling template has been modified, click the Apply changes button. Defined scheduling templates become available as selections in the ETR 290 — PID thresh. — Edit and ETR 290 — Service thresh. — Edit views. 6.10.12 Setup — Routing The Setup —... -
Page 178: Setup - Security
Routing setup Default This setting determines the default interface, and is configured through the Setup — Ethernet view. IP monitoring Defines the interface to use for the multicasts specified in the Multicasts — Streams view. The available interfaces depend on the probe license. Interface to use for OTT channels specified in the OTT —... - Page 179 The default user name and password to enter this view is admin and elvis. The password is changed by entering a new password and clicking the Apply changes button. This password also applies for the admin user when logging in over USB or ssh as described in chapter 4.8.2, as well as for software upload using ftp as described in appendix E.
-
Page 180: Data
XML document will be applied. The configuration, stream list and thresholds exports can all be imported. Configuration files generated by a probe can be imported by the VB330. Multicast stream lists, OTT channel lists and scheduling information can also be exported to and imported from the VB7880 Advanced Content Extractor. -
Page 181: Data - Software
The software section allows the 10G Probe to be upgraded to a newer software version. Select the .tea file from the local PC and click Go! to copy the software to the VB330. When the upload is complete, clicking the Save flash button will store the new software to flash. Note that the probe must not be powered down during the flash save process. -
Page 182: Data - Table Descriptors
It is possible to upload parser files to the probe adding support for private descriptors. Private descriptors should be enabled (in the Setup — ETR view). Contact Sencore for more information about private descriptors. VB3xx 10G Probe User’s Manual version 5.3... -
Page 183: Data - Eii
6.11.4 Data — Eii The External integration interface (Eii) allows inclusion of Sencore VideoBRIDGE equipment into 3rd party NMS systems. In order to facilitate integration the Data — Eii view allows export of XML files containing the data typically being requested by an NMS system via the regular Eii interface. -
Page 184: Data - Storage (Flash Option)
6.11.5 Data — Storage (FLASH option) The FLASH option allows a 32GB flash card to be used for storing recordings offline. RDP recordings are automatically stored, and PCAP recordings can also be stored in flash. VB3xx 10G Probe User’s Manual version 5.3... -
Page 185: About
6.12 About 6.12.1 About — Release info This view shows the software version, the software build date and the hardware type of the 10G Probe. VB3xx 10G Probe User’s Manual version 5.3... -
Page 186: About - License
When entering a demo license key will start a trial period of 30 days during which the features defined in the demo license are available. Once the trial period ends, the VB330 will revert back to the previous license. The time remaining is indicated in the License details page. -
Page 187: About - Technologies
6.12.3 About — Technologies The Technologies view lists some of the technologies available in the Sencore VideoBRIDGE product family. 6.12.4 About — Credits This view shows information about the software included with the 10G Probe. VB3xx 10G Probe User’s Manual version 5.3... -
Page 188: A Appendix: Vb330 Versus Vbc Alarms
A Appendix: VB330 Versus VBC Alarms The VB330 10G Probe alarms are independent of the VideoBRIDGE Controller alarms. The 10G Probe has been designed to yield instantaneous alarms based on the current measurements. This typically results in lots of short-lived alarms that would be “too much” for the VBC to report, as the VBC may control a large number of 10G Probes. -
Page 189: B Appendix: Monitoring Practices
B Appendix: Monitoring Practices This Appendix summarizes a few useful monitoring practices. B.1 RTP Monitoring When running video inside an RTP wrapper it is possible to exactly deduce the number of dropped IP frames due to network issues. This is possible as a result of the 16-bit sequence counter inside the RTP header. - Page 190 Imagine the following MPEG-2 Transport Stream being generated by an encoder. The TS contains two PIDs (50 and 51) and the Continuity Counter (CC) values are continuous for each PID since there are no packets missing. PID: 50 PID: 51 PID: 50 PID: 51 PID: 50...
-
Page 191: Strategy For Mediawindow Analysis
B.3 Strategy for MediaWindow Analysis This section provides further insight into MediaWindow analysis and suggests how the Ethernet threshold settings can be configured to maximize the usefulness of the MediaWindow graphs and alarms. The MLR value is always calculated using the continuity counter inside the transport stream packets. Since the continuity counter is expected to increase by one for each packet of the same PID it is possible to detect missing TS packets by noting gaps in the continuity counters. -
Page 192: Iat Before And After Router
B.3.1 IAT Before and After Router Packet-loss that occurs before or inside a router will usually not be visible since the queuing mechanism at the outgoing interface of the router will send out packets in an orderly fashion. If however the packet-loss did occur after the router (due to line noise for example) thus affect the timing between two neighboring packets –... -
Page 193: Identifying Udp Packet Loss
For VBR streams a similar packet-loss will not necessarily affect the IAT graph even if the time between two neighboring packets doubles. The pink line represents the IAT and MLR value measured for the missing packet. B.3.2 Identifying UDP Packet Loss This discussion does not apply to streams with TS/RTP mapping since in that case identifying UDP packet loss is straight forward. -
Page 194: Multicast Thresholds
As we have seen, there is no sure way to distinguish between UDP packet-loss and loss in the underlying TS packets. One way to deal with the situation is to have a probe doing zero readings close to the signal source before the network can introduce UDP packet loss. -
Page 195: C Appendix: Ott Profile Health
C Appendix: OTT Profile Health C.1 OTT Profile Health Bar The profile health bar displayed at channel level shows an overview of current status for individual channel profiles. Different colors indicate status: Green: OK Yellow: Warning Orange: Error Red: Major Black: Fatal All enabled alarms may affect the profile health bar, and alarm severities can be assigned to each alarm in the Alarms —... -
Page 196: Ott Profile Health Timeline
C.2 OTT Profile Health Timeline The OTT profile health timeline shows information about channel bitrate and channel alarm status for the last two hours, with a time resolution of one minute. Green parts of the timeline indicate profile download time versus chunk length. The graph is scaled so that 100% indicates a chunk download time identical to chunk length (in seconds), chunk length being signalled in the profile manifest. -
Page 197: D Appendix: Software Maintenance
For an overview of software maintenance periods for multiple units, please refer to the Equipment view on the VideoBRIDGE Controller server. Use the Data — Software view to update the VB330 software, please refer to chapter 6.11.2. VB3xx 10G Probe User’s Manual version 5.3... -
Page 198: E Appendix: Software Upload
E Appendix: Software Upload The process of performing a software upload to the probe involves the following steps: 1. Obtain the software image. 2. Export and save the probe configuration. 3. Delete any existing probe stream recordings. 4. Transfer the image to the probe using the software upload functionality in the Data — Software view or by using ftp, and save the image to flash. -
Page 199: Transfer The Image To The Probe And Save To Flash
E.4 Transfer the image to the probe and save to flash Using the software upload functionality in the Data view From the Data — Software view select the software image file to be uploaded and click the Go! button. When the software has been successfully transferred to the probe click the Save flash button and confirm. - Page 200 220 bftpd 4.4 at 10.0.20.101 ready. 503 USER expected. User (10.0.20.101:(none)): admin 331 Password please. Password: elvis 230 User logged in. ftp> binary 200 Transfer type changed to BINARY ftp> put vb330-5.2.0-10.tea ftp> VB3xx 10G Probe User’s Manual version 5.3...
-
Page 201: Wait While The Software Is Being Saved
Probes that are unable to execute the user program (usually caused by interrupting the save-to-flash process described above) can still be upgraded. Contact Sencore for details. To verify that the probe is unable to start the user program, connect the USB cable as explained in section 4.8.2 and reboot the probe. - Page 202 If the web interface does not appear to work correctly straight after upgrading the probe it may be because the web browser is using files that are cached. Files may be cached for up to one hour in the web browser. To fix the issue, clear the cache manually: Google Chrome: Settings –...
- Page 203 F Appendix: Restoring probe factory defaults It is possible to reset the probe to factory settings, erasing all information about the probe configuration and alarm history. Note that after factory reset the management IP address and subnet mask are set to default settings, and it will be necessary to manually set the IP address using one of the methods described in section 4.8.
Need help?
Do you have a question about the VB330 and is the answer not in the manual?
Questions and answers