Table of Contents
Advertisement
Quick Links
Advertisement
Table of Contents

Related Manuals for Sencore SP395


Summary of Contents for Sencore SP395
- Page 1 SP395 SoundPro Audio Integrator Form7492 Operation Manual SP395 SoundPro Audio Integrator Operation Manual (Firmware version 1.32) 3200 Sencore Drive, Sioux Falls, SD 57107 http://www.sencore.com mailto:sales@sencore.com 1.800.736.2673 or 1.605.339.0100...
- Page 2 Sencore reserves the right to make changes in specifications and other information contained in this publication without prior notice, and the reader should in all cases consult Sencore to determine whether any such changes have been made. This manual may not be reproduced, and is intended for the exclusive use of Sencore users.
- Page 3 SP395 SoundPro Audio Integrator Form7492 Operation Manual SP395 SoundPro Audio Integrator Operation Manual (Firmware version 1.32) 3200 Sencore Drive, Sioux Falls, SD 57107...
-
Page 4: Table Of Contents
Front Panel Control Descriptions ..................9 Right Side Panel – Input Description................... 9 Left Side Panel – Output Description ................10 SP395 Audio Integrator Accessories ................. 11 Firmware Add-on Test Functions ..................13 OPERATION......................... 14 Power ON/OFF Switch ......................14 Power Input Jack........................ - Page 5 TerraLink Software: Real-Time Computer Interface............. 104 APPENDIX A dB SPL Scale ........................105 APPENDIX B ANSI Weighting Curves......................106 APPENDIX C ANSI Balanced Noise Criterion Curves................107 APPENDIX D Serial Protocol for Accessing SP395 Memories..............108 WARRANTY AND SERVICE INFORMATION ..................inside back cover...
-
Page 6: Description
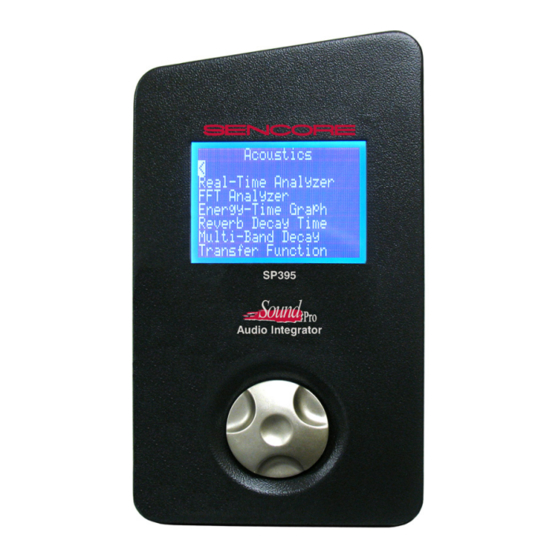
Operation Manual DESCRIPTION Introduction The Sencore SP395 SoundPro Audio Integrator is a quality, high-end audio and acoustic analyzer designed for audio professionals, commercial audio installers, and audio system engineers. Its audio analyzing functions make it attractive for virtually anyone involved with audio acoustics or audio systems testing. - Page 7 SP395 SoundPro Audio Integrator Form7492 Operation Manual SP295 generator or an external sound pickup such as a handclap. Valuable in setting time delays from speaker to listening positions and analyzing sound decay for reflections or decay time. Reverb Decay Time (RT60): Measures and computes reverb decay time or the time it •...
- Page 8 SP395 SoundPro Audio Integrator Form7492 Operation Manual Impedance Sweep: Plots the impedance of a load by sweeping the generator through its • frequency range and graphing the impedance at each 1/12 octave step. Cable Tester: Provides a cable attenuation test at 1 kHz and 20 kHz, and a polarity test to •...
-
Page 9: Specifications
SP395 SoundPro Audio Integrator Form7492 Operation Manual Specifications SoundCore™ Module Sound Level Meter (SLM): Measures ambient sound energy levels at microphone input Displays true RMS SPL Averaging: Meets ANSI S1.4 Slow Fast Impulse Peak Avg – Equal time-averaged SPL Sound Study Graph (SSG): 1 minute to 24 hour continuous recorded SPL measurement “Strip Chart Recorder”... - Page 10 SP395 SoundPro Audio Integrator Form7492 Operation Manual Energy-Time Graph (ETG): Graphs impulse sound decay energy vs. time or distance Identifies arrival time of direct sound and audio reflections Displayed in mS (milliseconds), ft (feet), m (meters) Decay time ranges: From 0-15 mS to 0-7680 mS...
- Page 11 SP395 SoundPro Audio Integrator Form7492 Operation Manual TechBench™ Module Level Meter: Stereo level meter reads in dBu, dBv, Vp-p, Vrms, or dBr (reference) Frequency Range: 10 Hz to 22 kHz Auto-level ranging. Level Range: -120 dBu to +40 dBu Level Accuracy (–85 dBu to +40 dBu): ±0.2 dB, 10 Hz to 22 kHz Typical: ±0.01 dB, 100 Hz to 16 kHz;...
- Page 12 SP395 SoundPro Audio Integrator Form7492 Operation Manual Speech Intelligibility Module: (RaSTI and STI-PA test waveforms included on CD) ALCONS: Computes Percent Apparent Loss of Consonants RaSTI: Calculates Rapid Speech Transmission Index STI-PA: Computes Speech Transmission Index using STI-PA method (STI for Public Address)
- Page 13 SP395 SoundPro Audio Integrator Form7492 Operation Manual Standards Sound Level Meter: ANSI S1.4-1983 (ASA 47-1983) Leq: ANSI S1.43-1997 Dosimeter: ANSI S1.25-99 (ASA 98-1991) Class 2 Digital Filters: ANSI S1.11-1986 1/1, 1/3 octave digital filters All filters, weighting networks, response rates, and algorithms meet or exceed ANSI...
-
Page 14: Front Panel Control Descriptions
May have 48 Volt Phantom Power switched to jack by instrument. 3. Power Adapter Input: Powers the instrument and charges the internal rechargeable battery. Use a Sencore approved adapter nominal 9V @ min 800 mA. (Center pin positive) 4. Power Switch: Turns the instrument power on or off. Down is Off. -
Page 15: Left Side Panel - Output Description
SP395 SoundPro Audio Integrator Form7492 Operation Manual Left Side Panel – Output Description 1. RS232 Computer Interface Connector: Serial DE-9 connector. Interfaces instrument to computer for use with automation software and for the purpose of updating unit firmware to factory changes. -
Page 16: Sp395 Audio Integrator Accessories
SP395 SoundPro Audio Integrator Form7492 Operation Manual SP395 Audio Integrator Accessories Sencore Description Photo Part #s TerraLink Viewer Software /Speech Intelligibility Audio CD provides TerraLink – viewer only capability – along 133G527 with the audio CD files needed for the STIPA and RASTI speech intelligibility tests. - Page 17 39G1171 Impedance Meter and Impedance Sweep test functions. supplied AC Power Adapter/ Charger plugs into the SP395 to charge the battery or to 60G80 provide AC operation. supplied Soft Carry Case padded carrying case to transport unit; includes extra storage CC309 capacity for supplied accessories.
-
Page 18: Firmware Add-On Test Functions
Audio Integrator menu that the function appears in. To purchase an unlock code for a firmware module, contact Sencore. For instructions on how to unlock a firmware module, see the Setup & Calibration section of this manual. -
Page 19: Operation
The Power Input Jack is located in the center of the right side panel. The DC Input Jack requires the input of a DC voltage to power the instrument and charge the internal battery. The SP395 requires a 9-12v DC power adapter, regulated or unregulated, rated at a minimum of 800ma. The input connector is a 2.1mm coaxial power connector with the positive polarity voltage on the... -
Page 20: Installing/Removing Battery
SP395 SoundPro Audio Integrator Form7492 Operation Manual Installing / Removing Battery The battery can be removed for replacement. The battery is installed in a small compartment in the bottom rear of the Audio Integrator. To remove the battery you must open the battery door or cover plate. -
Page 21: User Interface - Control Knob
SP395 SoundPro Audio Integrator Form7492 Operation Manual User Interface – Control Knob All the Audio Integrator operations and user selections are performed using the front panel control knob. This control is either rotated or momentarily pressed (clicking) the control knob. -
Page 22: Menu Overview
SP395 SoundPro Audio Integrator Form7492 Operation Manual Menu Overview All user selections to configure the Audio Integrator are performed with indications in the display screen. The Audio Integrator includes a main menu with eight categories of tests in which to choose from. Choosing a category in the main screen results in a submenu. The submenu lists all the tests available in that category. -
Page 23: Inputs & Outputs
SP395 SoundPro Audio Integrator Form7492 Operation Manual 4. TDA Submenu: Appears when the TDA selection is made in the main menu. This submenu shows the TDA test functions available on the Audio Integrator. Note: The TDA tests are optional firmware add-on test functions. -
Page 24: Audio Outputs
For the acoustics test functions, a microphone is normally connected, and for the TechBench tests, a line level (or lower) electrical audio signal is anticipated by the SP395. The acoustics functions, which expect input from a microphone, use the microphone SPL calibration that is stored in the Utilities Calibration section. -
Page 25: Input Gain Control - Preamplifiers
SP395 SoundPro Audio Integrator Form7492 Operation Manual The audio output from the headphone jack and speaker is routed through separate output monitoring circuits within the Integrator. Audio to the headphone or speaker is independently switched on or off in the monitor part of the menu screen. The audio level output to the headphone and speaker is controlled in the monitor part of the menu screen. -
Page 26: Menu Toolbars
SP395. It is important that you understand the use of the toolbars to properly operate the SP395. Individual items which can be selected and changed are referred to as fields in this manual. -
Page 27: Bottom Tool Bar
SP395 SoundPro Audio Integrator Form7492 Operation Manual 7. Left Input Gain There are 12 selectable input gain settings. Click and turn to select the gain for this channel. A blinking value or digits indicate clipping and the need to reduce the gain selection number. -
Page 28: Memory Control
Memory Control Some test functions support saving measurement data to internal, non-volatile memory. The SP395 provides memory storage of RTA, FFT, ETG, Dosimeter, Sound Study Graphs, Amplitude Sweep and Impedance Sweep functions. These functions use the four memory control icons, in the center of the bottom toolbar. Note that a memory must be empty (cleared) before measurement data can be stored into it. -
Page 29: Spl
Pressure Level (SPL). SPL typically uses a microphone as an input. The standard input for the SPL tests in the left (L) input. The SPL tests that are available on the SP395 include: Sound Level Meter: Measures sound pressure level in dB. - Page 30 1. Connect a test signal to the audio system input. SPL tests require a constant-level signal, such as a single-frequency test tone or wide-band pink noise. To use the SP395 as the signal source, connect a cable from an output connector to the desired audio system Caution input.
-
Page 31: Leq
SP395 SoundPro Audio Integrator Form7492 Operation Manual Any of nine ANSI Class 1 octave-band filters – 31, 63, 125, 250, 500, 1000, 2000, • 4000, and 8000Hz. Any of 25 ANSI Class 1 1/3 octave-band filters. • 5. If you are using the Audio Integrator as the signal source for the audio system: Turn the generator on by clicking the "on/off"... -
Page 32: Dosimeter
Manual and start and stop the LEQ test yourself. 4. Click Start. After a 2 second delay, the SP395 starts averaging the incoming sound. It stops automatically at the end of the selected time, or, if you are in Manual mode, continues to run until you click Reset. - Page 33 SP395 SoundPro Audio Integrator Form7492 Operation Manual the U.S. military, causes the reported Dose to double for every 4 dB increase in the time- weighted average sound energy. The OSHA (and MSHA) 5 dB standard causes the reported Dose to double for every 5 dB increase in the time-weighted average sound energy.
-
Page 34: Sound Study Graph
The time can range from 1 minute to 24 hours. When the function runs, it divides the time period into 120 equal divisions, sampling the sound level at each period. The SP395 computes either the average or peak SPL for that period, and draws a bar on the graph. This continues until the total time for the test has expired. - Page 35 SP395 SoundPro Audio Integrator Form7492 Operation Manual specified, the sound study graph automatically performs multiple sound studies or the specified period and saves each to memory. 5. Weighting - Any of 43 weighting filters are available, including unweighted (Flat); A- weighted;...
-
Page 36: Acoustics
The RTA function includes an ANSI X curve weighting network for motion picture theater setup is included. The SP395 RTA function uses ANSI Class 1 filters to separate the spectrum of the audio signal at the microphone or left line input into octave band or 1/3 octave band segments. - Page 37 SP395 SoundPro Audio Integrator Form7492 Operation Manual The RTA measurement test screen RTA Display and Controls 1. Test Function - Identifies the test function (RTA) 2. Full Bandwidth – Indicates all octave bands are graphed in the RTA. This field is not selectable.
- Page 38 5. Select the desired weighting. Use Flat (no weighting) for most applications. 6. Turn on the pink noise. If you are using the SP395 as the signal source, turn on both the RTA function and the generator. ("Gen on" field).
- Page 39 SP395 SoundPro Audio Integrator Form7492 Operation Manual Storing an RTA graph to memory: Real-Time Analyzer graphs can be stored in any of the 40 non-volatile memories, using the memory control icons in the center of the bottom toolbar. Use the memory number field to select a memory number.
-
Page 40: Fft Analyzer
Operation Manual FFT Analyzer The SP395 FFT Analyzer function processes the audio received at the microphone or left line input through three cascaded FFT stages that resolve the audio spectrum into octave, 1/3, 1/6, or 1/12 octave bands. Compared to the filter-based RTA (above), this function is slower to update, but has much finer frequency resolution. - Page 41 2. (Optional) Connect a constant-level pink noise signal to the audio system. To use the SP395 as a pink noise signal source, connect a cable from an SP395 output connector to the desired input on the audio system. There will not be an output from the system until the FFT and signal generator are turned on from the FFT display.
- Page 42 5. Select the desired weighting. Use Flat (no weighting) for most applications. 6. Turn on the pink noise. If you are using the SP395 as the signal source, turn on both the FFT function and the generator. ("Gen on" field).
-
Page 43: Energy Time Graph
An energy-time graph shows time relations between sounds. The SP395 Energy-Time Graph (ETG) function applies an exciting pulse through an external amplifier and speaker, and displays direct sound from the speaker, plus the energy decay of the sound reaching the microphone. - Page 44 This trigger pulse is graphed at time/distance 0, at the far left side of the graph. Two trigger modes are provided: Int - Internal trigger: Use this mode when the SP395’s generator output is connected • to an amplified speaker. The graph updates repeatedly with each new output pulse.
- Page 45 Producing an Energy-Time Graph (follow these setup steps for all ETG applications.) 1. Trigger Mode. Select “Int” (Internal) to set the SP395 to generate its own excitation pulse. Plug any of the SP395 audio output into an amplifier and speaker and turn the level down at the amplifier! 2.
- Page 46 (if you are using Internal trigger mode) to obtain the highest possible signal reading without overloading the SP395 or creating excessive distortion in the speaker. 10. Turn on the test. Be sure the amplifier volume is set to minimum before turning on the ETG test.
- Page 47 SP395 SoundPro Audio Integrator Form7492 Operation Manual To measure Initial Time Delay Gap (ITDG) ITDG is the time between the direct sound and the first lateral sound reflection that is within 10 dB of the direct sound. This time clues the brain as to the room size - longer ITDGs mentally equate to larger spaces, while too short ITDGs cause early reflection problems.
-
Page 48: Reverb Decay Time
The SP395 Reverb Decay Time function works by first measuring the room's ambient noise level, then the sound level with the test pink noise is applied. The difference in levels is the decay range (at least 26 dB is required for the test to continue). - Page 49 4. Captured Max Noise Level – This is the maximum sound energy in the room with the pink noise test signal applied. Adjust the amplifier's volume and/or SP395 generator output to increase the sound level to approximately 75-85 dB. At this level the Max Noise reading should be at least 26 dB higher than the Min Room level reading (number in the Decay Range field).
- Page 50 Reverb Decay Time Operation 1. Position the SP395 microphone in the center of the listening area. 2. Connect any SP395 line output into an amplifier and speaker. Turn the level down at the amplifier! 3. Select the Reverb Decay Time function and select A-weighting. A-weighting rolls off most of the effects of low frequency room modes and provides a better indication of delay time.
- Page 51 75-85 dB. This should produce a Decay Range reading of at least 26 dB (30dB or greater is recommended for a more accurate reading). You want the sound as loud as possible, without damaging your system or overloading the SP395 8. Run RT60 - Click the Test Control field to display "Run RT60." The pink noise generator will cycle on and off as readings are taken.
-
Page 52: Multi-Band Decay
Min: Sets Minimum Room Noise – Highlight the Test Control field and select • "Min." The SP395 reads the average background noise level in the room during this step. If this level is greater than 50 dB, you should attempt to decrease the ambient... - Page 53 RT60 time field shows the extrapolated time for the sound to decay in the room, if a full 60dB decay range were available. 7. Octave Bands – lists the octave bands that are being measured by the SP395 as part of the multi-band RT60 analysis.
- Page 54 SP395 SoundPro Audio Integrator Form7492 Operation Manual This should produce a Decay Range reading of at least 26 dB. The greater the decay range the more accurate is the extrapolated RT60 measurement. You may find that low frequency room noise does not make it possible to achieve a 26 dB range in the lowest octave bands.
-
Page 55: Tda - Time Delay Analysis
In the SP395, 1/12 octave data points are selected for the TDA graphs. As the generator output sine wave is being swept, the input band-pass filter is also being swept, delayed by Ts. As each 1/12 octave boundary is reached, the RMS energy accumulated since the last boundary is recorded;... - Page 56 The amount of reduction depends on the steepness of the band-pass filter and the speed of the sweep. The filter in the SP395 has variable Q (steepness), and can be set from a Q of 6 to a Q of 150. More information about filter Q and setting up the TDA function will be detailed below.
- Page 57 FFT transfer function. These other methods require very accurate Ts measurements. With the SP395 TDA method, an incorrect Ts time simply results in a graph that is shifted slightly on the frequency axis.
- Page 58 However, more information is shown with a higher Q filter. Note also that the SP395 TDA function uses a constant-Q filter. Other TDA platforms work with the equivalent of a constant-frequency filter. Constant Q can result in fewer problems with comb-filtering.
- Page 59 SP395 SoundPro Audio Integrator Form7492 Operation Manual Time Delay Analysis - TDA Run Screen The TDA function includes a Setup menu screen and a Run menu screen. When you enter the TDA function, the Setup screen is displayed first automatically. After you have made the proper TDA setup, switch to the Run screen.
- Page 60 How to Use TDA to Measure Speaker Response 1. Connect the output. Connect the output of the SP395 to an amplifier and to the speaker that you wish to test. It is advisable to have a gain control at or before the amplifier, since the only other way to change the speaker level during the TDA testing is to switch to the signal generator function and set the level from there.
- Page 61 How to Use TDA to Measure Microphone Response 1. Connect the output. Connect the output of the SP395 to an amplifier and to the speaker. It is advisable to have a gain control at or before the amplifier, since the only other way to control the speaker level is to switch to the signal generator function and set the level from there.
-
Page 62: Noise Tools
= Correction constant, typically 1.5%. In operation, an amplifier and loudspeaker are positioned at the “speaker” position, and the SP395 microphone is positioned at the “listener” position. The % ALCONS function measures RT60 in a speech octave band, and computes the % ALCONS. - Page 63 Adjust the amplifier's volume and/or SP395 generator output to increase the sound level to 80 – 90 dB. It is desirable to get the noise level considerably higher than the Min room level dB for improved decay range and test accuracy.
- Page 64 8. Mode. Now, move to the “Hld” field, and change this to “Min”. Allow several seconds for the SP395 to measure the noise floor in the room in the octave band selected. 9. Generator Level. Click the “Min” field to “Max”. The generator is now turned on.
-
Page 65: Rasti
SP395 SoundPro Audio Integrator Form7492 Operation Manual Note: You must have at least 30dB of range available to compute the RT60 and ALCON % for the room. 10. Run test. Change the “Max” field to “Run” to begin the test. The Critical Distance is computed, and the correct %ALCONS formula is selected based on whether the microphone is within the Critical Distance. - Page 66 The SP395 analyzes the results of a standard RASTI test signal, which is supplied on a CD. By using a separate test signal on a CD, the test signal can be routed to a system that has a number of speakers such as an emergency evacuation system, and the SP395 can be carried around to measure each speaker individually.
- Page 67 1. Apply a test signal to the system. Connect an amplified speaker to a CD player and insert the RASTI test signal CD. The location of the speaker is the “speaker” location. 2. Microphone - Set up the SP395 microphone at the “listener” position. Use a stand, if possible.
-
Page 68: Sti-Pa
SP395 SoundPro Audio Integrator Form7492 Operation Manual RASTI Caveats RaSTI can be used to evaluate intelligibility, and is considered superior to some other methods, particularly ALCONS. However, it is possible to get false results. To get the best possible results, watch out for these problems: Out of band noise. - Page 69 STI, even though it has 1/10 the data points. The SP395 STI-PA implementation is unique, using an STI-PA excitation signal and proprietary DSP algorithms for determining loss of modulation. The STI-PA test signal is played from the supplied CD, and the signal is sampled for 15 seconds.
-
Page 70: Noise Curves
To use STI-PA, you need to play the STI-PA test signal through a speaker, and then use the SP395 microphone to measure the STI-PA signal in the room. If you are testing a specific installed system, such as a fire evacuation sound system, send the signal through the system amplifier and speaker. - Page 71 6. Octave Band SPL Level – Displays the SPL level of the selected octave band. Noise Curves Operation 1. Connect the microphone to the SP395 and position it in the center of the listening position. The microphone is the only input that can be used for the noise criteria test.
-
Page 72: Transmission Loss
ASTM 413 (or ISO 717-1), to define a laboratory measurement, and ASTM 336, which takes the lab measurement and applies it to field work. The SP395 calculates laboratory values including STC, RW, and OITC. STC (Sound Transmission Class) is the ASTM (US) measurement, RW is based on the European standard, and OITC (Outdoor-Indoor Transmission Class) is based on an A-weighting curve, and is considered by some to be more modern. - Page 73 2. Apply Noise Source. Generate a sufficient sound level (pink noise) in the room. 3. Saving the source room RTA. Select the RTA test function on the SP395. Setup for a 1/3 octave RTA. Store the RTA test results to a memory location using the bottom center toolbar.
-
Page 74: Audio Stethoscope
4. Headphone/Speaker Monitor Level – Increases or decreases volume out of the speaker or headphone. 5. Speaker Monitor On/Off – Turns on or off audio pickup from the left input to the internal speaker of the SP395. 6. Audio Monitor Source/Mode – Overridden during Stethoscope function. Left input selected. -
Page 75: Tech Bench
48V to 0V as indicated in the top toolbar. Use the auto-gain input feature of the SP395 as it provides the optimum range from most measurements. To select auto gain, change the M to an A in the top toolbar on the left and/or right channel. -
Page 76: Level/Freq. Meter
SP395 SoundPro Audio Integrator Form7492 Operation Manual Level/Freq. Meter The Level Meter measures and displays the Left and Right audio input levels simultaneously. You can use either XLR connectors or 1/4 inch connectors to the either or both of the audio inputs. -
Page 77: Signal Generator
4. Select the measuring range. It is advised to select auto-ranging or “A” in the top center toolbar so the SP395 can select the best range automatically. You may hear some artifacts of connecting a strong signal to an input of the meter when it has auto-ranged to maximum gain. - Page 78 USB symbol. When USB is selected, the USB source (typically a computer) is routed directly to the main SP395 output. Level in this case is controlled from the computer, not the SP395.
-
Page 79: Amplitude Sweep
The generator output is fed to the input of the device under test and the output of the device is fed back to the SP395’s measurement input. As the generator is swept smoothly, the measuring circuit averages the results over each of the 1/12 octave bands within the desired sweep range. - Page 80 Amplitude Sweep Operation 1. Set up Output Connect any of the SP395’s outputs to the input of the device being tested. 2. Set up Input Select the appropriate input range that provides the highest range while avoiding clipping.
-
Page 81: Distortion Meter
The Distortion Meter may be used in conjunction with the internal generator or with a separate low distortion generator. The SP395’s THD +N test is designed to be performed at 63, 125, 250, 500, 1000, or 2000 Hz. The THD+N test sums the energy in the harmonics (and residual noise) of the sine-wave audio input to the meter to compute the THD+N. - Page 82 Typically THD+N testing is performed at 1 kHz. 2. Set up the Input: Connect the output of the device being tested to the SP395’s left input. Turn off the phantom power, set the input gain (auto-gain may be used), and select the Left In for the input on the distortion test field.
- Page 83 IMD is measured by applying a two-tone test signal to the device under test and measuring the distortion components resulting from this test signal. The SP395 supports both SMPTE IMD testing, using a 7 kHz/60 Hz composite waveform, and DIN IMD testing, using an 8 kHz/250 Hz composite waveform.
- Page 84 How to use the IMD Distortion Meter 1. Set up the Output: Connect the SP395 output to the input of the device to be measured. Note that you must use the SP395 generator for the most accurate results. The generator automatically outputs the two-tone test signal selected within the IMD test type screen (60Hz/7kHz or 8kHz/250Hz).
-
Page 85: Phase Meter
SP395 inputs. 3. Turn on the signals. If you are using the SP395 to create the test signal, turn on the sine wave generator in the bottom Toolbar. Otherwise, create the sine wave reference and test signals. -
Page 86: Crosstalk Meter
Note: Any two audio signals may be compared and a level difference measured as a crosstalk value. 3. Set up the output: Connect the SP395 output to only one channel input of the device or cable under test. 4. Pick the reference channel: Select a reference channel for the CrossTalk meter within the test screen. -
Page 87: Speakers
Note: Since the SP395 uses XLR pin 2 hot, if your system is wired pin 3 hot, you will likely get incorrect results! A simple way around this is to use an unbalanced output, either the... - Page 88 2. Speaker Polarity Indicator – Shows the test result or polarity of the speaker. 3. Confidence Bars – Indicates when a good level is being sensed by the SP395 and you can be confident in the measurement result.
-
Page 89: Speaker Distortion
SP395 SoundPro Audio Integrator Form7492 Operation Manual Observe the display for speaker phase. A plus sign indicates that the speaker output is the same polarity as the signal that is being applied to the system input. Note: Some loudspeakers are intentionally wired with one driver out of phase in the enclosure to provide a smoother phase response at the crossover point of the crossover network. - Page 90 THD+N test selection. Speaker Distortion Test Operation 1. Connect the SP395’s Output to the amplifier input. The SP395 must be the signal source for the distortion test. Connect the output to the amplifier that is driving the speaker to be tested.
-
Page 91: Impedance Meter
2. Test Connection Instructions – Instruction on how to connect the balanced output to a load for measurement. Use the specialty Impedance Test Cable, Sencore #39G1171. This cable provides the proper connection from the ¼ inch mono (balanced) plug to clip connections which can be connected to a device or input to be tested. -
Page 92: Impedance Sweep
Impedance Meter Operation 1. Connect the special cable to device or system. Use the specialty Impedance Test Cable, Sencore #39G1171. Plug this connector into the 1/4” TRS output (phone) jack, next to the male XLR output jack. 2. Connect load. Connect the test lead clips to the speaker, system input or other load to be measured. - Page 93 Impedance Sweep Operation 1. Connect the special cable to device or system. Use the specialty Impedance Test Cable, Sencore #39G1171. Plug this connector into the 1/4” TRS output (phone) jack, next to the male XLR output jack. (Disconnect the load from any power amplifier for best results and safe operation.) •...
- Page 94 After recalling a memory, you can use the graph control fields and the cursor to read out individual data values. These memories can be transferred to the PC/Mac using the Interface Utility provided on the SP395 software CD. Real-time Interface The Impedance Sweep, when used with the TerraLink PC software, allows you to see the results in real time on the screen of a PC or Mac computer.
-
Page 95: Cable Tester
XLR balanced or ¼ phono unbalanced connectors. Simply connect one end of the cable being tested to the appropriate input connector on the left side of the SP395 ("L" input). Connect the other cable end to the corresponding output connector on the right side of the SP395. - Page 96 Note: The SP395 uses XLR pin 2 hot. If your system is wired pin 3 hot, you will get wrong results. A simple way around this is to use an unbalanced output, either the RCA output or the...
-
Page 97: Tools
The Tools menu of the SP395 incorporates a full-function two- way USB audio interface. This allows routing the audio from the mic/line inputs of the SP395 to a computer through a USB port connection. It further provides receiving USB audio from a computer, and routing it to the main output of the SP395. -
Page 98: Usb Preamp Operation
DSP for processing, you can use the Audio Integrator functions and the USB preamp at the same time. For example, you can use the SP395 as a sound card for a PC- based analysis program, like SmaartLive, while you record the A-weighted sound level, using the Sound Study Graph. -
Page 99: Usb Output Operation
Note: Only the left PC USB audio channel is available. The USB signal is available only on the main analog SP395 outputs, and is not available in the monitor section, so you cannot hear USB audio in the headphones. -
Page 100: Utility Function
SP395 SoundPro Audio Integrator Form7492 Operation Manual Utility Function The SP395 Utility Function menu has the following options: Audio Scope Save Settings Setup & Calibration PC Interface/About Audio Scope The Audio Scope works with either or both of the inputs. The Audio scope is an audio- bandwidth digital oscilloscope. - Page 101 1. Connect the input signal. Plug the audio source(s) into the L or R inputs on the right side of the SP395. If NOT using microphones turn off the phantom power by changing the 48V to 0V in the top Tool Bar phantom voltage field.
-
Page 102: Save Settings
Set Save Settings to Y. Change the N to a Y. • Exit to menu. Click the back arrow to exit the function. The settings will be saved in non-volatile memory and will be restored the next time that you turn on the SP395. < Settings... -
Page 103: Setup & Calibration
Sencore. Sencore issues you an unlock code to enter into the SP395. Contact the Sencore sales department directly to purchase a firmware package. Once a package is unlocked, it will remain available on that Integrator. -
Page 104: Setup - General
This menu has fields for miscellaneous data values that are stored in the SoundPro. Each is described below. Since you can alter the contents of the calibration values stored in the SoundPro, be careful with these data fields! If you are unsure of what to do, contact Sencore technical support before altering any setting. -
Page 105: Spl Calibration
A second method of calibrating a microphone is to enter the microphone’s known calibration constants into the SPL calibration screen on the SP395. When purchasing a microphone, such as the Sencore Precision Low Noise Microphone ANSI Type 1 (#SP-PMIC1), the mic is supplied with the calibration constants values. -
Page 106: Pc Interface/About
1. Connect the supplied serial adapter cable between the Serial Interface port on the Integrator and an open serial port on the host computer. This connects the PC serial port to the serial port on the SP395. 2. Start the application program such the SoundPro Audio Report software to transfer... -
Page 107: Computer Interface
USB port. A standard straight-through serial cable is used. SP395 offers a range of capabilities when it is interfaced to a computer and the computer is loaded with associated software. You can transfer instrument data memories to a computer for printing, upgrade the unit operating firmware, display the test results of some functions in real time on a computer screen or, control the SP395 for automated testing. -
Page 108: Upgrading Firmware In Sp395
Firmware upgrade files will be posted on the Sencore web site under the SP395 product page. They will be identified by version number. The current firmware versions in the instrument can be found in the PC Interface/About submenu. -
Page 109: Terralink Software: Real-Time Computer Interface
Sencore will give you your unlock code. If you have not registered your SP395, you will be required to do so at this time. Note that you may be required to provide proof of purchase to obtain a free software upgrade. -
Page 110: Appendix A Db Spl Scale
SP395 SoundPro Audio Integrator Form7492 Operation Manual APPENDIX A - dB SPL Scale The 0 dB SPL reference level is set at 20 µPa (pressure equal to the threshold of hearing at 1 kHz). This places the upper threshold of pain near 135 dB SPL. Unless otherwise noted, SPL readings use this reference and omit the "SPL"... -
Page 111: Appendix Bansi Weighting Curves
SP395 SoundPro Audio Integrator Form7492 Operation Manual APPENDIX B – ANSI Weighting Curves SPL meters convert sound pressure variations into an electrical signal that changes in amplitude, according to the sound pressure. The display shows the sound pressure level with a flat or linear response to all audio frequencies. -
Page 112: Ansi Balanced Noise Criterion Curves
SP395 SoundPro Audio Integrator Form7492 Operation Manual APPENDIX C – ANSI Balanced Noise-Criterion Curves Simple SPL measurements do not represent the background noise our ears hear. Because our ears are less sensitive to low frequency noise than to high frequency noise, noise levels at higher frequencies must be given more weight than levels at lower frequencies. -
Page 113: Serial Protocol For Accessing Sp395 Memories
The receiver should verify the checksum and then assemble the bytes into 256 16-bit words. Memory Data Format The data transmitted from the SP395 has the following format, as shown in an example C struct: struct memstr char id[4]; /* Xnnn – memory number sent */ union short idata[120];... - Page 114 SP395 SoundPro Audio Integrator Form7492 Operation Manual The data stored in the data block and extra data sent vary by memory type: RTA, RTA LOW data block stores 120 1/12 octave integer RTA magnitude value data points in 10 * dB.
-
Page 115: Warranty And Service Information
Save the original shipping carton and packing material for reuse if you ever need to ship your generator, or return it to the Sencore factory for repair. 1. If you are returning the unit to Sencore for service, call the service department at the number below and enclose the following information: owner's address, billing information, purchase order (if applicable), name and phone number of contact person, description of problem and reason for return. - Page 116 SP395 SoundPro Audio Integrator Form7492 Operation Manual 3200 Sencore Drive Sioux Falls, SD 57107 Innovatively designed Call 1-800-SENCORE (736-2673) with your time in mind. www.sencore.com Form7492 Printed in U.S.A.
Need help?
Do you have a question about the SP395 and is the answer not in the manual?
Questions and answers