
Related Manuals for Hioki LR5051


Summary of Contents for Hioki LR5051
- Page 1 Instruction Manual LR5051 CLAMP LOGGER July 2013 Revised edition 2 LR5051B980-02 13-07H...
-
Page 3: Table Of Contents
Contents Contents Introduction ................1 Verifying Package Contents............3 Safety Information..............5 Operating Precautions.............6 Measurement Preparation to Data Analysis ......8 Chapter 1 Overview __________________________________ 13 Product Overview and Features ......13 Part Names/Functions and Display Indicators ..14 Display Organization ..........16 Chapter 2 Measurement Preparations___________________ 19 Installing (or Replacing) the Battery ......19 Connecting a Clamp Sensor ........22 Installing the PC Application Program ....29... - Page 4 Contents Manually Importing (Saving) Recorded Data to a Computer, and Graph Display ....... 65 Displaying a Graph of Saved Recording Data ..68 Printing Recorded Data .......... 70 Chapter 5 Processing Recorded Data ___________________ 71 Scaling ..............73 Calculating Electric Power ........74 Calculating Energy Cost ........
- Page 5 Contents Chapter 9 Maintenance and Service ____________________ 97 Cleaning ..............97 Disposing of the Logger .........97 Troubleshooting ............98 Error Displays ............100 Appendix_________________________________ A 1 Appendix 1 About Recording Modes......A 1 Appendix 2 Recording Intervals and Maximum Recording Times .......... A 2 Appendix 3 Battery Life Approximation ......
- Page 6 Contents...
-
Page 7: Contents
Introduction Introduction Thank you for purchasing the HIOKI "Model LR5051 Clamp Logger." To obtain max- imum performance from the instrument, please read this manual first, and keep it handy for future reference. Registered Trade Marks Windows is a registered trademark of Microsoft Corporation in the United States and/ or other countries. -
Page 8: Introduction 1
Introduction Accuracy We define measurement tolerances in terms of rdg. (reading) and dgt. (digit) values, with the following meanings: rdg. The value currently being measured and indicated (reading displayed on the measuring instrument. value) The smallest displayable unit on a digital measur- dgt.... -
Page 9: Verifying Package Contents
When you receive the instrument, inspect it carefully to ensure that no damage occurred during shipping. In particular, check the accessories, panel switches, and connectors. If damage is evident, or if it fails to operate according to the specifica- tions, contact your dealer or Hioki representative. Quantities in parentheses ( ). LR5051(1) - Page 10 9675 Clamp On Leak Sensor 10A AC leakage current *:The latest version can be download- Note: Displays up to 5.000 A with ed from our web site. the LR5051 9219 Connection Cable 9657-10 Clamp On Leak Sensor Z5004 Magnetic Strap 10A AC leakage current Note: Displays up to 5.000 A with...
-
Page 11: Safety Information
Safety Information Safety Information This manual contains information and warnings essential for safe operation of the instrument and for maintaining it in safe operating condition. Before using it, be sure to carefully read the following safety precautions. This instrument is designed to comply with IEC 61010 Safety Stan- dards, and has been thoroughly tested for safety prior to ship- ment. -
Page 12: Operating Precautions
Operating Precautions Operating Precautions Follow these precautions to ensure safe operation and to obtain the full ben- efits of the various functions. Installation Precautions • Operating temperature and humidity: 0 50C (32 to 122F), 80%RH or less • Storage temperature and humidity: -10 to 60C (14F to 140F), 80%RH or less (non-condensating) •... - Page 13 Never use abrasives or sol- vent cleaners. • Hioki shall not be held liable for any problems with a computer system that arises from the use of this CD, or for any problem related to the purchase of a Hioki product.
-
Page 14: Measurement Preparation To Data Analysis
Example case: Record factory current consumption at one-minute intervals for one month, and store the data on a computer. Required Items: Quantities in parentheses ( ). LR5051 (1) LR6 alkaline battery (2) CT6500 Clamp On Sensor (1) LR5091 Communication Adapter (1) Computer (1) (CD [PC application software] and ... - Page 15 Measurement Preparation to Data Analysis Install the LR5000 Utility Program on the computer. "Installing the PC Application Pro- See: gram" (p.29) Select the recording interval for the logger (in this case, 1 minute). "Recording Interval Setting" (p.37) See: (The setting can be made also from the LR5000 Utility Program.) (p.46) Set the logger to the correct date and time (in this case, 15 May 2010, 13:00).
- Page 16 Measurement Preparation to Data Analysis Set the recording mode to [OFF]. (This setting provides instantaneous mea- surement.) "Recording Mode Setting" (p.40) See: (The setting can be made also from the LR5000 Utility Program.) (p.46) Set the power save setting to [ON]. (The on (enabled) setting is recommended for long-term recording.) "Power Save Setting"...
- Page 17 Measurement Preparation to Data Analysis Hold REC/STOP on the logger for two seconds to start recording. "4.3" (p.53) See: Press on the logger to confirm that the recording count is incrementing, and that recording data (maximum and minimum values) are displayed. (Confirm that recording is actually occurring.) "4.4"...
- Page 18 Measurement Preparation to Data Analysis...
-
Page 19: Chapter 1 Overview
1.1 Product Overview and Features Chapter 1 Overview 1.1 Product Overview and Features This instrument is a compact portable data logger for measuring, displaying, and recording AC current. Large display shows two • Data can be imported while recording. channels' data simulta- •... -
Page 20: Part Names/Functions And Display Indicators
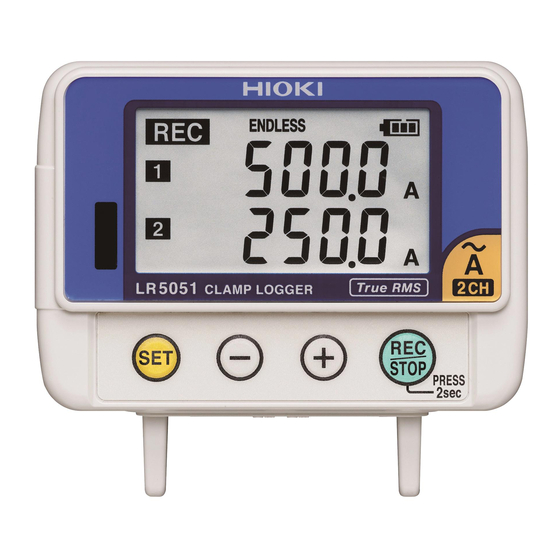
1.2 Part Names/Functions and Display Indicators 1.2 Part Names/Functions and Display Indicators Front Back Stand/Strap Attachment Hole (p.52) LCD (p.15) Attach the logger to a wall or other surface by The display blanks after 30 seconds of oper- hanging it on a screw. (Supported screw head ator inactivity (auto power save). - Page 21 1.2 Part Names/Functions and Display Indicators Display Indicators The display indicators provide the following information. REC Indicator Indicates recording in progress. (Blinks when waiting to record.) AL indicator When the alarm* function is enabled, this indicates when a mea- sured value is outside of the specified (upper/lower value*) range. ENDLESS indicator Indicates the Stop Method Setting display.
-
Page 22: Display Organization
1.3 Display Organization 1.3 Display Organization The logger has two general display types: Measurement and Settings. Measuring display The (+) and (-) buttons switch the display type. Example: Two-channel measurement in the 50 A range Channel 1 measured value Channel 2 ... - Page 23 1.3 Display Organization Setting Display Select the display with the button. Press to change a setting. Press the button to switch to the Measurement display from any other. REC/STOP Example: Two-channel measurement with the CT6500 in the 50 A range Footnotes *1 to *3 are on the next page.
- Page 24 1.3 Display Organization 1: Select what happens when memory becomes full. When on, the oldest data is overwritten, and when off, recording stops. (Default is on.) 2: When on (statistical recording), instantaneous, maximum, minimum, and average values are recorded at each interval. Battery life is shorter. (Default is off.) (Record instantaneous values) 3: Battery life is extended when on (enabled).
-
Page 25: Measurement Preparations
2.1 Installing (or Replacing) the Battery Measurement Chapter 2 Preparations 2.1 Installing (or Replacing) the Battery • After replacing the battery, replace the cover before using the logger. • Battery may explode if mistreated. Do not short-circuit, recharge, disassemble or dispose of in fire. •... - Page 26 2.1 Installing (or Replacing) the Battery • When battery voltage is too low to operate the logger, the following appears. Replace the battery to restore normal operation. Battery Status Indicator This indicator is displayed at the top right corner. Battery charge remains. Fewer blocks within the indicator signify weaker battery charge. Replace the discharged battery as soon as possible.
- Page 27 2.1 Installing (or Replacing) the Battery Battery Replacement Required Items: LR6 alkaline battery (1) Battery cover Push the tab Press the PUSH tab as shown, and pull the battery cover back. Hold the battery cover while separating it from the logger Install the battery as shown.
-
Page 28: Connecting A Clamp Sensor
2.2 Connecting a Clamp Sensor 2.2 Connecting a Clamp Sensor Connect a clamp sensor to the logger's sensor jacks. • Connect the clamp sensors to the instrument first, and then to the active lines to be measured. Observe the following to avoid electric shock and short circuits. •... - Page 29 2.2 Connecting a Clamp Sensor • When disconnecting the BNC connector, be sure to release the lock before pulling off the connector. Forcibly pulling the connector without releasing the lock, or pulling on the cable, can damage the connector. • Do not connect or disconnect when the logger is on, or when clamped around a conductor.
- Page 30 2.2 Connecting a Clamp Sensor Connecting to the Logger Required Items: Hioki Clamp sensors (See: "Options" (p.4)) Pins in the Align the slots in the BNC plug on the sensor Slots in the jack cable with the pins in the jack on the logger.
- Page 31 2.2 Connecting a Clamp Sensor Conductor Clamping To measure, clamp the sensor around only one conductor. 9695-02 Clamp On Sensor CT6500 Clamp On Sensor 9669 Clamp On Sensor Load Current Leakage Current 9675 Clamp On Leak Sensor 9657-10 Clamp On Leak Sensor (The figure is when 9675 is used.) •...
- Page 32 2.2 Connecting a Clamp Sensor Measuring Leakage Current (requires the 9675 or 9657-10 Clamp On Leak Sensor) Position the clamp so the conductor is centered. If the approximate amplitude of the current to be measured is unknown, select the 5 A range before starting to measure. Clamp around only one conductor.
- Page 33 2.2 Connecting a Clamp Sensor • Clamp around both conductors for 1P2W circuits. • Clamp around all four conductors for 3P4W circuits. If clamping is impractical, measurement is also available at the equipment ground line. • Proper measurements may not be possible if large current is flowing in nearby lines.
- Page 34 2.2 Connecting a Clamp Sensor Load Current Measurement Position the clamp so the conductor is centered. • Non-sinusoidal waveforms such as at inverter secondaries cannot be measured. • If the approximate amplitude of the current to be measured is unknown, select the following range before starting to measure....
-
Page 35: Installing The Pc Application Program
2.3 Installing the PC Application Program Installing the PC Application Program To save, browse, or print data, or to make logger settings from a computer, first install the "LR5000 Utility Program". LR5000 Utility Program Operating Requirements 1 GHz or faster processor clock At least 512 MB Windows XP SP2 or later Windows Vista SP1 or later... - Page 36 [Advanced Installation] on the screen. Installation of the LR5000 Utility Program and device driver begins. When the security warning window appears, click [Run]. After installation, start the program by selecting [Programs]-[Hioki]-[LR5000 Util- ity Software]-[LR5000 Utility] from the Windows [Start] menu.
- Page 37 4. Click [Yes]. (The program is uninstalled.) Version Upgrading Download the latest version of the LR5000 Utility Program from our website. (http://www.hioki.com). Follow the procedure on the download page to install the latest version. (The old version is uninstalled automatically.)
- Page 38 2.3 Installing the PC Application Program LR5000 Utility Program Screens Main Screen (p.43) Displays the data import screens: Displays Option Displays screens Help Logger data import Display Data Displays Setting Screens: Display Data View- Sorting screens ing screens Logger settings Setting Screens (p.44) Make and export logger settings.
- Page 39 2.3 Installing the PC Application Program Data Import Screens (p.65) Import data from the logger with these screens. Example: Logger import screen Data Viewing Screens (p.68) View imported data on these screens. Select a file to view, as a graph or table. Example: Screens for viewing the latest data...
- Page 40 2.3 Installing the PC Application Program Data Sorting Screens (p.81) Sort imported data on these screens. You can copy, delete, move, combine, and extract data. Example: Data Copy screen Option Screens (p.87) Make advanced settings on these screens. You can specify the data importing method. Example: Import Method Setting screen...
-
Page 41: Chapter 3 Settings
3.1 Settings List Chapter 3 Settings Configure measurement settings before starting to record. Logger settings can also be made from a PC running the LR5000 Utility Program. (p.43) 3.1 Settings List Following is a list of all settings. Although all settings are available from the LR5000 Utility Program, some settings are limited when made from the logger. - Page 42 3.1 Settings List LR5000 Setting Item Setting Options Logger Refer To Utility Refer To Program Enter a comment for the Channel Comment specified measurement (p.45) channel. Select the recording start Recording Start method. (The start time can (p.46) Method be specified.) Select the recording stop Recording Stop method.
-
Page 43: Making Settings On The Logger
3.2 Making Settings on the Logger 3.2 Making Settings on the Logger To return to the Measurement display from any Settings display, press the REC/ STOP button. • When the battery indicator appears, settings cannot be changed (although they can still be displayed). •... - Page 44 3.2 Making Settings on the Logger Real-Time Clock Setting Press the button to display the time settings. ([TIME] is displayed, and the year setting blinks.) Press the buttons to change the year. Press the button to accept the year setting. (The month setting starts blinking.) Year Setting display Repeat this procedure to set the month,...
- Page 45 3.2 Making Settings on the Logger Stop Method Setting (for when memory becomes full) Press the button to display the stop method setting. (The [ENDLESS] indicator appears, and the setting blinks.) Press the buttons to select or [OFF]. Press the button to accept the set- ting.
- Page 46 3.2 Making Settings on the Logger Recording Mode Setting Press the button to display the recording mode setting. (The [STAT] indica- tor appears, and the setting blinks.) Press the buttons to select [ON] [OFF Press the button to accept the setting. (The power save setting is displayed.) Description Setting Options...
- Page 47 3.2 Making Settings on the Logger Selecting the Clamp Sensor Model and Measurement Range Select the clamp sensor model and applicable measurement range according to the current to be measured. Press the button to display the CH1 range setting. (The clamp sensor model number and mea- surement range (or [OFF]) are displayed.) Press the buttons to select the...
- Page 48 3.2 Making Settings on the Logger Filter Setting Press the button to display the filter set- ting. (The [FILT] indicator appears.) (Press the buttons to select [ON] [OFF Press the button to accept the set- ting. (The measurement display appears.) Description Setting Options ON (Default)
-
Page 49: Making Settings From The Lr5000 Utility Program
3.3 Making Settings from the LR5000 Utility Program 3.3 Making Settings from the LR5000 Utility Program Logger settings can be made with the LR5000 Utility Program supplied with the LR5091 Communication Adapter and the LR5092-20 Data Collector. Install the Utility Program on the computer before connecting. (p.29) Connecting the Logger, LR5091, and Computer Connect to the computer using the supplied USB cable. - Page 50 3.3 Making Settings from the LR5000 Utility Program For the Setting], click the [Logger] but- ton. The Logger Settings screen appears. (If the logger is not connected, you are prompted to connect it. Connect the logger.) Select the logger from the device list*, and edit the settings.
- Page 51 3.3 Making Settings from the LR5000 Utility Program How can the settings from one logger be copied to another? 1. From the device list, select a logger with settings to be copied, and click the [Copy Settings] button. 2. From the device list, select a logger as the destination for the set- tings, and click the [Paste Settings] button.
- Page 52 3.3 Making Settings from the LR5000 Utility Program Rec interval Sets the recording interval. 1/2/5/10/15/20/30 sec., 1/2 /5/10/15/20/30/60 min Start Method Select the recording start method. When [Scheduled Time] is selected, specify the start date and time. Setting Options Description Button Operation Starts recording by pressing the button on the logger.
- Page 53 3.3 Making Settings from the LR5000 Utility Program Settings on the [Measurement Method] Click the [Edit] button to display the setting dialog box. Click a tab. Measurement range setting contents "Selecting the Clamp Sensor Model and Measurement Range" (p.41) See: Filter setting contents "Filter Setting"...
- Page 54 Note: Alarm judgment is performed at every recording interval during instantaneous recording, and once per second during statistical recording. Note: Alarm judgment is performed using measurement values with a larger number of digits than the values (4 digits) indicated in the LR5051 display. Note: The [AL] indicator appears when the measured value is out of range (OF/UF dis- played), and when a sensor anomaly occurs (- - - - displayed).
- Page 55 3.3 Making Settings from the LR5000 Utility Program Other Settings on the Logger Settings Screen Send PC Clock Time Delete Data Set the logger's clock to match the comput- Deletes recorded data in the selected logger er's clock (after confirming the computer's (only while connected).
- Page 56 3.3 Making Settings from the LR5000 Utility Program...
-
Page 57: Measurement And Analysis
4.1 Pre-Measurement Inspection Measurement and Chapter 4 Analysis 4.1 Pre-Measurement Inspection Inspect the following items before starting measurement. Damaged Is any damage to the Request repair. "Requesting repairs" (p.97) See: logger or sensor evident? No damage Communication with LR5091 or Damaged LR5092-20 may not be possible. -
Page 58: Installing The Logger
4.2 Installing the Logger 4.2 Installing the Logger After inspection, install the logger at the measurement site. Be sure to read the "Installation Precautions" (p.6) before installing. Install the logger as necessary according to the following procedure. Persons wearing electronic medical devices such as a pacemaker should not use the Z5004 strap with magnet. -
Page 59: Starting And Stopping Recording
4.3 Starting and Stopping Recording 4.3 Starting and Stopping Recording Start recording after installing the logger. (Display Example of Two-Channel Measurement in the 50 A Range) Start Start From the Measurement display, hold the REC/STOP button for two seconds. [REC] indicator and the data count blink. - Page 60 4.3 Starting and Stopping Recording Recording cannot start when the battery is depleted. When the battery becomes exhausted during recording, recording stops. "2.1 Installing (or Replacing) the Battery" (p.19) See: Automatic Recording Start at Convenient Times Depending on the selected recording interval, recording start is automatically delayed until the next convenient clock time.
-
Page 61: Confirming Currently Measured Values And Data Recording
4.4 Confirming Currently Measured Values and Data Recording 4.4 Confirming Currently Measured Values and Data Recording Confirm data recording on the Measurement display (p.16). You can browse current measurement values (instantaneous), the count of recorded data items, and maximum and minimum values. The (+) and (-) buttons select the type of value displayed. - Page 62 4.5 Automatically Importing (Saving) Recorded Data to a Computer, and Graph Display The main screen appears automatically. If newly recorded data exists, the import confirmation dialog appears. If the data import screen is displayed before connecting the logger, the import confirma- tion dialog does not appear.
- Page 63 4.5 Automatically Importing (Saving) Recorded Data to a Computer, and Graph Display Viewer Screen The viewer screen appears as follows. "Menu Bar Items" (p.58) See: Opens a file con- The displayed time span taining recorded Displays the [Statistical In- can be specified. data.
- Page 64 4.5 Automatically Importing (Saving) Recorded Data to a Computer, and Graph Display Menu Bar Items Menu Item Contents Open Opens a file containing recorded data. Recently opened recording files Opens recently used files. Currently displayed recording data is saved as a Save recording file as new file.
- Page 65 4.5 Automatically Importing (Saving) Recorded Data to a Computer, and Graph Display Main Graph Features The main graph features are shown below. Displays the [Statistical Information and Item Settings ] dialog box. (p.62) Click the buttons to switch between graph Displays the [Graph Set- and table displays.
- Page 66 4.5 Automatically Importing (Saving) Recorded Data to a Computer, and Graph Display [Graph Settings] dialog box Graph details can be set as follows. Click each tab to access various settings. [Common] Automatically sets the time axis and Y- axis to the optimum scale. Select to display the grid.
- Page 67 4.5 Automatically Importing (Saving) Recorded Data to a Computer, and Graph Display [Y axis] Automatically sets all Y-axes to the opti- mum scale. When the Y-axis is different for each item, set the number of axes to a value other than one.
- Page 68 4.5 Automatically Importing (Saving) Recorded Data to a Computer, and Graph Display [Statistical Information and Item Settings] dialog box The following items appear on the [Statistical information] tab. • Item no. • Serial no. • Channel no. • Channel comments •...
- Page 69 4.5 Automatically Importing (Saving) Recorded Data to a Computer, and Graph Display Main Table Features The main table features are shown below. Shows the item no., serial no.,model comment, channel comment, property, measurement units, and average, maximum, minimum, and integration values of all data.
- Page 70 4.5 Automatically Importing (Saving) Recorded Data to a Computer, and Graph Display Selecting Items for Display Click the [Display Item] button in the viewer to display the [Select Items for Display] screen. Click Select up to 600 items for display. Click the [OK] button.
-
Page 71: Manually Importing (Saving) Recorded Data To A Computer, And Graph Display
4.6 Manually Importing (Saving) Recorded Data to a Computer, and Graph Display 4.6 Manually Importing (Saving) Recorded Data to a Computer, and Graph Display You can manually import (save) recorded data to a computer, and display it in a graph. If the LR5000 Utility Program is not run- ning on the computer, click the icon in the task tray (notification area), and click... - Page 72 4.6 Manually Importing (Saving) Recorded Data to a Computer, and Graph Display If the previous data has not been imported, informa- tion is displayed along with the latest data. After making the [Import Data Selection], click the [Start Importing] [Next] button.
- Page 73 4.6 Manually Importing (Saving) Recorded Data to a Computer, and Graph Display How can all data be imported from the logger? Select [Re-import all data from the logger]. (All data in the logger (including any previously imported) is imported to the com- puter, and duplicated data is overwritten.) Data Import screen(p.65) How is the graph automatically displayed after importing data?
-
Page 74: Displaying A Graph Of Saved Recording Data
4.7 Displaying a Graph of Saved Recording Data 4.7 Displaying a Graph of Saved Recording Data Use the LR5000 Utility Program to display saved recording data as a graph. If the LR5000 Utility Program is not run- ning on the computer, click the icon in the task tray (notification area), and click [View Data].*... - Page 75 4.7 Displaying a Graph of Saved Recording Data Other Data Viewing Screen Functions Filter displayed data Display Table Opens the viewer to display the You can filter which loggers appear in the list. Specify the table of imported (or selected) desired filtering criteria, and click the data.
-
Page 76: Printing Recorded Data
4.8 Printing Recorded Data 4.8 Printing Recorded Data Saved recording data can be printed as a graph or table. Graphs displayed in the LR5000 Utility Program can be printed on A3, A4, or B4-size paper. With the desired graph displayed, click the [Print] button. -
Page 77: Processing Recorded Data
Processing Chapter 5 Recorded Data Recorded data saved on the computer can be processed by scaling, electric power calculation, energy cost calculation, operating rate calculation, integration, dew- point temperature calculation, two-item arithmetic calculation, and out-of-range data revision. The LR5000 Utility Program performs the calculations. If the LR5000 Utility Program is not running on the computer, click the icon in the task tray (notification area), and click... - Page 78 Click [Process Data] in the menu bar, and select the desired items. Click [Process Data] Items Items Contents Scaling Performs scaling on the data of one channel. (p.73) Power Calculation Performs approximate electric power calculation. (p.74) Energy Cost Performs approximate energy cost calculation. (p.75) Operating Rate Performs approximate operating rate calculation.
-
Page 79: Scaling
5.1 Scaling 5.1 Scaling The following scaling calculation is applied to measured values. Scaled Result = Raw data (measured value) × A + B × SI prefix (multiplier) Scaled results are saved as a new item in the recording file. Item and range settings Select the item to be scaled, and the time span. -
Page 80: Calculating Electric Power
5.2 Calculating Electric Power 5.2 Calculating Electric Power Approximate electric power is calculated using current measurement data from a clamp logger. Calculation results are saved as a new item in the recording file. • Electric power calculations are only approximate, so results do not always equal the true electric power value. -
Page 81: Calculating Energy Cost
5.3 Calculating Energy Cost 5.3 Calculating Energy Cost Approximate energy cost is calculated using current measurement data from a clamp logger. • Energy cost calculations are only approximate, so results do not always equal the true energy cost. • There is no way to confirm that a specified data item is really an elec- tric power value. -
Page 82: Calculating Operating Rate
5.4 Calculating Operating Rate 5.4 Calculating Operating Rate The approximate operating rate of the measured value is calculated. The total amount of time during which data exceeds the [Upper threshold] is consid- ered operating time, and the operating rate is calculated as the ratio of the operating time to the total calculation time span. -
Page 83: Integration
5.5 Integration 5.5 Integration Measurement data can be integrated over a specified time span. Integration results are saved as a new item in the recording file. Item and range settings Select the item to be integrated, and the time span. 1. -
Page 84: Calculating Dew-Point Temperature
5.6 Calculating Dew-Point Temperature 5.6 Calculating Dew-Point Temperature Dew-point temperature is calculated from the temperature and humidity measurement data from the logger. Calculation results are saved as a new item in the recording file. • There is no way to confirm that a specified data item is really a tem- perature or humidity value. -
Page 85: Two-Data-Item Arithmetic Calculations
5.7 Two-Data-Item Arithmetic Calculations 5.7 Two-Data-Item Arithmetic Calculations Simple arithmetic operations (+, -, *, and /) can be applied to two data items. Calculation results are saved as a new item in the recording file. Only the values of data items measured during the specified recording time span are applied to calculations and saved. -
Page 86: Converting Over-Threshold Data Values
5.8 Converting Over-Threshold Data Values 5.8 Converting Over-Threshold Data Values Data values larger than the upper threshold and smaller than the lower threshold can be converted to specified values. Converted results are saved as new data items in the recording file. Item and range settings Select the items for conversion, and the time span. -
Page 87: Chapter 6 Organizing Data
Chapter 6 Organizing Data The LR5000 Utility Program can reorganize (copy, delete, move, combine, and extract) imported data. If the LR5000 Utility Program is not run- ning on the computer, click the icon in the Click task tray (notification area), and click [Show Main Screen]. -
Page 88: Copying And Moving Data
6.1 Copying and Moving Data 6.1 Copying and Moving Data The selected logger recording files can be copied or moved to any folder. Example: Copy a file from the folder C:\Users\hioki\Documents\LR5000 to C:\Users\hioki\Desktop. Select [Copying Data] [Moving Data]. Click Select the drive. -
Page 89: Deleting Data
6.2 Deleting Data 6.2 Deleting Data Select and delete logger recording files as follows. Example: Delete a file from the folder C:\Users\hioki\Documents\LR5000. Select Click [Deleting Data]. Select the drive. Select the file. (Up to 100 can be selected.) Select the folder. -
Page 90: Combining Data
6.3 Combining Data 6.3 Combining Data Separate logger recording files can be combined into one set of recording data. Example: Combine file 20110117 with other files in C:\Users\hioki\Docu- ments/LR5000, and save the combined data file in C:\Users\hioki/ Desktop. Select [Combine]. -
Page 91: Extracting Data
6.4 Extracting Data 6.4 Extracting Data Data in a logger recording file can be extracted to a specified time span and saved with a different file name. Example: Extract the data of January 25th from the file 20110117, and save to a different file. - Page 92 6.4 Extracting Data...
-
Page 93: Options Settings (Lr5000 Utility Program)
Options Settings (LR5000 Util- Chapter 7 ity Program) These settings determine the saving method for imported logger data, device con- nection monitoring, and logger setting display functions. If the LR5000 Utility Program is not run- ning on the computer, click the icon in the task tray (notification area), and click [Option]. -
Page 94: Changing The Saving Method For Imported Data
7.1 Changing the Saving Method for Imported Data Changing the Saving Method for Imported Data The saving method for imported logger data can be changed as follows. How can the save destination folder be changed? Click the [Import Method] tab. Click to specify the save destination folder. -
Page 95: Changing The Connection Monitoring Method, And Logger Settings Displays
7.2 Changing the Connection Monitoring Method, and Logger Settings Displays 7.2 Changing the Connection Monitoring Method, and Logger Settings Displays Change the device connection monitoring settings and the functions on the logger settings displays as follows. How can the device connection monitoring setting be changed? Click the [Details] tab. - Page 96 7.2 Changing the Connection Monitoring Method, and Logger Settings Displays...
-
Page 97: Chapter 8 Specifications
8.1 Measurement Specifications Chapter 8 Specifications 8.1 Measurement Specifications 2 channels using external clamp sensors (CT6500/9695-02 /9669 Clamp On Sensor, 9657-10/9675 Clamp On Sensor Leak Sensor) (voltage output via BNC plug) • 1 to 500 mA (500 mA range: using the 9657-10 or 9675) •... -
Page 98: Functional Specifications
8.2 Functional Specifications 8.2 Functional Specifications Display type • Maximum count of 9999 for each range Measurement display • "OF" is displayed when the count of 9999 exceeded range • Less than 0.2% of each range is zero suppressed (less than 1% of the 1,000 A range is zero suppressed) Measured value, measurement channel (1,2), units (mA, A), recording (REC), endless recording (ENDLESS), statistical recording (STAT),... -
Page 99: Miscellaneous
8.3 Miscellaneous 8.3 Miscellaneous Clock accuracy ±50ppm (@25C (@77F)) ±4.32 s/day Backup Recorded data and settings (independent of battery) Half-duplex start/stop synchronous infrared serial communication Interface between the logger and Communication Adapter or Data Collector • Rated supply voltage: 1.5 V DC×2 •... -
Page 100: Lr5091 Communication Adapter Specifications
LR5001 Humidity Logger, LR5011 Temperature Logger, LR5031 Instru- mentation Logger, LR5041 Voltage Logger (50 mV), LR5042 Voltege Logger (5 V), LR5043 Voltage Logger (50 V), LR5051 Clamp Logger Compatible loggers Note: Communication with models LR5031 is supported by PC Utility version 1.05 and later.... - Page 101 All LR5000-series loggers Note1: Communication with models LR5031 is supported by PC Utility version 1.05 and later. LR5051 is supported by PC Utility version 1.01 and later. Model Note2: The COMMUNICATION UTILITY program supports the following models' settings and data import functions. A computer COM...
- Page 102 8.4 LR5091 Communication Adapter Specifications • Communicates with the LR5000-series loggers, and imports recorded data • Combines recorded data • Incorporates new data when an LR5000-series logger holds data not previously imported Data import functions (the following functions are supported by the supplied PC Utility version 2.00, or later) •...
-
Page 103: Maintenance And Service
We do not take any responsibility for damage incurred during shipping. • Please contact your dealer or Hioki representative for information on where to sub- mit products for repair. When the logger will not be used for long time... -
Page 104: Troubleshooting
9.3 Troubleshooting 9.3 Troubleshooting If damage is suspected, check the "Before requesting Maintenance section before contacting your dealer or Hioki representative. Before requesting repairs Problem Symptom Probable Causes Remedies and References The LR5000 Utility Software • The computer operating envi-... - Page 105 9.3 Troubleshooting Before requesting repairs Problem Symptom Probable Causes Remedies and References [REC] indicator disap- one-time recording stop With one-time recording, recording stops automatically when memory pears even though record- method is selected. becomes full. Change the stop meth- ing has not been stopped. od to endless recording.
-
Page 106: Error Displays
The display appears as follows when an error occurs on the logger. Logger Error Displays Error Displays Meaning Remedies and References Calibration data error: Inspection and repair is required. Please contact your dealer or Hioki A fault occurred with the internal representative. calibration data. See: "Requesting repairs" (p.97) Microcomputer error: A fault occurred in microcomputer ROM/RAM. -
Page 107: Appendix
Appendix 1 About Recording Modes Appendix Appendix 1 About Recording Modes The recording method depends on the selected recording mode. The recording modes are as follows. Instantaneous Recording Measurements are recorded in internal memory at each recording interval. Recording Interval Instantaneous values are recorded Statistical Recording Measurements are taken once per second, and instantaneous, maximum, minimum,... -
Page 108: Appendix 2 Recording Intervals And Maximum Recording Times
Appendix 2 Recording Intervals and Maximum Recording Times Appendix 2 Recording Intervals and Maximum Recording Times The recording time is calculated according to the recording capacity. The maximum recording time is limited by the remaining battery capacity. Instantaneous Recording Up to 60,000 values can be recorded per channel. Recording Interval Recording Time Recording Interval... -
Page 109: Appendix 4 Measurement Method
Appendix 4 Measurement Method Appendix 4 Measurement Method Calculating the rms value The method used to calculate the rms value is to sample the measurement signal every 250 ms and then determine the rms value through arithmetic from the data of a maximum of 400 points. - Page 110 Appendix 4 Measurement Method...
-
Page 111: Index
Index Index Index Symbols Data view screen (PC application program) ..............68 (-) button ............ 14 Data view screen (PC application) ..71 (+) button ........... 14 Delete ..........49 Device connection monitoring setting ..89 Dew-point temperature calculation ..78 Display graph .......... - Page 112 Index Index How can the save destination folder be changed? ..........88 How to switch from a Setting display No measured value is displayed .... 98 to Measurement display? ......55 How to switch from a setting display to measurement display? ......55 One-Time Recording ........
- Page 113 Index Index Safety information ........5 Save method screen (PC application program) ....66 Saving recorded data to a computer ..55 Scaling ...........47 Scheduled Time ........46 SET button ..........14 Setting (PC application program) ... 44 Setting display ...........
- Page 114 Index Index...
Need help?
Do you have a question about the LR5051 and is the answer not in the manual?
Questions and answers