LeCroy WavePro 7 Zi series Operator's Manual
Oscilloscopes
Hide thumbs
Also See for WavePro 7 Zi series:
- Getting started manual (197 pages) ,
- Getting started manual (188 pages)
Table of Contents
Advertisement
Quick Links
Advertisement
Table of Contents

Subscribe to Our Youtube Channel
Related Manuals for LeCroy WavePro 7 Zi series


Summary of Contents for LeCroy WavePro 7 Zi series
- Page 1 Operator’s M anual WavePro, ® SDA, and DDA 7 Zi Series Oscilloscopes...
- Page 2 :DYH3UR DW 0QLXXR0QR$H $HUDJRU 0...
- Page 3 PREPAID. The oscilloscope is warranted for normal use and operation, within specifications, for a period of three years from shipment. LeCroy will either repair or, at our option, replace any product returned to one of our authorized service centers within this period. However, in order to do this we must first examine the product and find that it is defective due to workmanship or materials and not due to misuse, neglect, accident, or abnormal conditions or operation.
-
Page 4: Table Of Contents
Getting Started Manual Welcome ...........................22 WavePro 700Zi Features ................... 22 Comprehensive Core Functions (1000Base-T through Vertical) ....... 22 Compatible Options and Accessories ................ 22 Reference........................22 Support ........................22 Thank You ........................22 Cable De-Embedding ...................... 23 Setting Up Cable De-Embedding ................23 Saving Cable Configurations .................. - Page 5 WavePro 7Zi The Signal Display Grid ..................... 45 Dialog Area ........................ 46 Universal ProBus/ProLink Interface ................46 ProLink Interface ......................49 Connecting the Adapters ................... 49 Auxiliary Output Signals ....................50 Auxiliary Output Setup ....................50 Pass/Fail Testing ......................51 Comparing Parameters ....................51 Mask Tests .........................
- Page 6 Getting Started Manual Excel Control Dialog ....................... 73 Entering a File Name ....................74 Organizing Excel Sheets ....................74 Setting the Vertical Scale ....................75 Trace Descriptors ......................75 Multiple Inputs and Outputs ...................75 Simple Excel Example 1 .................... 76 Exponential Decay Time Constant ................
- Page 7 WavePro 7Zi Zooming a Single Channel ................... 108 Touch-and-Drag Zooming .................... 109 Quickly Zooming Multiple Waveforms ................ 109 Multi-Zoom ........................109 Persistence Setup ......................110 Setting Up Persistence .................... 110 3-Dimensional Persistence - Not Available in All Scopes ........111 Setting up 3-Dimensional Persistence ..............112 Show Last Trace ......................
- Page 8 Getting Started Manual Setting Preferences ....................131 Creating a Notebook Entry ................... 132 Recalling Notebook Entries ..................135 Creating a Report ......................136 Previewing a Report ....................136 Locating a Notebook Entry ..................136 Creating the Report ....................137 Formatting the Report ....................137 Managing Notebook Entry Data ...................
- Page 9 WavePro 7Zi Power (Density) Spectrum ..................152 Memory for FFT ....................... 152 FFT Pitfalls to Avoid ....................152 Picket Fence and Scallop ..................152 Leakage ........................152 Choosing a Window ....................152 Improving Dynamic Range ..................153 Record Length ......................153 FFT Algorithms ......................
- Page 10 Getting Started Manual Determining Top and Base Lines ................196 Determining Rise and Fall Times ................196 Determining Time Parameters ..................197 Determining Differential Time Measurements ............197 Level and Slope ......................198 Print, Plot, or Copy ......................198 Printing ...........................198 Setting Up the Printer ....................198 Printing a Screen Image ..................
- Page 11 WavePro 7Zi Searching for Messages ....................214 Overview of I CBus Options ..................215 Accessing Serial Triggers .................... 216 Creating an I C Trigger Condition ................216 C Decode Setup Detail ....................217 Setup Mode ........................218 Sources Setup ....................... 218 Trigger Type Selection ....................
- Page 12 Getting Started Manual Width Trigger .........................243 How Width Trigger Works ..................243 Width Trigger Setup ....................243 Qualified Trigger ......................244 How Qualified Triggers Work ................... 244 Qualified First Trigger ....................245 Edge Qualified Trigger Setup................... 245 State Triggers ......................245 Pattern (Logic) Trigger ....................
- Page 13 WavePro 7Zi Setting Up Remote Communication................ 264 Configuring the Remote Control Assistant Event Log ..........265 Hardcopy ........................265 Printing ........................265 Clipboard ........................265 File ...........................265 E-Mail ........................266 Auxiliary Output Signals ....................266 Setting Up Auxiliary Output ..................267 Date and Time ........................
- Page 14 Getting Started Manual Group Delay Compensation ..................273 Dark Calibration ......................274 Performing Dark Calibration..................274 What Can AORM Do? ....................274 Histogramming ......................274 Trending .........................274 Model of Optical Recording Processing ..............274 Selecting Parameters ....................274 BES or EES Table ....................275 Setup and Measurement Dialog...................
- Page 15 WavePro 7Zi Dp2c - DELTA PIT TO CLOCK ..................298 Description ....................... 298 Display Options ......................299 Dp2cs - DELTA PIT TO CLOCK SIGMA ............... 300 Description ....................... 300 Display Options ......................300 EDGSH - EDGE SHIFT ....................301 Description ....................... 301 Display Options ......................
- Page 16 Example and Step-by-Step Instructions ..............325 Improving Horizontal Measurement Accuracy ............327 Base and Top Calculation .................... 328 Introduction to AORM Theory ..................329 LeCroy DSO Process ....................329 Histogram Parameters ....................330 Zoom Traces and Segmented Waveforms ..............331 Histogram Peaks ......................331 Example ........................
- Page 17 WavePro 7Zi Creating a CustomDSO Setup File ................348 CustomDSO PlugIn Mode .....................349 Creating a CustomDSO PlugIn ..................349 Properties of the Control and Its Objects ..............350 Removing a PlugIn ......................353 Example 1 ........................353 First Example PlugIn – Exchanging Two Traces on the Grids ........ 353 Example 2 ........................356 Second Example PlugIn –...
- Page 18 Getting Started Manual Jitter Parameters Setup ................... 381 When to Use Persistence Histograms ................ 382 Setting Up Persistence Histograms ................382 Selecting the Math Function ..................382 Setting Up the Histogram ..................383 How to Trace Persistence .................... 383 An Innovative Visual and Processing Tool .............. 384 To Set Up Trace Persistence ...................
- Page 19 WavePro 7Zi Async N Cycle Plot ....................412 Edge-Edge Spacing Controls .................. 412 SDA Function Reference ....................412 AltNcycle ........................413 AltNcycle Control Summary ..................413 Htie to BER ........................414 Jitter Filter Function ..................... 416 Slice2Persist ........................416 SDA Theory ........................417 Clock Recovery Theory ....................418 Eye Pattern Theory .......................
- Page 20 Getting Started Manual The Relationship between the Inverse Error Function and Total Jitter....434 Application of Error Function to Measured Jitter CDF (on Q-scale) ......435 Automatic Renormalization of the Q-scale ..............437 Obtaining Deterministic and Random (Gaussian) Components from the Normalized Q-scale Diagram ............................440 Overview of Multi-Eye Measurement Tools ..............
- Page 21 WavePro 7Zi Which Signals to Provide ..................462 Choosing the Waveform Section to Be Analyzed ............ 462 Selecting the Reference Waveform ................. 463 Time/Div Settings ..................... 463 Automatically Shown Traces ................... 464 Setting Bit Cell Time ....................464 Retraining the Filter ....................464 Choosing an Analysis Method ..................
- Page 22 Getting Started Manual Example File ......................503 TF-DSQ Overview ......................504 Probe Calibration with the TF-DSQ Fixture ............. 504 TF-DSQ Fixture Overview ..................... 506 Assembling the TF-DSQ fixture ................... 507 TF-DSQ Scope Connection ..................507 Probe Connection to TF-DSQ ..................508 Probe Calibration Menu ....................
-
Page 23: Wavepro 700Zi Features
Operator's Manual Thank you for purchasing a LeCroy product. We're certain you'll be pleased with the detailed features so unique to our instruments. This WavePro 700Zi Operator's Manual provides information in the following manner: WavePro 700Zi Features First, we cover functions like... -
Page 24: Cable De-Embedding
WavePro 7Zi When making measurements on serial data signals, losses in the cables used in the test setup can reduce the accuracy of your signal (for example, signal amplitude and risetime), as well as introduce Inter-Symbol Interference. These cable effects can dramatically alter your serial data measurements and potentially create mask test violations. - Page 25 Operator's Manual On the Cable De-Embedding dialog, touch inside the File Name [DefaultCable] data entry field and enter a file name using the pop-up keyboard. Touch the Browse button and select a location and file name. Touch the Save button. Note: You can load previously saved cable configurations by touching the Browse button, locating the file and then clicking Load.
-
Page 26: Sequence Display Modes
WavePro 7Zi Sequence Display Modes The instrument gives you a choice of five ways to display your segments: Adjacent Waterfall (cascaded) Mosaic (tiled) Overlay Perspective Setting Up Sequence Mode When setting up Sequence Mode, you define the number of fixed-size segments acquired in single-shot mode (see the instrument specifications for the limits). - Page 27 Operator's Manual Figure 3-2. Setting up Sequence Mode (Adjacent) Touch Timebase Horizontal Setup on the menu bar. Under Sampling Mode, touch the Sequence mode button Click the Sequence tab. Under Acquisition Settings, touch inside the Num Segments data entry field and enter the number of segments you want to display, using the slider bar at the bottom of the window.
-
Page 28: Zooming Segments In Sequence Mode
WavePro 7Zi Note: Once a single acquisition has started, you can interrupt the acquisition at any time by pressing the front panel button a second time or by pressing the S front panel button. In INGLE this case, the segments already acquired will be retained in memory. Zooming Segments in Sequence Mode You can zoom individual segments easily using the Q front panel button. -
Page 29: Displaying An Individual Segment
Operator's Manual If you want to set exact horizontal or vertical zoom factors, touch inside the Horizontal Scale/div data entry field and enter a time-per-div value, using the pop-up numeric keypad. Then touch inside the Vertical Scale/div field and enter a voltage value. Displaying an Individual Segment Touch Math Math Setup on the menu bar. -
Page 30: Spectrum Analyzer
WavePro 7Zi Touch inside the Select Segment field and enter a segment number, using the pop-up keypad or touch the arrow buttons to scroll through segment times. The Spectrum Analyzer and Advance FFT option in the WavePro 700Zi series oscilloscopes will help you use the Fast Fourier Transform (FFT) in your measurements. -
Page 31: Triggerscan
Operator's Manual NumberDescription Start Stop provides another way to adjust the position of the FFT zoom trace. You can specify the Starting and Stopping Frequencies Resolution Bandwidth is equivalent to changing the Timebase setting to increase or decrease memory in FFT mode. Reducing the Resolution Bandwidth equals more memory. The Spectrum Analyzer reports back adapted values for the resolution bandwidth if the value entered is not achievable. -
Page 32: Training Triggerscan
WavePro 7Zi Training TriggerScan The TriggerScan Trainer inspects a currently acquired waveform and automatically builds a list of common trigger setups used to find rare events. PLEASE NOTE THE FOLLOWING: You must acquire and display at least 3 cycles of a signal before running the Trainer. You should run the Trainer if you want to change the trigger types or if you change the channel or signal. -
Page 33: Starting Triggerscan
Operator's Manual Starting TriggerScan After you have run the Trainer, the Trigger List displays a list of smart trigger setups. You can add or remove trigger setups. You can also update the selected smart trigger setup. Once you have made any changes to the Trigger List, you are ready to start scanning. -
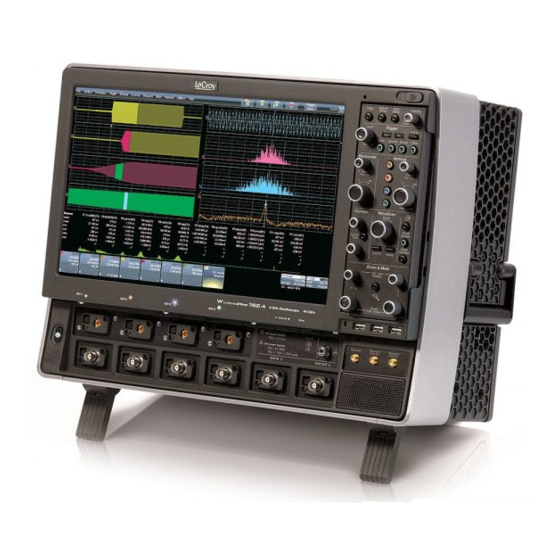
Page 34: Front Panel
WavePro 7Zi Numbered labels on this graphic correspond with descriptions in the table. Number and Description Number and Description Number and Description Volume Control and Mute USB Ports Power Button Button 10. Detachable Front Panel- Channel Row LED Indicator Ground Connector Remote Control Channel Inputs Speaker... -
Page 35: Detaching And Attaching The Front Panel
Operator's Manual Detaching and Attaching the Front Panel Detach the front panel from the oscilloscope by sliding the detachment lever to the left and pulling at the right. Attach the front panel by inserting the lower part first, sliding the detachment lever to the left, and then pushing the top in place. -
Page 36: Side Panel
Numbered labels on this graphic correspond with descriptions in the table. Number and Description Number and Description Number and Description Speakers Microphone LBUS (LeCroy Bus) 10. PCI Expansion Slots for DVI External VGA Monitor Mouse (for standard display Ethernet Port... - Page 37 Operator's Manual Numbered labels on this graphic correspond with descriptions in the table. Number and Description Number and Description Number and Description External Clock Input (Grounded EMI Shield Removable Hard Drive Power Switch required when port is not in DVD-CD + R Drive DC Power Plug use) External Clock Output...
-
Page 38: External Monitor
WavePro 7Zi Setting up the External Monitor involves a connection and a few touch screen selections. It's a hot swap connection, so there's no need to restart the instrument once you've connected. Plug your external monitor (WPZi-EXTDISP15 option) display into the DVI and DC 12 connections on the PCI slot (located on the side of the oscilloscope). - Page 39 Operator's Manual The following picture shows a WavePro 700Zi with the LeCroy external monitor attached (optional WPZi- EXTDISP15). WP700Zi-OM-E-RevA...
-
Page 40: Combining Channels
WavePro 7Zi Combining Channels Channels can be combined to increase sample rate, memory, or both in order to capture and view a signal in all its detail. When you combine channels, uncombined channels like EXT BNC remain available for triggering, even though they are not displayed. - Page 41 Operator's Manual The detachable WavePro Zi front panel. WP700Zi-OM-E-RevA...
-
Page 42: Miscellaneous Setup Controls
Miscellaneous Setup Controls Help - Press to open the LeCroy Online Assistant where you can click to open the oscilloscope online help table of contents, index, or search for a topic using a keyword. If the second monitor is installed, the online help opens on the second monitor. -
Page 43: Horizontal Front Panel Controls
Operator's Manual Horizontal Front Panel Controls Note: Horizontal front panel controls correspond with screen menu selection: Timebase Horizontal Setup. Delay - Press to toggle between a zero horizontal delay value and the previous horizontal delay value. Turn to change the horizontal delay value. Time - Turn to set the time/division of the oscilloscope timebase (acquisition system). -
Page 44: Wavescan Front Panel Controls
WavePro 7Zi Absolute Cursor - Press to set the cursor position to the default 25% position, either horizontal or vertical (depending on which cursor type your are using). Turn to adjust the position of the cursor (absolute cursor or one of the two relative cursors). Cursor Type - Press one to turn cursors ON to the last cursor type selected. -
Page 45: General Controls Front Panel Controls
Operator's Manual General Controls Front Panel Controls Print - Press once and the Print flyout menu opens. Press the Print Now button on the flyout menu to print the current screen image using the Print settings on the Utilities Utilities Setup Hardcopy dialog. -
Page 46: Menu Bar
WavePro 7Zi Quick Zoom - Press to automatically display magnified views of up to four signal inputs on multiple grids. With four input signals, the signals are displayed along with four zoom traces, each on its own grid. Pressing this button also turns off all other traces. Vertical Position - Press to reset the vertical zoom position to zero. -
Page 47: Front Panel Groupings
Front Panel Groupings topic. LeCroy's ProBus probe system provides a complete measurement solution from probe tip to oscilloscope display. ProBus allows you to control gain and offset directly from your front panel. It is particularly useful for voltage, differential, and current active probes. - Page 48 WavePro 7Zi The LeCroy WavePro 700Zi series oscilloscopes with bandwidths of 4 to 6 GHz include universal ProBus/ProLink probe interfaces. As shown in the following figure, each channel has a high bandwidth ProLink connector and a 50 Ÿ/1 MŸ ProBus connector.
-
Page 49: Universal Probus/Prolink Interface
Operator's Manual The setup for the ProBus interface is shown in the following figure. This interface also allows the selection of input impedance, 50 Ÿ/1 MŸ. Figure 3-8. The channel screen layout showing Input B's ProBus interface controls setup Another universal probe interface advantage is the ability to switch between two probe setups. This function is remotely programmable allowing the interface to operate like a switch. -
Page 50: Connecting The Adapters
WavePro 7Zi For some instruments, LeCroy's ProLink Adapters (LPA) give you the ability to connect your signal in one of three ways: BMA connector (only on 4 and 6 GHz models) SMA using the BMA-to-SMA adapter (4 are sent standard on 4 and 6 GHz models) BNC using BMA-to-BNC adapter (optional) Figure 3-9. -
Page 51: Auxiliary Output Signals
Operator's Manual When installing an adapter on the instrument's connector panel, align the male 6-pin connector with the female connector and push the adapter straight in. There will be some resistance and you'll hear clicks as the four clips slide into place. Then tighten the captive screws. When removing an adapter, loosen the two captive screws. -
Page 52: Comparing Parameters
WavePro 7Zi Comparing Parameters Each Pass/Fail input (Qx) can compare a different parameter result to a user-defined limit (or statistical range) under a different condition. The conditions are represented by these comparison operators: At the touch of a button, test results can also be compared to these standard statistical limits: In Dual Parameter Compare mode, your X-Stream oscilloscope can take parameter results measured on two different waveforms and compare them to each other. -
Page 53: Actions
Operator's Manual Actions By touching the Stop Test checkbox in the Actions dialog, you can set up the test to end after a predetermined number of sweeps that you decide. You can also decide the actions to occur upon your waveforms' passing or failing, by selecting one or all of the following: stop audible alarm... - Page 54 WavePro 7Zi Comparing a Single Parameter Touch Analysis Pass/Fail Setup... from the menu bar. Touch one of the Qx tabs and a setup dialog for the position is shown. Touch inside the Source1 field and select a source from the pop-up menu. Touch inside the Condition field in the main dialog and select ParamCompare Touch inside the Compare Values field and select All or Any from the pop-up menu .
- Page 55 Operator's Manual Touch inside the Compare Values field and select All or Any from the pop-up menu . By selecting All, the test will be true only if every waveform falls within the limit that you will set. By selecting Any, the test will be true if just one waveform falls within the limit.
-
Page 56: Signal Views
WavePro 7Zi WaveScan enables you to search for unusual events in a single capture, or to scan for an event in many acquisitions over a long period of time. You can select from more than 20 search modes (frequency, rise time, runt, duty cycle, etc.), apply a search condition (slope, level, threshold, hysteresis), and begin scanning in a post- acquisition environment. -
Page 57: Parameter Measurements
Operator's Manual Edge - for detecting the occurrence of edges; selectable slope and level Non-monotonic - for detecting threshold re-crosses; selectable slope, hysteresis, and level Runt - for detecting pulses that fail to cross a threshold; selectable polarity and thresholds Measurement - for filtering and performing parameter measurements Parameter Measurements... -
Page 58: Source View
WavePro 7Zi This display mode shows all edges in an acquisition overlaid one on top of the other. By default, monochromatic persistence is turned on for the scan overlays, but you have the option to disable it. Saturation and persistence time controls are also available. -
Page 59: Scan Histogram
Operator's Manual By enabling ScanHistogram, a histogram corresponding to your search criteria is superimposed on the overlay trace. In the following example, the Rise 10-90% parameter measurement has been applied, but only edges slower than 1.2 ns with a delta of 50 ps are accumulated in the histogram. Another feature of WaveScan is that you can select a single bin of the histogram for analysis by touching or clicking it. -
Page 60: Zoom View
WavePro 7Zi An individual edge can be zoomed by selecting it from the table of found events at the left of the screen. You can also scroll through the table using the Prev/Next scroll buttons in the Search dialog, or select an event by touching inside the Idx field and entering an index number, using the pop-up keypad. -
Page 61: Edge Mode
Operator's Manual As with other search modes, a trigger action can be set for Edge mode also. WP700Zi-OM-E-RevA... - Page 62 WavePro 7Zi The Non-monotonic search mode looks for edges that cross a threshold more than once between high and low levels. All events that meet the criteria of slope, hysteresis, and level are presented in a table and highlighted in the source trace.
- Page 63 Operator's Manual This search mode looks for pulses that fail to transit a given region. You can search for positive-going or negative- going runts, or both. An adjustable hysteresis band is provided to eliminate noise. In the case of negative-going runt pulses, the value displayed in the table is the difference (delta) of the high level of the signal and the runt amplitude, i.e., where the runt bottoms out.
- Page 64 WavePro 7Zi This search and scan mode lets you apply filters to your acquisitions to highlight only the features of interest. Post-acquisition, you can apply other filters to the acquisition, or make different parameter measurements on it. For example, in this acquisition a Rise time (10-90%) parameter measurement is applied to fast edges during acquisition.
-
Page 65: Scan Filters
Operator's Manual Scan Filters But, now we want to look at fall times greater than 3 ns; fifteen falling edges from the same acquisition pass this new filter: You can also decide how anomalous the features located should be by using the Filter Wizard to select the average value as the limit, to search for rarest events, or to apply statistical criteria. -
Page 66: Filter Methods
WavePro 7Zi In the following example, there were several slow edges in a repetitive waveform. For each filtering method selectable from the wizard, the rise time used as the filter limit and delta are calculated automatically. While the Filter Wizard provides a quick way to apply filtering criteria automatically, the Filter Method menu and related fields let you manually set up filtering criteria. -
Page 67: Auxiliary Output Setup
Operator's Manual In addition to a calibration signal, the following signals can be output through the AUX OUTPUT connector: Square Wave Trigger Out - can be used to trigger another scope DC level - a reference level (not available on all instruments) Trigger Enabled - can be used as a gating function to trigger another instrument when the scope is ready Pass/Fail - allows you to set a pulse duration from 1 ms to 500 ms;... - Page 68 WavePro 7Zi The instrument provides powerful capability to add your own parameters, functions, display algorithms, or other routines to the scope user interface without having to leave the instrument application environment. You can customize the instrument to your needs by using the power of programs such as Excel™, Mathcad™, and MATLAB™, or by scripting in VBS.
-
Page 69: Solutions
Operator's Manual Engineers do not buy equipment; they buy solutions. But what solutions can be reached from a set of instrument waveform data? In principle, anything that can be logically derived from those data, given the limitations of signal- to-noise ratio and processing time. Here are some examples of what can be done with a customized instrument: Changing the units of a grid to joules, newtons, amps, etc. - Page 70 WavePro 7Zi Example 3 Here is the VBScript that produced the "golden sine" (F2 above): Frequency = 3000000.0 ' Frequency of real data SampleTime = InResult.HorizontalPerStep Omega = 2.0 * 3.1416 * Frequency * SampleTime Amplitude = 0.15 ' Amplitude of real data For K = 0 To LastPoint newDataArray(K) = Amplitude * Sin(Omega * K) Next...
- Page 71 Touch here. Summary The examples above illustrate only the capability to use VBScript and MATLAB. The instrument with the LeCroy XMAP software option allows you to use Excel, MATLAB, and VBScript in this manner. Of course, you will need to load Excel, Mathcad, or MATLAB in the scope (VBScript does not require any additional software) to take advantage of the capability.
- Page 72 WavePro 7Zi MATLAB is a software package from MathWorks that provides an environment for work in computation and mathematics. An interactive language and graphics are provided. VBS is a programming language, but you don’t write it in a special environment such as C++ or Visual Basic; you write it within your own application.
-
Page 73: Scaling And Display
Operator's Manual These examples are purely illustrative, but you can easily imagine that with a VBScript you can add value to the scope in a very short time. This gives you an instrument that does exactly what you want, time after time, by using your stored setups and scripts. -
Page 74: A Practical Example – Dvi Data-Clock Skew
Excel calculation. To use this capability, you must have the LeCroy XMAP software option and Excel loaded in your instrument. Select Minimize from the instrument's File menu to access the Excel program directly. -
Page 75: Entering A File Name
Operator's Manual Entering a File Name If you uncheck the New Sheet checkbox, you can enter the file name of an existing file. Create Demo Sheet Calls up a default Excel spreadsheet. Add Chart Adds charts of your waveforms to Excel. You can go into Excel and create as many charts as you want. - Page 76 WavePro 7Zi There are three arrays of data for the three waveforms: up to two inputs and one output. There are corresponding small arrays of information about each trace. The vertical scale of the output waveform from Excel may be set in three ways: Set Vertical Description: Scale:...
-
Page 77: Simple Excel Example 1
Operator's Manual Simple Excel Example 1 In this example we use Excel to invert or negate a waveform. The first figure shows a part of the screen. The upper trace is the original signal. The lower is the result from Excel. The dialog is the one that controls the location of the data in the Excel worksheet. - Page 78 WavePro 7Zi The input data are in columns A and B (though, only the first is used) and the output is in column C. All have been set to start at row 2, allowing space for a title in row 1. Columns D, E and F contain the headers for the three waveforms.
- Page 79 Operator's Manual To get the output values in column C, we set C2 = - A2 and copy this formula down the column. This is the only action needed in Excel, and can be seen in the next figure: WP700Zi-OM-E-RevA...
- Page 80 WavePro 7Zi Simple Excel Example 2 In this example we use Excel to invert or negate a waveform. The first figure shows a part of the instrument screen. The upper trace (C1) is the original signal. The lower trace (F1) is the result calculated in Excel and displayed on the screen. The input data is in columns A and B (though by default, only a single input/column is used), and the output is in column C.
- Page 81 Operator's Manual Choose a function, and select as Operator1 for the ExcelMath function. Excel will open automatically in the background. Choose File, Minimize from the menu bar to minimize the instrument display and open the Excel program. Create your formula for each data point in column A (in this case, our formula for cell C2 is –A2, copied for the entire column), as shown here Retrigger the scope (if it is not currently triggering)
- Page 82 WavePro 7Zi You can also create a chart of the data in Excel automatically and view the data there. Simply press the Add Chart button in the instrument's Excel dialog and a chart of the input (top chart) and Excel calculated output (bottom chart) will be automatically created in the spreadsheet.
- Page 83 Operator's Manual This example calculates the time constant of an exponentially falling pulse, such as the light output of a phosphor. The first figure shows a typical pulse, including pseudo-random noise, generated by a VBScript. (1 – t/TC1) -t/TC2 The pulse was generated by a formula of the form e , where TC1 and TC2 are time constants, The requirement is to measure the time constant TC2, using the portion of the trace where TC1 has negligible effect.
- Page 84 WavePro 7Zi This example calculates a parameter of a waveform, in a region of interest defined by the leading edges of two pulses in a separate waveform. This figure shows the instrument screen: The traces were made using VBS scripts in functions F1 and F2, based on pseudo-random numbers to provide noise and varying pulse widths.
-
Page 85: How Does This Work
Operator's Manual How Does this Work? The amplitude of the signal is about 0.3 volts, and the screen height is 0.4 volts, as derived from cells F7 and Fx. A threshold value for amplitude was calculated by placing 0.5 * (Fy – Fx) in cell A4. Remember that in the instrument the sources were defined to be A10 and B10. - Page 86 WavePro 7Zi This example used the CORREL (Array1, Array2) function of Excel, as depicted below: Required files: CorrelateExcel22Apr.lss Setup: NoisySine22Apr.txt Function F1: NoisySine22Apr.txt Function F2: Correlate22Apr.xls Function F3: This example shows how you can place multiple traces in one picture, with only two operations in an Excel sheet. Depicted below is an example from an Excel spreadsheet.
- Page 87 Operator's Manual The method is very simple. First, the waveform is transferred to an Excel spreadsheet by means of an instrument Excel call. Second, two operations are needed in Excel: placing a simple formula in one cell, and copying that formula into a range of cells.
- Page 88 WavePro 7Zi Required files: F1 is needed only as a simulator of signals. Instrument setup: LaserStartup25Apr.lss Function F1: LaserStartupApr25.txt LaserStartupPulses.xls No offset Function F2: LaserStartupPulses2.xls Vertical offset LaserStartupPulses3.xls Vertical and horizontal offset WP700Zi-OM-E-RevA...
-
Page 89: Example Waveform Function Script: Square Of A Waveform
Operator's Manual Required files: Setup: LaserSurface1May.lss Function F1 Generator: LaserSurface2May.txt Function F2 Excel: LaserSurface2May.xls From the editing panel you can save your script and you can load a previous one. Should you forget to save a script, please note that when you save your setup, it has your current scripts embedded in it. Therefore it is a good idea to save your setup frequently. -
Page 90: Example Parameter Function Script: Rms Of A Waveform
WavePro 7Zi newArray(i) = ScaleFactor * (unscaledData(i)) ^ 2 Next OutResult.DataArray(False) = newArray ' signed long integer data output Example Parameter Function Script: RMS of a Waveform ' Example script to produce a parameter. ' This script calculates the root mean square ' of the input waveform. - Page 91 Operator's Manual InResult.DataArray(False) means that the data are signed integers in the range -32768 to 32767. False is a Boolean value applying to the property Scaled. Scaled data are specified in the units of the vertical scale, such as volts. You get these by putting "True" instead of "False". If you want to make a section of the output trace invisible, you simply set the data values to full scale or bigger, top or bottom.
- Page 92 WavePro 7Zi The default parameter script is similar to the default waveform script, but there are subtle differences. First, the size of the data array is the same as the nominal value: you cannot use or see the extra two points. So "500 points"...
-
Page 93: Errors
Operator's Manual If you make a script that takes a long time to run, go back to the default setup before quitting or powering down, or you will have a long wait next time you power up. Always use a recursive calculation when this will speed things up. Keep everything outside a loop that does not have to be inside, to speed things up. - Page 94 WavePro 7Zi In the figure below is a type of error message that you may see if one of your calculations has tried to set a value outside the range -32768 to +32767. It takes extra time to guard against this, but unless you are sure that it will not happen, you need some kind of check.
-
Page 95: Speed Of Execution
Operator's Manual You can, however, use one of the following: On Error Resume Next followed by some code that may make some attempt to deal with the problem, or at least to allow execution to continue. On Error GoTo 0 This cancels On Error Resume Next To maximize the speed of execution of a script, the most important thing you can do is to minimize the number of operations that are performed inside loops. - Page 96 WavePro 7Zi Calculating the rate of decay of a damped sine. Finding pulses in a pulse train. Until we have integrated a more comprehensive debugger for VBScript there is a workaround. 1. Download the Windows Scripting Debugger for Windows 2000 from here: http://download.microsoft.com/download/winscript56/Install/1.0a/NT45XP/EN-US/scd10en.exe 2.
- Page 97 Operator's Manual The MATLAB Waveform functions are selected from the Select Math Operator menu. Please note that once you have clicked on "MATLAB Wave" there will be a slight pause before MATLAB starts. Figure 4-6. Source 1 and Source 2 are the waveforms that MATLAB will use. WP700Zi-OM-E-RevA...
- Page 98 WavePro 7Zi Once you have invoked a MATLAB waveform call, you will see the zoom dialog at the right of the screen. Touch the MATLAB tab to see a panel like this Touch Find Scale to make your output fit the grid, or use the text boxes to choose a scale. By touching Edit Code, you can reach the MATLAB Editor where you will see the default waveform function.
- Page 99 Operator's Manual This is the default waveform function, with one important change – the semi-colon (;) has been removed from the end of the line. If the semicolon is present, your function will run much faster, because the output values will not be shown in MATLAB Response.
- Page 100 WavePro 7Zi If you touch the MATLAB Plot checkbox you will see a MATLAB plot like this WP700Zi-OM-E-RevA...
- Page 101 Operator's Manual Menu position for MATLAB parameter call in Select Measurement menu. Once you have invoked a MATLAB parameter call, a mini-dialog to the right of the main dialog will appear: You can touch the MATLAB Plot checkbox if you want to see a plot in MATLAB as well as getting a result in the instrument.
- Page 102 WavePro 7Zi By touching Edit Code, you can reach the MATLAB Editor: This simple example shows the MATLAB function Standard Deviation acting on input channel 1, and the result would be shown in the MATLAB Response pane for an amplitude of 0.15 volt. You can load an existing MATLAB program, using the Load Code button, and you can save the current program, using the Save Code button.
- Page 103 Operator's Manual The next example calculates the ratio of the number of data points that are above a given level to the number of points below the level, in this case one half of the amplitude. WP700Zi-OM-E-RevA...
- Page 104 WavePro 7Zi Negate the input signal. Square the input signal. Create pulses from a sinusoid. Create pulses at the zero crossings of the signal. WP700Zi-OM-E-RevA...
-
Page 105: Matlab Parameter Editor
Operator's Manual Convolve two signals. The procedure is simple. Create a MATLAB function using any text editor, and save it as a MATLAB m-file by giving it a name of the form Filename.m. Call the function using the MATLAB math editor or the MATLAB parameter editor as appropriate. -
Page 106: Display Setup
WavePro 7Zi Note: Not all grid styles are available on all instruments. Touch Display Display Setup on the menu bar. Touch one of the Grid combination buttons Note: Autogrid automatically adds or deletes grids as you select more or fewer waveforms to display. WP700Zi-OM-E-RevA... -
Page 107: Sequence Sampling Mode – Working With Segments
Operator's Manual Touch inside the grid Intensity data entry field and enter a value from 0 to 100 using the slider bar at the bottom of the window. Click the keypad button on the slider bar to enter a value using the pop-up numeric keypad. Touch the Grid on top checkbox if you want to superimpose the grid over the waveform. -
Page 108: Xy Display
WavePro 7Zi Note: If you have more than one waveform displayed on only one grid, a second grid will open automatically when you select Next Grid. Use XY displays to measure the phase shift between otherwise identical signals. You can display either voltage on both axes or frequency on both axes. -
Page 109: Previewing Zoomed Waveforms
Operator's Manual You can also use the front panel Q button to create multiple zooms, one for each displayed UICK input channel. For more information, see the Quickly Zooming Multiple Waveforms topic. Previewing Zoomed Waveforms When you zoom a waveform, a preview of the zoomed area will appear in the Preview section of the Zx dialog. The Zoom button appears as a standard button at the bottom of the channel Cx Vertical Adjust setup dialog for you to create a zoom trace of your input waveform. -
Page 110: Multi-Zoom
WavePro 7Zi If you want to set exact horizontal or vertical zoom factors, touch inside the Horizontal Scale/div data entry field and enter a time-per-div value, using the pop-up numeric keypad. Then touch inside the Vertical Scale/div field and enter a voltage value. PLEASE NOTE THE FOLLOWING: To reset the zoom to x1 magnification, touch Reset Zoom in the dialog. -
Page 111: Persistence Setup
Operator's Manual Use the Auto-Scroll buttons at the right of the Multi-Zoom dialog to control the zoomed section of your waveforms: Turning Off Multi-Zoom On the menu bar, touch Math Math Setup. Touch the Multi-Zoom On checkbox to turn off Multi-zoom. The Persistence feature helps you display your waveform and reveal its idiosyncrasies or anomalies for a repetitive signal. - Page 112 WavePro 7Zi If you want to set up Follow these steps: persistence for: Touch one of the mode buttons Touch the Show last trace checkbox if you want the last trace displayed. Touch inside the Saturation data entry field and enter a whole number integer, using the slider bar at the bottom of the window.
-
Page 113: Setting Up 3-Dimensional Persistence
Operator's Manual Here is a monochrome (analog) view of the same waveform. The lightest areas indicate highest intensity, corresponding to the red areas in the solid view. Here is a shaded (projected light) view of the same waveform. This view emphasizes the shape of the pulses. Here is a wire frame view of the same waveform in which lines of equal intensity are used to construct the persistence map. -
Page 114: Persistence Time
WavePro 7Zi You can control the duration of persistence by setting a time limit, in seconds, after which persistence data will be erased: 0.5 s, 1 s, 2 s, 5 s, 10 s, 20 s, or infinity. The instrument gives you the choice of constraining all input channels to the same mode, saturation level, persistence time, and last trace display, or setting these for each input channel individually. -
Page 115: Viewing Thumbnail Histograms (Histicons)
Operator's Manual Touch inside the Measurement field and select a parameter from the pop-up menu. Touch inside the Graph with field and select Histogram from the pop-up menu. In the dialog to the right, touch the Histogram tab. On the Buffer side of the Histogram tab, touch inside the #Values data entry field and enter a value or use the slider bar at the bottom of the window. -
Page 116: Persistence Sigma
WavePro 7Zi Persistence Sigma Using this math operation, you can enter a scale, measured in standard deviations, by which to create a new waveform. An understanding of statistical variations in parameter values is needed for many waveform parameter measurements. Knowledge of the average, minimum, maximum, and standard deviation of the parameter may often be enough, but in many cases you may need a more detailed understanding of the distribution of a parameter's values. -
Page 117: Dso Process
Operator's Manual DSO Process The instrument generates histograms of the parameter values of input waveforms. But first, you must define the following: The parameter to be histogrammed The trace on which the histogram is to be displayed The maximum number of parameter measurement values to be used in creating the histogram The measurement range of the histogram The number of bins to be used Some of these are pre-defined but can be changed. -
Page 118: Histogram Parameters (Xmap And Jta2 Options)
WavePro 7Zi Histogram Parameters (XMAP and JTA2 Options) Once a histogram is defined and generated, measurements can be performed on the histogram itself. Typical of these are the histogram's average value, standard deviation most common value (parameter value of highest count bin) leftmost bin position (representing the lowest measured waveform parameter value) rightmost bin (representing the highest measured waveform parameter value) Histogram parameters are provided to enable these measurements. -
Page 119: Binning And Measurement Accuracy
Operator's Manual However, signal noise and the use of a high number of bins relative to the number of parameter values acquired, can give a jagged and spiky histogram, making meaningful peaks hard to distinguish. The scope analyzes histogram data to identify peaks from background noise and histogram definition artifacts such as small gaps, which are due to very narrow bins. -
Page 120: Full Width At Xx% Maximum
WavePro 7Zi fwhm Full Width at Half Maximum Example: fwxx Full Width at xx% Maximum Determines the width of the largest area peak, measured between bins on either side of the Definition: highest bin in the peak that have a population of xx% of the highest's population. If several peaks have an area equal to the maximum population, the leftmost peak is used in the computation. -
Page 121: Histogram Amplitude
Operator's Manual fwxx Full Width at xx% Maximum hist ampl Histogram Amplitude The difference in value of the two most populated peaks in a histogram. This parameter is useful Definition: for waveforms with two primary parameter values, such as TTL voltages, where hampl would indicate the difference between the binary `1' and `0' voltage values. -
Page 122: Histogram Root Mean Square
WavePro 7Zi hist rms Histogram Root Mean Square Definition: The rms value of the values in a histogram. The center value of each populated bin is squared and multiplied by the population (height) of the Description: bin. All results are summed and the total is divided by the population of all the bins. The square root of the result is returned as hrms. -
Page 123: Maximum Population
Operator's Manual hist top Histogram Top Example: maxp Maximum Population Definition: The count (vertical value) of the highest population bin in a histogram. Each bin between the parameter cursors is examined for its count. The highest count is returned Description: as maxp. -
Page 124: Percentile
WavePro 7Zi mode Mode Example: Here, mode is 150 mV. pctl Percentile Computes the horizontal data value that separates the data in a histogram such that the population Definition: on the left is a specified percentage `xx' of the total population. When the threshold is set to 50%, pctl is the same as hmedian. -
Page 125: Range
Operator's Manual Peaks T2 = mean + 2 * sigma, and where sigma is the standard deviation of all populated bins under T1. Once T2 is defined, the histogram distribution is scanned from left to right. Any bin that crosses above T2 signifies the existence of a peak. Scanning continues to the right until one bin or more crosses below T2. -
Page 126: Total Population
WavePro 7Zi range Range Example: In this example, range is 2 mV. totp Total Population Definition: Calculates the total population of a histogram between the parameter cursors. Description: The count for all populated bins between the parameter cursors is summed. Example: The total population of this histogram is 9. -
Page 127: System Recovery For Oscilloscopes Running Windows Xp And Vista
Note: Any user and calibration data located on the D: partition is not affected by the recovery process. LeCroy provides you with a recovery application and a backup image in an extra partition on the instrument’s hard drive. The recovery process is easy to perform, using the following instructions . After the recovery procedure is done, you must activate Windows, either by Internet connection to Microsoft’s Web site or by telephone. - Page 128 WavePro 7Zi As soon as the LeCroy logo appears on the screen, press and hold down the F4 key until the recovery software logo appears momentarily: Then the cME console End User License Agreement is displayed. Read the agreement, and click Accept:...
- Page 129 Operator's Manual The Phoenix cME Console main page is displayed. Click Click here to start recover: The FirstWare Recover splash screen is displayed momentarily: WP700Zi-OM-E-RevA...
- Page 130 WavePro 7Zi The recovery starts, and the FirstWare Progress screen is displayed. No further selections are required. The recovery takes about 10 minutes. Note: The screen goes blank on occasion for prolonged periods. This is normal and is not an indication of any malfunctioning of the recovery process.
-
Page 131: Restarting The Application
Operator's Manual Restarting the Application Upon initial power-up, the oscilloscope automatically loads the instrument application software. If you exit the application and want to reload it, touch the shortcut icon on the desktop: If you minimize the application, touch the appropriate task bar or desktop icon to maximize it: Restarting the Operating System If you need to restart the Windows®... -
Page 132: Preferences
WavePro 7Zi LeCroy's LabNotebook feature extends the documentation capabilities of your scope. It allows you to create an annotated notebook entry containing all displayed waveforms, the setup of the DSO, and user-supplied annotation. The notebook entry can then be converted to hardcopy format -- pdf, rtf, or html -- and printed or e- mailed. - Page 133 Operator's Manual E-mail Setup You can e-mail just the pdf or html report; or, you can include additional files: trace data (.trc) for each waveform in the report, a screen dump, a scope setup file, and an xml report record. Touch the checkbox to enable the extra report segments.
- Page 134 WavePro 7Zi A drawing toolbar appears at top: Icon: Description: The pen tool enables you to write or draw in freehand. You can use a mouse, or a stylus to do this using the touch screen. Once you click off, you can drag your note anywhere on your waveform.
- Page 135 Operator's Manual Icon: Description: When you have chosen a custom color, touch Add to Custom Colors; the color will appear in the Custom Colors palette. Then touch the color to enable it, and touch OK. The next object that you create will be in that color. If you want to erase a drawing object, touch it to select it, then touch Erase Selected.
- Page 136 WavePro 7Zi Icon: Description: in the LabNotebook dialog. You can now create a hardcopy report of it, and email or print it out. After a notebook entry is made, you can recall it at any time. The recall includes waveforms and scope settings. Select the notebook entry from the list box.
-
Page 137: Creating A Report
Operator's Manual Once the notebook entry is created, you can easily generate a hardcopy report for e-mailing or printing. Previewing a Report Before creating a report, you can preview it by simply touching the View button . To exit the preview, touch the Close button at the right of the dialog. Locating a Notebook Entry A search filter is provided to help you locate the notebook entry you want to make a report of. -
Page 138: Creating The Report
In the Create Report window, select a folder to contain the report. Touch inside the File name field and enter a name using the pop-up keyboard. Click OK to create the report. Formatting the Report LeCroy provides a default report format (template); however, you can use your own format, including company logo. Touch the Advanced tab. -
Page 139: Deleting Notebook Entries
Operator's Manual Touch the notebook entry you want to annotate in the scroll list box. A new tab appears bearing the name of the selected notebook entry. Touch the new tab, then the Scribble button . The notebook entry opens again with the drawing toolbar, described in Creating a Notebook Entry. - Page 140 WavePro 7Zi Insert a memory stick into a USB port, then touch the Backup button to send the database to the external media Starting a New Database Touch the Start New button. The name of the notebook database will be incremented by 1. With the instrument’s math tools you can perform mathematical functions on a waveform displayed on any channel, or recalled from any of the four reference memories M1 to M4.
-
Page 141: Setting Up A Math Function
Operator's Manual Setting Up a Math Function Math Setup This setup mode allows you to quickly apply frequently used math functions. Touch Math Math Setup on the menu bar. If there are math functions already assigned to F1 through Fx[The number of math traces available depends on the software options loaded on your scope. -
Page 142: Deskewing
WavePro 7Zi Characteristic Trend Track No. Since data can be accumulated over many Yes. Maximum time period acquisitions, and since the oscilloscope takes Ensures No Lost that can be captured is time to calculate measurement values and to Measurement Data limited by acquisition display data before the trigger is re-armed, data memory and sampling rate. -
Page 143: Rescaling Setup
Operator's Manual For example, acceleration can be entered as M/S2 for meters per second squared volts seconds can be entered as V.S. In some cases, the units entered may be converted to simple units. For example entering V.A will display W (watts) Rescaling Setup Touch Math... -
Page 144: Setting Up Continuous Averaging
WavePro 7Zi This is also the formula used to compute summed averaging. But by setting a "sweeps" value, you establish a fixed weight that is assigned to the old average once the number of "sweeps" is reached. For example, for a sweeps (weight) value of 4: sweep (no old average yet): new average = (new data +0 * old average)/(0 + 1) = new data only sweep: new average = (new data + 1*old average)/(1 + 1) = 1/2 new data +1/2 old average... -
Page 145: How The Instrument Enhances Resolution
Operator's Manual How the Instrument Enhances Resolution The instrument's enhanced resolution feature improves vertical resolution by a fixed amount for each filter. This real increase in resolution occurs whether or not the signal is noisy, or your signal is single-shot or repetitive. The signal-to-noise ratio (SNR) improvement you gain is dependent on the form of the noise in the original signal. -
Page 146: Setting Up Enhanced Resolution (Eres)
WavePro 7Zi To increase vertical resolution: In the example at left, the lower ("inner") trace has been significantly enhanced by a three-bit enhanced resolution function. To reduce noise: The example at left shows enhanced resolution of a noisy signal. The original trace (left top) has been processed by a 2-bit enhanced resolution filter. -
Page 147: Waveform Sparser
Operator's Manual Touch the ERES tab in the right-hand dialog, then touch inside the bits field and make an Enhance by selection from the pop-up menu The Copy math function makes a copy of your present waveform in its unprocessed state. While processing may continue on the original waveform, the copy enables faster throughput in some cases by preserving the original data. -
Page 148: Demodulation
WavePro 7Zi Select Interpolate from the Filter submenu. Touch the Interpolate tab in the mini setup dialog to the right of the main dialog. Touch inside the Algorithm field and select an interpolation type. Touch inside the Upsample by[Upsampling is the factor by which sampling is increased.] field and enter a value, using the pop-up numeric keypad, if you want to enter a specific value. - Page 149 Fast Wave Port is a processing function for the LeCroy X-Stream family of digital oscilloscopes that enables you to insert your own custom processing algorithm, written in the C/C++ language, into the DSO's processing stream.
- Page 150 WavePro 7Zi Touch Math Math Setup on the menu bar. Touch one of the Math function tabs, for example. Touch inside the Source1 field, and select a signal source from the pop-up menu. The source can be a channel waveform, math or memory trace, or a parameter. Touch inside the Operator1 field and select FastWavePort from the Custom menu: In the right-hand mini-dialog, touch the Fast Wave Port tab:...
-
Page 151: Setup - Case 1
Operator's Manual Setup - Case 1 This scenario assumes that you have developed your application on a PC. Compile your application on your PC Copy the compiled file onto the scope, using a memory stick or network drive. Open the Command Prompt window (Start --> Programs --> Accessories --> Command Prompt) and run your application. -
Page 152: Setting Up An Fft
WavePro 7Zi Choice of Programming Language The system was designed for use with the C/C++ programming language. However, it is theoretically possible for the processing to be implemented in any language that supports Windows named events (Mutex) and can open a named memory-mapped file. -
Page 153: Power (Density) Spectrum
The highest point in the spectrum can be 3.92 dB lower when the source frequency is halfway between two discrete frequencies. This variation in spectrum magnitude is the picket fence effect. The corresponding attenuation loss is referred to as scallop loss. LeCroy scopes automatically correct for the scallop effect, ensuring that the magnitude of the spectra lines correspond to their true values in the time domain. -
Page 154: Improving Dynamic Range
ERES low-pass filter and the noise shape (frequency distribution). LeCroy digital oscilloscopes employ FIR digital filters so that a constant phase shift is maintained. The phase information is therefore not distorted by the filtering action. -
Page 155: Fft Algorithms
Operator's Manual spectrum. Effects such as leakage and aliasing that distort the spectrum must be understood if meaningful conclusions are to be arrived at when using FFT. An effective way to reduce these effects is to maximize the acquisition record length. Record length directly conditions the effective sampling rate of the scope and therefore determines the frequency resolution and span at which spectral analysis can be carried out. - Page 156 WavePro 7Zi dBm Power Density: where ENBW is the equivalent noise bandwidth of the filter corresponding to the selected window, and Delta f is the current frequency resolution (bin width). The FFT Power Average takes the complex frequency-domain data R' and I' for each spectrum generated in Step 5, and computes the square of the magnitude:...
- Page 157 Operator's Manual An FFT corresponds to analyzing the input signal with a bank of N/2 filters, all having the same shape and width, and centered at N/2 discrete frequencies. Each filter collects the signal energy that falls into the immediate neighborhood of its center frequency.
-
Page 158: To Use The Web Editor
WavePro 7Zi where: M = 3 is the maximum number of terms, a are the coefficients of the terms, N is the number of points of the decimated source waveform, and k is the time index. The table of Coefficients of Window Functions lists the coefficients a . - Page 159 Operator's Manual appear as unavailable in the Math Setup dialog However, you can cancel web processing within the "Math Setup" dialog by touching the single function, double function, or graph button. Touch the Measure tab, then touch the Web Edit button, if you want to dedicate a parameter location (P1 to Px) for web processing: The parameter location you choose will display "Web Edit"...
-
Page 160: Cursor Measurement Icons
WavePro 7Zi If you are using a memory location (M1 to M4) as an input, drag a line to the math function in the same way as for channel inputs. Note: You can use a combination of channel input and memory input to your math function. Touch the output arrow of the math function icon and drag a line to the Fx output on the right-hand side of the setup field. -
Page 161: Cursors Setup
Operator's Manual Icon: Description: Displays the absolute Y position. Displays the difference in Y values. The value can be read in the descriptor label for the trace. Displays absolute and delta cursors together. Displays the slope between cursors. If there are non–time-domain waveforms displayed, there will also be a menu offering choices of x-axis units: s or Hz, for example. -
Page 162: Setting Up Relative Cursors
WavePro 7Zi Setting Up Relative Cursors Touch Cursors Cursors Setup on the menu bar. The Standard Cursors dialog opens. In the dialog area, touch the Cursors On check box to display them. Touch the Horizontal Rel or Vertical Rel mode button. Touch a readout parameter button: Absolute, Delta, Abs+Delta, or Slope. - Page 163 Source1 and Source2 fields. This feature is available with some optional math packages. Advanced Web Edit - Uses LeCroy's Processing Web to set up the measurement. This feature, which is available with the XWEB option, allows you to chain practically unlimited math functions together to operate on your waveform measurements.
- Page 164 WavePro 7Zi If you selected Math On Parameters, touch inside the Math Operator data entry field and select a math function from the pop-up WP700Zi-OM-E-RevA...
-
Page 165: Status Symbols
Operator's Manual menu In the mini-dialog to the right of the main setup dialog, touch the Gate tab to narrow the span of measurement. Touch the Accept tab to define parameter values to be used in the measurement. Status Symbols Below each parameter appears a symbol that indicates the status of the parameter, as follows: Symbol: Description: A warning symbol indicates that there is something wrong with the signal or the setup. - Page 166 WavePro 7Zi Minimize the scope display by selecting File Minimize. Touch the X-Stream Browser desktop icon to open the browser. Touch the left scope icon ("Connect to a local X-Stream DSO device") in the X-Stream Browser toolbar: Select Measure Parameter in error (P1) Result Read the status information in line StatusDescription.
-
Page 167: Statistics
Operator's Manual Touch the Statistics On checkbox in the Measure dialog to display statistics for standard vertical or horizontal parameters, or for custom parameters. The statistics that are displayed are as follows: Statistics: value (last) mean min. max. sdev The value displayed in the num row is the number of measurements computed. For any parameter that computes on an entire waveform (like edge@level, mean, minimum, maximum, etc.) the value displayed represents the number of sweeps. -
Page 168: Standard Vertical Parameters
WavePro 7Zi Standard Vertical Parameters These are the default Standard Vertical Parameters: Vertical mean sdev max. min. ampl pkpk base Standard Horizontal Parameters These are the default Standard Horizontal Parameters: Horizontal freq period width rise fall delay duty num points Selecting Measure Modes Touch Measure Measure Setup on the menu bar. -
Page 169: Excluded Parameters
Operator's Manual top-to-base ratio when the units are in dB (TBR) Excluded Parameters Parameters that are already the result of parameter math operations are excluded. If they are included in a remote control setup command, an error message is generated and the setup canceled. Excluded parameters are as follows: delta clock-to-data near (DC2D) delta clock-to-data next (DC2DPOS) - Page 170 WavePro 7Zi window directly on the instrument. You can also import an existing script. Param Script vs. P Script Param Script is a VBScript or JavaScript that operates on one or two waveforms and outputs a parameter measurement, as shown in the figure below. P Script, on the other hand, is another VBScript or JavaScript that takes as input one or two parameters and performs a math operation on them to produce another parameter output.
-
Page 171: Setting Up Parameter Math
Operator's Manual Setting Up Parameter Math Touch Measure Measure Setup on the menu bar. Touch the My Measure button in the Measure dialog. Touch the Px tab for the parameter to which you want to apply parameter math. In the Px dialog, touch the math on parameters button . - Page 172 WavePro 7Zi Note: If you have Grid On Top enabled, you will not see the gate posts in their default position at each end of the grid. But if you touch either end of the grid, a drag cursor will appear, indicating that you have control of the post and can now drag it.
-
Page 173: Help Markers
Operator's Manual Touch inside the Start data entry field and enter a value using the slider bar at the bottom of the window. Click the keypad button on the slider bar to enter a value using the pop-up numeric keypad. Or, you can simply touch the leftmost grid line and drag the gate post to the right. - Page 174 WavePro 7Zi Figure 4-11. Standard Vertical Parameter Help Markers Setting Up Help Markers Touch Measure Measure Setup on the menu bar. Select a Measure Mode: Std Vertical, Std Horizontal, or My Measure. Touch the Show All button to display Help Markers for every parameter being measured on the displayed waveform (C2 in the examples above).
- Page 175 Operator's Manual If you want to change the parameter listed, or a measurement characteristic, touch the parameter button (P1 for example) alongside the check box. A pop-up menu of parameters categorized by type appears. To display parameter icons only, touch the icon button at the bottom of the menu.
- Page 176 WavePro 7Zi Parameter Description Definition Notes (Tj) between base and upper or lower levels of 100BT signal. Auto-correlation Signal-to- Available with DDM2 option. ACSN Noise provides a signal-to- (acsn) noise ratio for periodic Standard in DDA-5005A. waveforms. Alternate N-Cycle Plot. Timing of the transitions in the data waveform is measured for each transition...
- Page 177 Operator's Manual Parameter Description Definition Notes undershoot, and ringing do Standard parameter. not affect measurement. Available with SDA option. Bit Rate One over duration of one UI Standard in SDA, SDA100G, and (bitrate) measured on an eye WaveExpert scopes. PCI Express V TX-CM-ACp CMACp Available with PCIE option.
- Page 178 WavePro 7Zi Parameter Description Definition Notes Available with SDA and ENET options. Amount of jitter due to duty cycle distortion Standard in SDA and WaveExpert scopes. Amount of data dependent Available with SDA option. jitter in a signal Time from trigger to transition: Measures time between trigger and first 50% Time between trigger and...
- Page 179 Operator's Manual Parameter Description Definition Notes single segments of sequence waveforms: time from previous segment's to current segment's trigger; for waveforms produced by a history function: time from first to last accumulated waveform's trigger. Reference levels and edge- transition polarity can be selected. Hysteresis argument used to discriminate levels from noise in Percent of period for which...
- Page 180 WavePro 7Zi Parameter Description Definition Notes (eampl) eye diagram options. Standard in SDA, SDA100G, and WaveExpert scopes. Available with SDA and SDM options. Bit Error Rate estimated from Eye BER an eye diagram Standard in SDA, SDA100G, and WaveExpert scopes. Eye Bit Rate Reciprocal of the duration of Standard in SDA and WaveExpert...
- Page 181 Operator's Manual Parameter Description Definition Notes (eovp) on an eye scopes. Eye Pk Noise Peak-to-peak noise of a level Standard in SDA and WaveExpert (eppn) of an eye diagram scopes. Eye PkPk Jit Peak-to-peak jitter measured Standard in SDA and WaveExpert (eppj) on eye persistence scopes.
- Page 182 WavePro 7Zi Parameter Description Definition Notes Base & Top (% or Enhanced parameter available with absolute) EMC option. Peak-Peak (%) 0V-Min (%) Threshold arguments specify two vertical values on each edge used to compute fall time. Formulas for upper and lower values: lower = lower thresh.
- Page 183 Operator's Manual Parameter Description Definition Notes Reference levels and edge- transition polarity can be selected. Hysteresis argument used to discriminate levels from noise in Half Period Half period of a waveform. data. (hper) Available with JTA2, SDA, and XMAP options. Standard in SDA100G scopes.
- Page 184 WavePro 7Zi Parameter Description Definition Notes WaveExpert, and sampling scopes. Population at bin for Available with DDM2, JTA2, SDM, specified horizontal XMATH, XWAV, CAN02, SDA, and Hist Pop@X coordinate. You can place XMAP options. (pop@x) the cursor at any bin and use Standard in DDA-5005A, SDA100G, either Absolute, Reference, and sampling scopes.
- Page 185 Operator's Manual Parameter Description Definition Notes measurements that are filtered by the selected band- pass filter. Indicates location of right cursor. Cursors are interchangeable: for example, the right cursor may be moved to the left of the left cursor Time from trigger to last Time from trigger to last Last and first will give the location of the...
- Page 186 WavePro 7Zi Parameter Description Definition Notes local feature (lmax - lmin). data. Available with DDM2 option. Standard in DDA-5005A. Hysteresis argument used to Time between events discriminate levels from noise in (between local peak and next data. Local tbe trough or local trough and Available with DDM2 option.
- Page 187 Operator's Manual Parameter Description Definition Notes (ltut) percentage of its peak-to- data. trough amplitude. Available with DDM2 option. Standard in DDA-5005A. Available with XMAP and XDEV option. Produces a parameter using Mathcad a user-specified Mathcad Standard in DDA-5005A. (mcad) function. Mathcad 2001i or later must be loaded on the instrument.
- Page 188 WavePro 7Zi Parameter Description Definition Notes frequency of a waveform Standard in DDA-5005A and (narrow band). SDA100G scopes. Compares the expected Peak-to-peak jitter between time to the actual time of N-cycle Jitter Available in SDA analyzers. edges spaced n UI apart. leading edges n bits apart.
- Page 189 Operator's Manual Parameter Description Definition Notes Available with DDM2, JTA2, XMATH, XWAV, CAN02, SDA, and Number of peaks in a XMAP options. Peaks histogram. Standard in DDA-5005A, SDA100G, and WaveExpert scopes. Gives a similar result when applied to time domain waveform or Peak-to-peak: Difference histogram of data of the same between highest and lowest...
- Page 190 WavePro 7Zi Parameter Description Definition Notes Persist Max Highest vertical value of input Standard in SDA and WaveExpert (pmax) persistence trace. scopes. Persist Mean Standard in SDA and WaveExpert Average of persistence data. (pmean) scopes. Mid level between Maximum Persist Mid Standard in SDA and WaveExpert and Minimum data of a (pmid)
- Page 191 Operator's Manual Parameter Description Definition Notes low frequency waveform (LF)*100 discriminate levels from noise in data. Available in DDM2. Standard in DDA-5005A. Ring Ringback (high or low) Available with SDA parameter. Amount of random jitter Rj Effective Available with SDA parameter. (estimated) in a signal On signals not having two major Time at lower threshold...
- Page 192 WavePro 7Zi Parameter Description Definition Notes found up to maximum of 100 periods. Signal Amplitude Symmetry Available with ENET option. of a 100Base-T signal SD2Skew Calculates the time skew Available with SDA and PCIE (sdskw) between 2 serial data lanes options.
- Page 193 Operator's Manual Parameter Description Definition Notes and N = number of data Standard parameter. points within the periods found up to maximum of 100 periods. Hysteresis argument used to discriminate levels from noise in Average peak-to-trough data. amplitude for all local features.
- Page 194 WavePro 7Zi Parameter Description Definition Notes rectangular waveforms and histograms, result may include represents the higher most contributions from more than one probable state determined acquisition. from the statistical Standard parameter. distribution of data point values in the waveform. Total Jitter Total jitter at a user-specified Available with ENET and SDA (Tj)
-
Page 195: Range Limited Parameters
Standard in SDA, SDA100G, and WaveExpert scopes. Some LeCroy instruments and software packages give you the ability to constrain parameter measurements to a vertically or horizontally limited range, or to occurrences gated by a second waveform. Furthermore, both constraints can operate together. This capability enables you to exclude unwanted characteristics from your measurements. -
Page 196: Waveform Gated Parameters
WavePro 7Zi Note: Depending on whether you select a vertical or horizontal parameter, the correct units will be automatically displayed (V, s, Hz, dB) in the Between and And fields. Or, if you select a simple ratio parameter (such as power factor) that yields a dimensionless number, no units will be displayed. - Page 197 Operator's Manual Proper determination of the top and base reference lines is fundamental for ensuring correct parameter calculations. The analysis begins by computing a histogram of the waveform data over the time interval spanned by the left and right time cursors. For example, the histogram of a waveform transitioning in two states will contain two peaks (see figure).
- Page 198 WavePro 7Zi Time parameter measurements such as width, period and delay are carried out with respect to the mesial reference level (see figure), located halfway (50%) between the top and base reference lines. Time-parameter estimation depends on the number of cycles included within the observation window. If the number of cycles is not an integer, parameter measurements such as rms or mean will be biased.
-
Page 199: Setting Up The Printer
Operator's Manual Moreover, a hysteresis range may be specified to ignore any spurious transition that does not exceed the boundaries of the hysteresis interval. In the figure, Delta c2d- (1, 2) measures the time interval separating the rising edge of the clock (trigger) from the first negative transition of the data signal. Similarly, Delta c2d+ (1, 2) measures the time interval between the trigger and the next transition of the data signal. -
Page 200: Printing A Screen Image
WavePro 7Zi Touch the Hardcopy Area field to choose which part of the screen you want to print from the pop-up menu . Choose Grid Area Only if you do not need to print the dialog area and you only want to show the waveforms and grids. -
Page 201: Sampling Modes
Operator's Manual Depending on your timebase, you can choose either Single-shot (Real Time) Sequence , or mode sampling. Some instruments also offer two other modes: Roll WaveStream Selecting a Sampling Mode Touch Timebase Horizontal Setup from the menu bar. In the Timebase dialog, touch a Sample Mode button. Basic Capture Technique A single-shot acquisition is a series of digitized voltage values sampled on the input signal at a uniform rate. -
Page 202: Roll Mode
WavePro 7Zi The instrument requires multiple triggers to complete an acquisition. The number depends on the sample rate: the higher the sample rate, the more triggers are required. It then interleaves these segments (see figure) to provide a waveform covering a time interval that is a multiple of the maximum single-shot sampling rate. However, the real- time interval over which the instrument collects the waveform data is much longer, and depends on the trigger rate and the amount of interleaving required. -
Page 203: Adjusting Trace Intensity
Operator's Manual Adjusting Trace Intensity knob adjusts the brightness of your trace, with NTENSITY the intensity value displayed in the bottom right-hand corner of the screen: Pushing the knob toggles between WaveStream fast- viewing mode and real-time mode. Note: The knob controls trace intensity only for NTENSITY WaveStream traces. -
Page 204: Recalling Default Settings
WavePro 7Zi To recall scope settings from a saved file, under Recall From File, touch inside the Recall panel from file data entry field and use the pop-up keyboard to enter the path to the source folder. Or touch Browse to navigate to the source folder. - Page 205 Operator's Manual If you are saving to file, touch the Data Format field and select a format type from the pop-up menu Depending on your selection, you may need to touch the SubFormat field and select a subformat. If you select ASCII, touch the Delimiter field and select a delimiter character from the pop-up menu: comma, space, semicolon, or tab.
-
Page 206: Recalling Waveforms
WavePro 7Zi Recalling Waveforms Only .trc files that were saved in binary format can be recalled into the oscilloscope. Touch File Recall Waveform on the menu bar. To recall a waveform from memory, in the Recall Waveform dialog, touch the Recall From Memory button . -
Page 207: Creating A Folder
Where practical or necessary, detail on specific oscilloscope features is included in this manual. Note: LeCroy has a policy of frequently updating software. It is possible that screen images in this manual may not exactly match what you see on your oscilloscope display. However, functionality will be nearly identical. - Page 208 WavePro 7Zi The TD option adds the following capability to the LeCroy oscilloscope software user interface dialogs: If this is the first serial trigger option you have installed on your scope, an additional icon will appear in your trigger dialog box. It...
-
Page 209: Serial Trigger
Both the D and TD options contain powerful protocol decoding and annotation software algorithms. This algorithm is used in all LeCroy serial decoders sold with oscilloscopes, and differs slightly for serial data signals that have a clock embedded in data or a clock separate from data. -
Page 210: Table Display
"Trigger Type" menu in the Trigger dialog, and a new set of dialogs for Decode setup. These dialogs are shared by all the low-speed serial protocols that LeCroy offers, so all serial trigger and serial decoding selections will be grouped into a common selection with nearly identical selection and setup. These dialogs are conveniently accessed with just one or two touches of the screen. - Page 211 Operator's Manual Touch the Channel or Memory Descriptor Box to open the respective dialog box, and touch the Decodebutton in the bottom toolbar. Touch a Channel, Memory, or Math trace to open a pop-up dialog that displays a shortcut to the Decode Setup dialog box There is a great deal of commonality in decode setup among the various serial data standards.
-
Page 212: Decode Setup Dialog
WavePro 7Zi Decode ON Checkbox - If checked, it means the decoder is turned ON and will decode, assuming the protocol is correctly set up in the Decode Setup dialog box. Protocol - This pop-up dialog allows selection of a specific serial protocol. In some cases where the protocol is not completely standardized, or where there are higher- level definitions of the protocol, multiple selections may be provided. - Page 213 Operator's Manual View Table Checkbox - Checking this box turns the Table ON. Un-checking it turns the Table OFF. Note: If the View Decode checkbox is not checked (i.e., decode is not ON), then the View Table checkbox will be grayed out. The Table cannot be displayed unless decode is occurring. When the Table is displayed, it appears similar to that shown to the right (the example shown is for Source Selection - Touch inside the Source fields and choose a source to use for Clock, Data, and (for some protocols) a third line (e.g., Chip Select for SPI).
-
Page 214: Protocol Results Table
WavePro 7Zi Configure Table displays a pop-up dialog box specific to a particular protocol. The pop-up dialog contains checkboxes for various columns in the table. Check the boxes to display that particular column in the table. Export Table exports the complete protocol table data to a user-defined file. The output file name and directory can be selected by the user, using the controls to the right. - Page 215 Operator's Manual Default - Press this button to return to the default state of the table for that particular protocol. BitRate Tolerance - Some protocols have a Bit Rate Tolerance setting. This can be set to any value from 0.01% to 10%. If the bit rate is outside the tolerance range set, then the calculated bit rate will appear as red text in the table.
- Page 216 WavePro 7Zi From the File menu, go to Math, and choose Zoom Setup to turn a zoom ON, define its source, and search directly. Any of these methods will take you to a Zoom dialog box with a right-hand dialog box with Search The Search capability will differ by protocol.
- Page 217 Operator's Manual The I C and SPI serial triggers are accessed from the oscilloscope trigger dialog. This dialog can be accessed in the following ways: Touch the Trigger descriptor label in the lower right hand corner of the oscilloscope display. Or, touch Trigger in the menu bar at the top of the scope display, then select Trigger Setup...
- Page 218 WavePro 7Zi To select a value for any of the conditions, touch the existing value to open the pop-up dialog box with a list of choices, and select one of the choices. The I C Decode Setup Right-Hand Dialog (which is part of the Decode Setup when I C is selected as the Protocol to decode), with detail on the setup conditions, is shown in the images that follow: Viewing - Select to view the protocol data in either Binary, Hexadecimal, or ASCII...
-
Page 219: Setup Mode
Operator's Manual Select either Binary (BIN) or Hexadecimal (Hex) setup mode. The mode selected will propagate through the entire I C trigger setup, You can select BIN mode, and set up the address in binary format, then reselect HEX mode and set up the data in hexadecimal format. - Page 220 WavePro 7Zi Note: There is an identical checkbox selection in the I C decode setup dialog. These two setups are dynamically linked, so selecting it one way in trigger will result in an identical selection in decode. This ensures that the trigger address format matches decoded information on the display.
- Page 221 Operator's Manual Oftentimes, I C utilizes DATA bytes to specify sub-addresses for accessing memory locations in EEPROMs. Conditional DATA trigger allows triggering on a range of DATA bytes that correspond to reads or writes to specific sub-address memory blocks in the EEPROM. It can also aid in monitoring DATA outputs from I based sensors, such as analog-to-digital converters, and triggering when DATA is outside a safe operating range.
- Page 222 WavePro 7Zi Note: All values entered in this field are always in decimal format. Bytes Length Max - If the Data Length Condition (see below) is selected to be either INRANGE or OUT(of)RANGE, then you will also need to specify a maximum data length value (i.e., the upper value of the range you wish to include or exclude)
- Page 223 Operator's Manual The I C and SPI serial triggers are accessed from the oscilloscope trigger dialog. This dialog can be accessed in the following ways: Touch the Trigger descriptor label in the lower right-hand corner of the oscilloscope display. Or, touch Trigger in the menu bar, then Trigger Setup...
- Page 224 WavePro 7Zi The SPI Decode Setup Right-Hand Dialog (which is part of the Decode Setup when SPI is selected as the Protocol to decode), with detail on the setup conditions, is shown in the images that follow: Viewing - Select to view the protocol data in either Binary, Hexadecimal, or ASCII modes.
- Page 225 Operator's Manual Select either Binary (Bin) or Hexadecimal (Hex) setup mode. The mode selected will propagate through the entire SPI trigger setup. Toggling back and forth between the modes will not result in loss of information (binary is used internally as the core format for all triggering and decoding operations); though, use of "don’t care"...
- Page 226 WavePro 7Zi will auto select either Read or Write (as appropriate) and be grayed out as not-selectable by the user. Note: There is an identical checkbox selection in the I C decode setup dialog. These two setups are dynamically linked, so selecting it one way for Trigger will result in an identical selection for Decode.
- Page 227 Operator's Manual data is treated as “Most Significant Byte (MSB) First”. This is especially important to remember when setting up <=, <, >, >=, INRANGE and OUTRANGE comparison. Note: In Hexadecimal format, data must be entered as full bytes even though the minimum required acceptable entry is a nibble.
- Page 228 WavePro 7Zi or OUTRANGE conditional setup). Values can be set from 0-2047 bytes. Setting to -1 creates a Don’t Care condition for data value location. Note: The first byte is counted as Byte 0, not Byte 1. Note: Setting Start Byte to -1 will result in a Don’t Care setting for Start Byte.
- Page 229 Some common Serial Data analysis needs and methods are discussed next. LeCroy oscilloscopes are available with optional very long acquisition memory. For instance, the WaveRunner Xi Series oscilloscopes can capture up to 12.5 Mpts on 4 channels, or 25 Mpts on 2 channels. If your Serial Data signals are 1 Mb/s, and you sample at the minimum required and available sample rate (5 MS/s, you would be able to capture 5 seconds of Serial Data traffic.
-
Page 230: Storing Triggers
LeCroy oscilloscope for later analysis. Even though the LeCroy oscilloscope hard drives are very large, it is a good idea to make sure that your trigger condition is set correctly before beginning your acquisitions. Note: This method is not guaranteed to capture all of your trigger events, since there will be a large amount of “dead time”... - Page 231 Operator's Manual In the Sampling Mode area, select Sequence mode. A tab labeled “Sequence” will appear next to the Timebase tab. Touch that tab. In the Sequence tab, select a display mode. Select the number of segments to be displayed at one time.
- Page 232 WavePro 7Zi To display an individual segment separately from the main channel display, select Math, Math Setup from the menu bar, and choose a math trace to define as a Segment (in this case, we chose to define F1 as a Segment of C2).
- Page 233 Operator's Manual To maximize display space, you could turn off the Channel and just select the segment that you wish to view. WP700Zi-OM-E-RevA...
- Page 234 WavePro 7Zi To view the time stamps for each segment, select Vertical, Channels Status in the menu bar, then in the "Show Status For" portion of the dialog, select Time (as shown to the right). Then, you will see a display of time stamp information for each segment in the sequence acquisition, as shown below: 10.
-
Page 235: Timebase Setup And Control
Operator's Manual Set up the timebase by using the front panel Horizontal controls. Setting up additional timebase setup and controls Touch Timebase Horizontal Setup. The Timebase dialog opens. Touch inside the Time/Division data entry field and enter a value using the slider bar at the bottom of the window. -
Page 236: Autosetup
Auto Setup in the Vertical, Timebase, or Trigger drop-down menu. LeCroy's Real Time (SMART) Memory feature ensures the highest time resolution for the time window displayed, without aliasing. Real Time Memory provides these advantages: Acquisition memory is automatically allocated as needed. - Page 237 Operator's Manual In the menu bar, touch Measure Measure Setup. Touch one of parameter tabs P1 through P12. Touch inside the Source1 data entry field and select an input waveform from the pop-up menu. Touch inside the Measure data entry field and select a parameter from the pop-up menu. Touch the Trend button at the bottom of the dialog;...
- Page 238 WavePro 7Zi Touch the newly displayed Track math function trace label if you want to change any settings in the Track dialog: The triggers available to you are defined as follows: Edge A simple trigger, Edge trigger is activated by basic waveform features or conditions such as positive or negative slope, and holdoff.
- Page 239 Operator's Manual Qualified First Not available on all scopes, Qualified First trigger is intended to be used exclusively in Sequence Mode to speed up the trigger rate. With Qualified First trigger, a single valid trigger is sufficient to acquire a full sequence.
-
Page 240: Aux Input Trigger
For SDA 9000/11000/18000 analyzers, Software Assisted Trigger provides a quick way to create eye diagrams without the involvement of LeCroy’s in-depth serial data analysis software. You can get a quick view of your signal and do the analysis whenever you wish. -
Page 241: Trigger Types
Operator's Manual Note: The following selections must be made to use the Software Assisted Trigger feature. Edge trigger type. Normal trigger mode. Software Assisted Trigger Setup Make the following settings from the Software Assisted Trigger tab. Touch the Enable checkbox to start software assisted triggering. Create a trigger window by entering a Hysteresis value. -
Page 242: Trigger Settings
WavePro 7Zi The next waveform figure has software-assisted triggering enabled. The red trace is aligned with the trigger point, indicated by the red marker below the grid. The white trace is the waveform at the input to software-assisted trigger processing. Notice how the white trace is the same as the previous figure. The next figure shows a waveform outside the horizontal gate region (the closest positive edge is not within +/-1 ns). -
Page 243: Edge Trigger Setup
Operator's Manual Alternatively, in the Trigger dialog, you can touch inside the Level field and type in a value using the pop- up numeric keypad. Quickly set a level of zero volts by touching the Zero Level button. An arrow on the right side of the grid shows the threshold position. This arrow is only visible if the trigger source is displayed. -
Page 244: Width Trigger
WavePro 7Zi Choose Positive, Negative, or Either from the slope choices. Note: Use the TriggerScan tab to run the Trainer (a wizard-like tool to configure triggers), Save, and Load trigger setups for reuse. How Width Trigger Works Width trigger allows you to define a positive or negative-going pulse that is width bounded by a voltage level, above or below which a trigger will occur. -
Page 245: Qualified Trigger
Operator's Manual Click the keypad button on the slider bar to enter values using the pop-up keypads. Touch the Default button to use preset values. Touch the Out Of Range button and perform the same range setups as for In Range triggering. Note: Use the TriggerScan tab to run the Trainer (a wizard-like tool to configure triggers), Save, and Load trigger setups for reuse. -
Page 246: Qualified First Trigger
WavePro 7Zi Qualified First Trigger Not available on all scopes, Qualified First trigger is intended to be used exclusively in Sequence Mode to speed up the trigger rate. With Qualified First trigger, a single valid trigger is sufficient to acquire a full sequence. Other than in Sequence Mode, Qualified First is identical to the Qualified triggers. -
Page 247: How Pattern Trigger Works
Operator's Manual Use the Event 'A' Edge tab to make Source, Coupling, Slope (positive or negative), and Level selections. Add a level value using the slider bar's value slider, pop-up keypad button, or Default button. Use the Event 'B' Edge tab to make Source, Coupling, Slope, and Level selections (done same as previous step). -
Page 248: Pattern Trigger Setup
WavePro 7Zi Pattern Trigger Setup Touch the Trigger descriptor label. In the Trigger Type dialog, touch the Pattern trigger button. If you want to hold off the trigger (either in time or events) when the pattern becomes true, touch one of the Holdoff By: buttons on the Holdoff tab. -
Page 249: Tv Trigger
Operator's Manual Touch inside the corresponding Level data entry field for each input included in the pattern, and enter a voltage level threshold, using the slider bar at the bottom of the window. Click the keypad button on the slider bar to enter a value using the pop-up keypad. Touch the Default button to use preset values. -
Page 250: Custom Tv Standard Trigger Setup
WavePro 7Zi Touch inside # of Fields and make a selection (1 to 8) from the pop-up menu. Touch inside the Line field and enter a line number using the slider bar at the bottom of the window. Click the keypad button on the slider bar to enter a value using the pop-up keypad. -
Page 251: Smart Triggers
Operator's Manual Touch inside Interlace and select an interlacing factor from the pop-up menu. Note: A selection from this menu of 1:1 will reset the # of Fields selection to 1, since interlacing does not apply to a single field. The maximum allowable interlace factor is equal to the # of Fields set. Use the Trigger On section of the dialog to configure the trigger for ANY line (using the checkbox) or a specific Line, Field, and Level value. -
Page 252: Glitch Trigger
WavePro 7Zi How Glitch Trigger Works Glitch trigger can be used to catch glitches. You can specify a pulse width or a pulse width range. Pulse smaller than selected pulse width: Set a maximum pulse width. This glitch trigger is generated on the selected edge (positive or negative) when the pulse width is less than or equal to the set width. -
Page 253: Interval Trigger
Operator's Manual Touch inside the Level data entry field and enter a value using the slider bar at the bottom of the window. Click the keypad button on the slider bar to enter a value using the pop-up keypad. Touch the Default button to use a preset value. - Page 254 WavePro 7Zi Interval Greater Than: For this Interval Trigger, generated on an interval larger than the one that you set, select a minimum interval between two edges of the same slope. The instrument generates the trigger on the second edge if it occurs after the set interval. The timing for the interval is initialized and restarted whenever the selected edge occurs.
-
Page 255: Interval Trigger Setup
Operator's Manual Interval Trigger Setup Touch the Trigger descriptor label. If applicable, touch the Smart trigger button , and then the Interval trigger button Touch inside the trigger Source field and select a source on which to trigger. If available, touch inside the Coupling field and select a coupling mode.IndexTriggerCoupling Touch inside the Level data entry field and enter a value using the slider bar at the bottom of the window. -
Page 256: Dropout Trigger
WavePro 7Zi the bottom of the window. Click the keypad button on the slider bar to enter values using the pop-up numeric keypads. Touch the Default button to use preset values. Touch the Limits button to set up a precise range. Touch inside the Lower Limit and Upper Limit data entry fields and enter values using the slider bar at the bottom of the window. -
Page 257: Runt Trigger
Operator's Manual If available, touch inside the Coupling field and select a couplingmode. Select Positive or Negativepolarity. Touch inside the Trigger after timeout if NO edge within data entry field and enter a time value using the slider bar at the bottom of the window. Click the keypad button on the slider bar to enter a value using the pop-up numeric keypad. -
Page 258: Slew Rate
WavePro 7Zi Touch inside the Level data entry field and enter a value, using the pop-up keypad. Select Positive or Negativepolarity. Touch the Less Than button on some oscilloscopes and enter a pulse-width value in the Upper Limit field using the slider bar at the bottom of the window. Click the keypad button on the slider bar to enter a value using the pop-up keypad. -
Page 259: Slew Rate Trigger Setup
Operator's Manual Slew Rate Trigger Setup Touch the Trigger descriptor label. Touch the Smart trigger button, and then touch the Slew Rate trigger button. Touch inside the trigger Source field and select a source on which to trigger. If you select an external trigger source, you also need to set a coupling mode. -
Page 260: Trigger Modes
WavePro 7Zi the Limitsbutton to set up a precise pulse-width range by setting Lower Limit and Upper Limit values, using the slider bar, pop-up keypad button, or the Default button. Touch the Out Of Range button on some oscilloscopes and perform the previous part of this step for In Range triggering. -
Page 261: Trigger Source
Operator's Manual Figure 4-24. Edge trigger works on the selected edge at the chosen level. The slope (positive or negative) is specified in the Trigger label permanently displayed below-right of the grid. Some instruments include the choice of Window slope, which sets a threshold above and below the trigger level beyond which the signal must pass to generate a trigger. -
Page 262: Hold Off By Time
WavePro 7Zi Hold Off by Time Sometimes you can achieve a stable display of complex, repetitive waveforms by placing a condition on the time between each successive trigger event. This time would otherwise be limited only by the input signal, the coupling, and the instrument's bandwidth. -
Page 263: Triggerscan
Operator's Manual TriggerScan is a debugging tool that helps you quickly find rare waveform glitches and anomalies. With TriggerScan, you can build a list of trigger setups to look for rare events and automatically sequence through each one. TriggerScan can use any type of trigger setup available including edge, width, and qualify as well as Smart Triggers (such as, glitch and runt triggers). -
Page 264: Starting Triggerscan
WavePro 7Zi Starting TriggerScan After you have run the Trainer, the Trigger List displays a list of smart trigger setups. You can add or remove trigger setups. You can also update the selected smart trigger setup. Once you have made any changes to the Trigger List, you are ready to start scanning. -
Page 265: Saving Triggerscan Setups
Operator's Manual You can tune the dwell time that the scope will wait before loading the next trigger setup using the Dwell Time data entry field. If you have Persistence display mode enabled, all trigger events are recorded on the display. Refer to the Persistence Setup topic for instructions on enabling Persistence display mode. -
Page 266: Configuring The Remote Control Assistant Event Log
WavePro 7Zi If you are using TCPIP, press the Net Connections button; the Windows Network Connections window opens.You can reconfigure the oscilloscope's connection if it is already connected to the network or make a new connection. Note: Your instrument allows you to restrict remote control access to certain clients. To restrict access, under Security, touch the Yes button and enter the IP addresses or domain name server names you want to restrict separated by a comma. -
Page 267: E-Mail
Operator's Manual Touch the Colors field and choose Standard to print the screen as it appears, Print to print the waveforms on a white background, or Black & White to print the waveforms in black & white. Note: Choosing Print colors saves printer toner/ink. Touch inside the File Name data entry field and enter a name for the display image, using the pop-up keyboard. -
Page 268: Setting Up Auxiliary Output
WavePro 7Zi Button: Description: Trigger Out — can be used to trigger another scope. DC level — a reference level Trigger Enabled — can be used as a gating function to trigger another instrument when the scope is ready Pass/Fail — allows you to set a pulse duration from 1 ms to 500 ms; generates a pulse when pass/fail testing is active and conditions are met. -
Page 269: Setting The Date And Time From Windows
From the Options tab on the Utilities dialog, you can add or remove software options. For information about software options, contact your local LeCroy Sales and Service office, or visit our Web site at http://www.lecroy.com/options. Options that you purchase add performance to your instrument. This added performance is seen in the new math functions or parameters that you can choose from when doing Measure or Math setups. -
Page 270: Enabling Auto-Calibration
WavePro 7Zi Enabling Auto-calibration You can choose to have your instrument automatically recalibrate itself whenever there is a significant change in ambient temperature. If you do not enable this option, the oscilloscope recalibrates only at startup and whenever you make a change to certain operating conditions. Touch Utilities Preferences on the menu bar. -
Page 271: Acquisition Status
This button on the Utilities Setup dialog provides access to service dialogs, which are for the sole use of LeCroy service personnel. A security code is required to gain access. Touch the Show Windows Desktop button on the Utilities Setup dialog to minimize the instrument application. -
Page 272: Adjusting Sensitivity
Touch inside the Coupling field and select a coupling mode from the pop-up menu. Setting up Probe Attenuation LeCroy's ProBus system automatically senses probes and sets their attenuation for you. If you want to set the attenuation manually, In the menu bar, touch Vertical, then select a channel from the drop-down menu. -
Page 273: Bandwidth Limits
Operator's Manual Touch inside the Probe Atten.data entry field . Touch a divide-by menu selection or touch Var (variable). If you choose Var, type in a value using the slider bar or the pop-up numeric keypad. Reducing the bandwidth also reduces the signal and system noise, and prevents high frequency aliasing. Setting Bandwidth Limits Set bandwidth limits as follows: In the menu bar, touch Vertical, then select a channel from the drop-down menu. -
Page 274: Enabling Variable Gain
WavePro 7Zi Enabling Variable Gain Touch the descriptor label for the waveform whose gain you want to vary. Touch the Variable Gain check box. Unlike the Deskew math function, channel Deskew does no resampling, but instead adjusts the horizontal offset by the amount that you enter. -
Page 275: Dark Calibration
Dark calibration will be performed, and the dark level will appear in the Dark Cal Level field. The Advanced Optical Recording Measurement (AORM) package for LeCroy digital oscilloscopes provides a set of waveform measurements and mathematical functions for the analysis of optical recording signals. Parameter measurements allow the categorizing and listing of measurement values in a variety of ways. -
Page 276: Bes Or Ees Table
WavePro 7Zi Parameters allow measurements of the section of waveform lying between the parameter cursors. The position of the cursors can be set by dragging, entering an exact value in the "Standard Cursors" dialog, or by means of the front panel knobs. When you enable tracking by checking the Track checkbox, you can move the URSORS parameter cursors across the waveform so that measurement results can be taken on different sections of the waveform. - Page 277 Operator's Manual Field Description View Allows you to quickly select the most common views, with graphing. WP700Zi-OM-E-RevA...
- Page 278 WavePro 7Zi Measurement Selects the primary measurement to be made. In the Parameter view, the result for the selected measurement is displayed along with other parameters. Units The units used for the horizontal parameter results. Absolute refers to time or voltage units. Percent refers to results being calculated as a percent of the clock period.
- Page 279 Operator's Manual Threshold, which precludes measurements of noise or other perturbations within this band. The width of the band is specified in divisions. Guidelines for Use 1. Hysteresis must be larger than the maximum noise spike you want to ignore. 2.
- Page 280 WavePro 7Zi This can be a channel, math Clock Source function, or memory trace. Choose Pos, Neg, or Near. “Near” Clock Slope means the nearest clock edge to the data edge. Size of the hysteresis band (in screen divisions) with the level at the center of the band.
- Page 281 Operator's Manual View Displays Additional Functions The source traces will be displayed along with the custom parameters (see Statistics: toggles the parameter statistics Parameter Measurements Table). If two traces are to be on/off. displayed, dual grids will be drawn. Find Center And Width: determines the best When Histogram is selected, a histogram of scaling for the histogram based on up to the last the selected parameter is displayed in a...
-
Page 282: Selecting The Histogram Function
WavePro 7Zi The following guidelines provide a description of the oscilloscope’s operational features for defining, using, and analyzing histograms. The sequence of steps is typical of this process. Selecting the Histogram Function Histograms are created by graphing a series of waveform parameter measurements. The first step is to define the waveform parameter to be histogrammed. -
Page 283: Setting Binning And Histogram Scale
Operator's Manual increase beyond that which can be displayed on screen using the current vertical scale, this scale is automatically increased in a 1-2-5 sequence. LinConstMax sets the vertical scaling to a linear value that uses close to the full vertical display capability of the scope. -
Page 284: To Configure A Trend
WavePro 7Zi To Configure a Trend: From the menu bar select Math, then Math Setup… from the drop-down menu. Touch an Fx tab that is not currently assigned a math function (i.e., Zoom function by default). Touch inside the Source1 field and select a source waveform from the pop-up menu. Touch inside the Operator1 field and select Trend from the Select Math Operator pop-up menu. -
Page 285: Trend Calculation
Operator's Manual of trend data is a memory, storing new data to memory effectively acts as a trigger and acquisition. Because updating the screen can take significant processing time, it occurs only once a second, minimizing trigger dead time (under remote control the display can be turned off to maximize measurement speed). Parameter Buffer The parameter buffer allows you to include up to one million values in the trend calculation. -
Page 286: Configuration Options
WavePro 7Zi Pit moda Pit number Pit res Pit top Pit width T@pit Timj All configuration options are available for each parameter, except as noted in this table: Parameter Range of nT Subject nT Dp2c Dp2cs BEES BESS EESS EDGSH Pit asym Pit base Pit max... - Page 287 Operator's Manual Display the AORM dialog by touching Analysis in the menu bar at the top of the screen and selecting AORM Measurements… from the drop-down menu. Touch inside the View field and select a graph display from the pop-up menu.
- Page 288 WavePro 7Zi Touch inside the Measurement field and select a measurement from the pop-up menu. Besides the parameters included in this menu, others are available from the Select Measurement menu, accessible from the "Measure" dialog. To identify pits or spaces, thresholds and hysteresis are set. Touch inside the Data Source field and select a signal source.
- Page 289 Operator's Manual Touch inside the Data Gate field and select a signal source. You can also select None. Data Gate specifies the input that will be used to determine where to perform measurements on the input signal. If a Data Gate is selected, the level is assumed to be high.
- Page 290 WavePro 7Zi For BES, EES, BEES, BESS, and EESS, this specifies the pit of interest. The results will be computed for each space/pit (pit/space) pair using the subject pit and all the spaces within the range specified. Specifies the range of n indices that define the pits/spaces used in the calculation. The range of n coupled with T are used to categorize the pits/spaces based on their widths.
- Page 291 Operator's Manual The hysteresis band divides the display into three zones. The ORM Package uses both the voltage threshold and hysteresis settings to identify pits and spaces. Criteria for identifying a “feature” (pit or space): The first feature identified after the left parameter cursor can be either a pit or space. If the signal first enters Zone 1, the first feature identified (if additional constants are met) will be a pit.
-
Page 292: Description
WavePro 7Zi Description BES provides a measurement of the time between the beginning edge of the subject n in a specified space/pit pair and the nearest specified clock edge. The measurement is calculated between the points where the data and clock signals cross selected voltage thresholds. -
Page 293: Display Options
Operator's Manual Figure 5-2. Zoom of Positive Polarity Pit Edge -- example measurement Figure 5-4. The measurement has configurable units. If absolute time is specified, the value is simply the time indicated above. If percent is specified, the value of the measurement is the time normalized to the clock period: For all pits, a valid measurement will be obtained only when both pit/space edges can be determined, (that is, there is a hysteresis-qualified threshold crossing beginning and ending the pit/space pair of interest between the... -
Page 294: Description
WavePro 7Zi Description BESS provides a measurement of the mean, normalized standard deviation of the Beginning Edge Shift measurements (see BES). When a single n is specified, or when you are in ‘nT Table’ Show mode, the value calculated for the nth index is calculated using the following equation for standard deviation: Beginning Edge Shift Sigma cannot be calculated for a given index n unless there are at least two Beginning Edge Shift values calculated or that n index. -
Page 295: Description
Operator's Manual Description EES provides a measurement of the time between the ending edge of the subject n in a specified space/pit pair and the nearest specified clock edge. The measurement is calculated between the points where the data and clock signals cross selected voltage thresholds. -
Page 296: Display Options
WavePro 7Zi Figure 5-6. Zoom of Positive Polarity Pit Ending Edge -- example The measurement has configurable units. If absolute time is specified, the value is simply the time as indicated above. If percent is specified, the value of the measurement is the time normalized to the clock period: For all pits, a valid measurement will be obtained only when both pit/space edges can be determined (that is, there is a hysteresis-qualified threshold crossing beginning and ending the pit/space pair of interest between the parameter cursors), and there is a clock edge of both polarities surrounding the ending pit or space edge between... -
Page 297: Display Options
Operator's Manual Ending Edge Shift Sigma cannot be calculated for a given index n unless there are at least two Ending Edge Shift values calculated for that n index. When Ending Edge Shift is configured as a custom parameter with a range of n, the value calculated is the standard deviation of the distribution that results by normalizing each independent distribution categorized by the space (pit) nT following the subject pit (space). -
Page 298: Display Options
WavePro 7Zi CLOCK DATA SLOPE EDGE Positive Negative times between edges of positive polarity times between edges of negative polarity Positive subject pit and nearest positive clock edge subject space and nearest positive clock edge times between edges of positive polarity times between edges of negative polarity Negative subject pit and nearest negative clock edge... -
Page 299: Description
Operator's Manual DISPLAY TYPE VALUE DISPLAYED (spaces) that are preceded and followed by the specified space (pits) for the last acquisition. Histogram graph of the values of the beginning and ending edge shift calculated for all Histogram subject pits (spaces) that are preceded and followed by the specified space (pits) for all Function acquisitions since the last CLEAR SWEEPS operation. -
Page 300: Display Options
WavePro 7Zi Figure 5-9. Zoom of Positive Polarity Pit Edge - example measurement The measurement has configurable units. If absolute time is specified, the value is simply the time as indicated above. If percent is specified, the value of the measurement is the time normalized to the local clock period. The local clock period is calculated as the time between the two clock edges bracketing the clock edge used for the delta time measurement: For all pits, a valid measurement will be obtained only when both pit/space edges can be determined (that is,... -
Page 301: Description
Operator's Manual Description Dp2cs provides a measurement of the mean, normalized standard deviation of the Delta Pit-to-Clock measurements (see Dp2c). When a single n is specified, or in ‘nT Table’ Show mode, the value calculated for the nth index is calculated using the following equation for standard deviation: Delta Pit-to-Clock Sigma cannot be calculated for a given index n unless there are at least two Delta Pit-to-Clock values calculated for that n index. -
Page 302: Description
WavePro 7Zi Description Edge Shift provides a measurement of the difference between the width of pits, spaces, or both, and their ideal widths. These ideal widths are integer multiples of the clock period ‘T’. The width of the pit or space is determined by the time between crossings of the selected voltage threshold (see pwid). -
Page 303: More On Edge Shift
Operator's Manual Example The example shows the CD data signal measured at the selected voltage threshold containing, in sequence, a 5T pit, 3T space, 3T pit and 4T space. If the clock period ‘T’ is 231.5 ns, then the 5T and 4T edge shift value is simply the difference between the width calculated and the ideal width (since there is only one pit/space of that ‘nT’... -
Page 304: Description
WavePro 7Zi The Edge Shift parameter takes on each of these distributions separately. For each distribution, the ideal width (nT) is subtracted from the pit widths and the difference is calculated in percent. As a result, the Edge Shift distributions are calculated, as shown in the next figure. The 3T, 4T, and 5T distributions are obtained when the Edge Shift custom parameter is configured for single n values and histogrammed. -
Page 305: Description
Operator's Manual Example Histogramming the local period jittery clock signal shows that there are two frequency modes, one at a period of about 292 ns and the other at around 308 ns. Description Pit Average Amplitude provides a measurement of the average amplitude of pits and spaces. The calculation is performed by calculating the difference between the average value of the base (pbase) for spaces of a particular ‘nT’... -
Page 306: Description
WavePro 7Zi When the parameter paa is configured for 3T widths, the measurement result is also 47.2 mV. This value is calculated automatically. Description Pit Asymmetry provides a measurement of the asymmetry of the middle voltage level for the high nT index pits/spaces compared to the middle voltage level of the low ‘nT’... -
Page 307: Display Options
Operator's Manual Example This persistence plot of a bandwidth limited, smooth waveform illustrates asymmetry. Notice that the mid-level of the 3T waveform is offset from 0 V, and that the mid-level of the 11T waveform is approximately 0 V. Since the 3T middle level is offset, the expected asymmetry value is negative. -
Page 308: Description
WavePro 7Zi Example This persistence waveform is created by setting a SMART Trigger® to capture only 4T spaces. The 4T base computed is - 27.0 mV. When the same measurement is taken with the parameter cursors, it confirms that -27.0 mV is a reasonable value for the base. -
Page 309: Display Options
Operator's Manual Display Options ORM parameter calculations can be displayed, histogrammed and trended in a variety of ways. The table provides a concise description of the value or values displayed using each approach. DISPLAY TYPE VALUE DISPLAYED All values of the maximum for all pits within the selected ‘nT’ range for the last Parameter Statistics Off acquisition. -
Page 310: Display Options
WavePro 7Zi measurement provides the weighted average midpoint based on the number of occurrences of each ‘nT’ pit/space width. The measurement value can be used to determine not only the differences of the midpoint of different ‘nT’ width pits, but also the overall best data waveform voltage threshold setting to use for all ORMs. Display Options ORM parameter calculations can be displayed, histogrammed, and trended in a variety of ways. -
Page 311: Description
Operator's Manual Description Pit Minimum provides a measurement of the minimum voltage value of pits of interest, and a comparison of how the minimum point in the waveform corresponds to the ptop value. When pmin is configured as a custom parameter, all minimums within the single nT or range of nT are calculated. -
Page 312: Description
WavePro 7Zi Description Pit Modulation Amplitude provides a measurement of the ratio of the Pit Average Amplitude (paa) for the low ‘nT’ pits/spaces in the data signal to the Pit Top (ptop) of the high ‘nT’ pits in the data signal: The low and high ‘nT’... -
Page 313: Description
Operator's Manual In the second, the cursor reads the difference between the 11T top and base of 67.2 mV. In the third plot, the cursor reads the difference between the 3T top and base of 47.2 mV. The last plot shows the waveform with the parameters calculated automatically. -
Page 314: Display Options
WavePro 7Zi Display Options ORM parameter calculations can be displayed, histogrammed, and trended in a variety of ways. The table provides a concise description of the value or values displayed using each approach. DISPLAY TYPE VALUE DISPLAYED Parameter Single value of the total number of pits/spaces within the selected ‘nT’ range for the last acquisition. -
Page 315: Display Options
Operator's Manual The low and high ‘nT’ values for performing the calculation must be provided by the user through the associated measurement configuration options. The value shown is in units of percent. The measurement calculation is compliant with the definition of Pit Resolution as defined by IEC 13549:1993 Section 15.3.1. Display Options ORM parameter calculations can be displayed, histogrammed, and trended in a variety of ways. -
Page 316: Description
WavePro 7Zi Description Pit Top provides a measurement of the best estimate of the top amplitude of a pit. The concept of the top calculation is to automatically provide the same measurement which would be obtained from a persistence plot. The top of each pit is determined through histogramming techniques described in detail under Base and Top Calculation... -
Page 317: Description
Operator's Manual When the same measurement is taken with the parameter cursors, it confirms that 25.8 mV is a reasonable value for the top. Description Pit Width provides a measurement of the width of pits or spaces or both. The width of the pit or space is determined by the crossing of the selected voltage threshold. - Page 318 WavePro 7Zi Example 1 The example shows that, measured at the selected voltage threshold, the CD data signal contains sequentially a 5T pit, 3T space, 3T pit, and 4T space. If the measurement is configured to select only 3T pits or spaces then the value displayed will be: pwid = (694 ns + 696 ns) / 2 = 695 ns Example 2: Histogramming...
- Page 319 Operator's Manual In normal trigger mode, multiple waveforms are acquired and processed. The histogram will typically have data that is not well centered or is off screen. Touch the FIND CENTER AND WIDTH button to see the pit width distributions as they accumulate. After enough measurements have been taken, stop the triggering. After the histogram has been centered, the screen will look as follows: The optical data waveform is on the top and the histogram is on the bottom.
-
Page 320: Description
WavePro 7Zi Description The Time-at-Pit parameter provides the time of each leading edge of every pit or space within the nT range specified from the trigger point (time = 0). The value displayed is the time of the first pit only. The usefulness of this parameter is not in the displayed value, but in its trending. - Page 321 Operator's Manual The trigger is set up to trigger on a pit edge and is operated in single-shot mode. For convenience, the waveforms are ordered on the screen in a particular manner: 1. F2: Trend of t@pit 2. F1: Trend of pwid 3.
-
Page 322: Description
WavePro 7Zi Using time cursors, it can be seen that the beginning of this problematic pit width occurred at pit # 973, 859.61 Ps from the trigger. This smaller- than-normal pit is 245.40 ns. Now that a problem has been identified, we would like to view the portion of the waveform in which the problem occurred. -
Page 323: Display Options
Operator's Manual The measurement calculation is compliant with the definition of Timing Jitter as defined by ISO/IEC JTC1.23.14517 Section 22.4. Display Options ORM parameter calculations can be displayed, histogrammed, and trended in a variety of ways. This table provides a concise description of the value or values displayed using each approach. DISPLAY TYPE VALUE DISPLAYED Parameter... -
Page 324: More About Timing Jitter
WavePro 7Zi More About Timing Jitter In order to understand the operation of the timing jitter parameter with different modes of operation, consider the histogram of 3T to 5T pit widths in the next figure. The Timing Jitter parameter considers each of these distributions separately. For each distribution the standard deviation is calculated. -
Page 325: Choice Of Signals
Operator's Manual The value displayed on the custom parameter line (with statistics off) is the sigma of any of the resulting distributions for the last acquisition only. This timing jitter value is calculated internally without having to actually histogram the values. The values displayed in nT Table mode are the sigma of the width distributions resulting from each nT distribution for the last acquisition. - Page 326 WavePro 7Zi value determined in this manner is available in the circuit, the threshold signal, along with the optical recognition data signal itself, should be acquired. Waveform math can then be used to subtract the threshold signal. This is done by defining a trace as the Arithmetic Difference of the raw data signal and the threshold signal. The new trace is then used as the optical recognition data signal in the parameter calculations.
- Page 327 Operator's Manual In math setup, F1 is defined as the trend of the ptop parameter and F2 as the trend of the pwid parameter. Because we are expecting 1800 pits/spaces, make sure that for each math setup the trends are set to use up to 20,000 values.
- Page 328 WavePro 7Zi The XY plot has been adjusted so that all of the pit tops are displayed vs. Pit width. Notice that all of the pit widths form clusters. Press trigger, and the clusters will become even more dense. You ORMAL can have up to 20,000 points in the XY plot.
- Page 329 Operator's Manual Note on RIS (Random Interleaved Sampling) RIS is a mechanism used by the oscilloscope to increase the effective sample rate by interleaving samples taken over multiple waveform acquisitions. The scope enters RIS mode automatically when the time/div setting is set extremely low.
- Page 330 2.5 V, the lowest bin is within the allowable tolerance. However, because of its proximity to this tolerance and the degree of the bin’s separation from all other values, additional investigation may be desirable. LeCroy digital oscilloscopes generate histograms of the parameter values of input waveforms. But first, the following must be defined:...
-
Page 331: Histogram Parameters
Operator's Manual The measurement range of the histogram The number of bins to be used Once these are defined, the oscilloscope is ready to make the histogram. The sequence for acquiring histogram data is: 1. trigger 2. waveform acquisition 3. parameter calculations 4. - Page 332 WavePro 7Zi avg average of data values in histogram fwhm full width (of largest peak) at half the maximum bin fwxx full width (of largest peak) at xx% the maximum bin hampl histogram amplitude between two largest peaks hbase histogram base or leftmost of two largest peaks high highest data value in histogram hmedian median data value of histogram hrms rms value of data in histogram...
-
Page 333: Example
Operator's Manual Example In the next figure, a histogram of the voltage value of a five-volt amplitude square wave is centered around two peak value bins: 0 V and 5 V. The adjacent bins signify variation due to noise. The graph of the centered bins shows both as peaks. - Page 334 WavePro 7Zi Where: Equalized – applies a low pass filter with boost to the input data. This should not be used if the input data is already equalized (filtered). Leveled – Applies the filter (if the input data is raw RF) and then subtracts the sliced threshold from it. Sliced –...
-
Page 335: Slicer
Operator's Manual The Slicer is a 1st order integrating slicer with a programmable closed loop bandwidth (e.g., 5 kHz for 1x DVD as specified in DVD-R Annex G and DVD Annex H). Besides producing the sliced data, the slicer can output the difference of the input signal and the slicer threshold level. -
Page 336: Operational Notes
WavePro 7Zi 1951.22. This is far above the maximum it is reasonable to use. See the note on computation time under "Operational Notes" below. "Acquisition too small to apply EQ filters": The valid region of the waveform is reduced by EQ spacing on each side. -
Page 337: Leveled
Operator's Manual Figure 5-10. Simulation result showing transfer function of the digital low-pass filter and 3-tap EQ (boost) filter, set to 8.2 MHz cutoff frequency and 3.2 dB boost. There are no additional conditions to produce leveled data. The threshold is calculated and subtracted even if the equalization could not be applied for the reasons previously explained. -
Page 338: Sliced
WavePro 7Zi Figure 5-11. Leveled DVD data, with cursors showing the approximate hysteresis requirements for Sliced data. The slicer produces waveforms that are exactly five divisions high. Each edge has two samples that are between the high and low levels and are positioned 2.5 divisions apart such that the zero cross time of the sliced output edge is the same as the zero cross time of the leveled data. - Page 339 Operator's Manual Figure 5-12. PLL closed-loop transfer function when "PLL BW" is set to 9 kHz. The bandwidth of any PLL is a trade-off between jitter (phase noise) and desirable properties like a wide locking range and fast tracking. The "lock range" is the maximum frequency step for which the PLL can acquire lock without slipping a cycle.
- Page 340 WavePro 7Zi may be too spread out from detectable peaks in the distribution. (See How the Starting VCO Frequency is Determined for more details.) Example: CD data has T = 231 ns, about 4.33 MHz. We can extract the clock from CD data at 100 MS/s (23x) and 200 MS/s (46x) or 250 MS/s (58x).
- Page 341 Operator's Manual each edge of the extracted clock signal has four samples between the top and base. These samples are placed proportional to phase, so that the edge crosses 0 at exactly 0 and 180 degrees VCO phase. The phase steering target for the VCO is, roughly speaking, that the data transitions should happen on the falling edge of the VCO output.
-
Page 342: Description Of Encoding And Decoding
15 μs or so; the frequency shift during this time is very small, on the order of 0.1%, as the phase adjusts. The new LeCroy Serial Bus Analyzer ("SBA" option key) features: Powerful search capability allows captured waveforms to be searched for a user-defined sequence of symbols. - Page 343 Operator's Manual following character being transmitted will be selected from the symbol table with a “0” or negative Running Disparity. As the above diagram shows, decoding a digital waveform requires the capture of the waveform in a real-time or sampling oscilloscope, followed by parsing of the digital data in 10-bit increments until certain characters (symbols) are detected.
- Page 344 WavePro 7Zi For PCI Express, on the other hand, a compliant device issues a “Polling” or “Compliance” pattern in each of its lanes to indicate that the device is operational. The polling pattern is composed of the following sequence of symbols: Symbol K28.5...
- Page 345 Operator's Manual Select Analysis from the SDA menu, then Serial Bus (SBA)… from the drop-down menu. Touch the Decode Setup tab. Select a signal Source: a Channel, Memory location, or Math trace. Up to four individual traces can be loaded. Enter the bit rate for the signal under test.
- Page 346 WavePro 7Zi The Z1 display is zoomable independent of the source file. Whenever Z1 is chosen, the symbol search applies to the source and symbol files where Z1 is defined. In order to switch to a different source file, touch the SBA Setup… button in the Z1 dialog and configure the source and symbol files.
- Page 347 Operator's Manual The output file can be opened in Microsoft Excel and will have the following format: The fields contain Index, Time, Hex Data, Length (number of bytes), Name of Primitive, Running Disparity count (P=positive, N=Negative, Z= Neutral) and the Symbolic (encoded) data. CustomDSO, in its Basic mode, allows you to create DSO setups that can be called by the touch of a single button.
- Page 348 In the example used here, three setup files were made, called CustomA.lss, CustomB.lss and CustomC.lss. Fragments from all three are shown below. 1160 Set CustomDSO = XStreamDSO.CustomDSO 1161 ‘ CustomDSO Setup A.lss 1162 CustomDSO.ActionScript1 = “c:\LeCroy\XStream\CustomDSO\A.lss” 1163 CustomDSO.ActionEnable1 = False 1164 CustomDSO.ActionScript1 = “c:\LeCroy\XStream\CustomDSO\B.lss” 1165 CustomDSO.ActionEnable1 = True 1166 CustomDSO.ActionScript1 =...
- Page 349 Operator's Manual 1169 CustomDSO.ActionEnable1 = False 1160 CustomDSO = XStreamDSO.CustomDSO 1161 ‘ CustomDSO Setup B.lss 1162 CustomDSO.ActionScript1 = “c:\LeCroy\XStream\CustomDSO\A.lss” 1163 CustomDSO.ActionEnable1 = True 1164 CustomDSO.ActionScript1 = “c:\LeCroy\XStream\CustomDSO\B.lss” 1165 CustomDSO.ActionEnable1 = False 1166 CustomDSO.ActionScript1 = “c:\LeCroy\XStream\CustomDSO\C.lss” 1167 CustomDSO.ActionEnable1 = True 1168 CustomDSO.ActionScript1 = “c:\LeCroy\XStream\CustomDSO\A.lss”...
- Page 350 If you then touch Yes, the DSO will display a file like this: ' XStreamDSO ConfigurationVBScript ... ' Created by CustomDSO ... On Error Resume Next set dso = CreateObject("LeCroy.XStreamDSO.1") ' dso.Display.GridMode = "Dual" ' dso.Acquisition.C1.VerScale = 0.1 ' dso.Acquisition.Horizontal.HorScale = 1e-6 ' dso.Acquisition.TriggerMode = "Auto"...
- Page 351 A. Double click on the Single button. B. In the resulting code window, insert code to make the following subroutine: Private Sub SingleButton_Click() Dim app as Object Set app = CreateObject(“LeCroy.XStreamApplication”) app.Acquistion.TriggerMode = “Stopped” End Sub Double click on the Auto button.
- Page 352 WavePro 7Zi In the next example you can see a command button, a picture box, a list box and a Tabbed Dialog Control. WP700Zi-OM-E-RevA...
- Page 353 Operator's Manual The Tabbed Control (arrow) is not in the basic tool box. To gain access to it, right click in the tool box at left (but not on an icon.) You will see this menu: Now select the Microsoft Tabbed Control as shown below, and click on Apply. The control will be added into the toolbox at the left of the screen, where you can double click on it as usual.
-
Page 354: Example 1
Note that arrays of objects can be constructed, allowing numerous objects to be accessed in simple loops. Private Sub Command1_Click() Dim wm As Object Set wm = CreateObject("LeCroy.XStreamApplication") Set acq = wm.Acquisition ' To save typing Set mat = wm.Math ' To save typing... - Page 355 Operator's Manual Dim t(16) As Object ‘ Create an array of objects to allow looping. Set t(1) = acq.C1 : Set t(2) = acq.C2 Set t(3) = acq.C3 : Set t(4) = acq.C4 Set t(5) = mat.F1 : Set t(6) = mat.F2 Set t(7) = mat.F3 : Set t(8) = mat.F4 Set t(9) = mat.F5 : Set t(10) = mat.F6 Set t(11) = mat.F7 : Set t(12) = mat.F8...
- Page 356 WavePro 7Zi Here is the result after seven swaps. The counting method could be useful in any routine where numerous operations, such as triggers, have to be performed. In fact, the caption of the button could have been used to show the number of operations.
-
Page 357: Example 2
Operator's Manual Second Example PlugIn – Log-Log FFT Plot A frequent requirement is to plot a frequency spectrum on two logarithmic scales. The instrument provides a vertical scale, so CustomDSO has only to change the horizontal one. Here is an example. The first figure has been truncated on the right side. - Page 358 WavePro 7Zi Private Sub Command1_Click() Draw a DSO trace on a logarithmic horizontal scale. Dim WM As Object Set WM = CreateObject("LeCroy.XStreamApplication") Dim Samples As Long Samples = WM.Math.F1.Out.Result.Samples Samples = Samples - 1 ' Make it a round number.
-
Page 359: The Need
With Digital Filter Package 2 (DFP2), LeCroy provides a solution that combines the best of both worlds. This package includes seven of the most useful finite impulse response filters (FIR), in addition to a custom design feature. -
Page 360: Enhanced Solutions
Enhanced Solutions DFP2 can be coupled with other LeCroy software products such as JTA2 or DDM2 to enhance the capabilities of these products and to provide improved solutions. For Jitter Measurement, for example, the DFP2 Band-pass Filter can be coupled with the JTA2 package to measure jitter over a narrow frequency range. - Page 361 Operator's Manual Band-pass filters are useful for emphasizing a selected frequency band. Sample applications include radio channel identification, broadband transmission, ADSL, clock generators (i.e., eliminating the central frequency and displaying harmonics only), and telecommunications (Jitter Band-pass Filter measurement over a selected frequency range). Band 1: First Stop Band —...
-
Page 362: Communications Channel Filters
WavePro 7Zi Communications Channel Filters These filters belong to the low-pass filter category (with a variety of shapes). Raised cosine is one of a class of filters used to minimize intersymbol interference: the time domain impulse response crosses zero at all bit time intervals except the one with the impulse. -
Page 363: Iir Filters
Operator's Manual Figure 5-20. Illustrated above are two raised root cosine filters with different beta. The diagrams show that applying this filter twice results in a raised cosine response. Band 1: Pass Band — DC to half power bandwidth% times modulation frequency, Gaussian pass;... -
Page 364: Filter Setup
WavePro 7Zi If you need the fastest rolloff, the Chebyshev filters have the narrowest transition region for a given number of stages. However, the Chebyshev filter has ripple in the passband, while the Inverse Chebyshev filter exhibits a flat passband response, but has ripple in the stop band. In the setup of these filters, you have control of cutoff frequencies, transition region width, and stop band attenuation. -
Page 365: Custom Filters
Operator's Manual Note: Other math choices in the Operator1 menu include Boxcar, ERES, and interpolation. The boxcar "filter" is a simple average taken over a user-specified number of points (the "length"). Touch inside the FIR/IIR field and select finite or infinite response filterFIR (non-recursive) filters require a limited number of multiplications, additions, and memory locations. - Page 366 WavePro 7Zi 200 point sin(x)/x, a low-pass filter. Note: Real world filters would either be windowed or made by the Remez exchange algorithm. The point of this example is to show how to transfer a filter to the scope. check = 0.987 This is the DC gain of the filter Now create an ASCII file containing the coefficients: FirFilter.txt...
-
Page 367: Example 2: Creating An Iir Filter Coefficient File Using Mathcad
Operator's Manual From the File Format drop-down list choose "Tab Delimited Text". Press Finish. The File Output component icon will appear in your spreadsheet, with the path to the data file under it. Underneath that, the cursor is on a placeholder for the name of the Mathcad variable containing the data to be written to the data file. - Page 368 WavePro 7Zi Now create an ASCII file containing the coefficients: IirFilter.txt Note: The diskette icon, the file name, and the "A" below it are the representation of a Mathcad "File Output" component. It is inserted by selecting Insert, Data, File Output. You must specify the file name ("IirFilter.txt" in the example) and fill in the variable name that is the source of the data ("A"...
-
Page 369: Multirate Filters
3G wireless systems, for example, at the receiver end data must be filtered very tightly in large magnitude in order to be processed. Although the LeCroy DFP option provides many filter types, the correlation between edge frequencies and sample rate may be a limiting factor: edge frequencies are limited from 1% to 49.5% of the sample rate, while the minimum transition width region is 1% of the sample rate. -
Page 370: Compatibility
In addition to these standards, It is also possible to define modified or custom pulse mask tests. Compatibility The functions of ET-PMT described here are compatible with the following oscilloscopes from LeCroy: WavePro 7100, 7200, and 7300 WaveMaster 8620, 8600A, 8500A, and 8300A... -
Page 371: Probing
100 ohm (DS-1) and 120 ohm (E-1) terminations, and the other standards require 75 ohm terminations. A set of adapters (test fixture) for this purpose is available from LeCroy (part number TF-ET). These adapters require the use of an LPA-BNC ProLink adapter if they are being used with a WaveMaster or SDA. -
Page 372: Adding Measurements To A Mask Test
WavePro 7Zi Polarity In many electrical standards, such as DS-1, alternate “ones” are inverted. Each time a one is transmitted it is either a positive or negative going pulse depending upon the polarity of the previous one. This type of coding is referred to as AMI (alternate mark inversion). -
Page 373: Custom Pulse Mask Test Files
Operator's Manual Touch inside the Source1 field and select “ET” as the source. Touch inside the Measure field and select the desired measurement from the pop-up menu. Touch the Always On checkbox in the “Help Markers” section of the dialog to display cursors on the waveform, showing exactly where the measurements are being made. - Page 374 WavePro 7Zi The mask properties are defined by the file “PulseMasksProp.mdb” in the “D:\Masks” directory. This Microsoft Access 2000 file is shown here: This file contains mask tables that give the coordinates of each mask, and a table named “TelecomStandardsProps” that contains all of the information defining the test and how each mask is to be used. The fields in this table are defined as follows: ID - An index that is automatically generated.
- Page 375 Mask File Name (optional) - Used if MaskData is not specified; file name of the custom mask (*.msk file). This file type is created by LeCroy’s MaskMaker software. The following images show graphically how the above parameters are used for the four different types of masks set in the Type field.
- Page 376 WavePro 7Zi Absolute + Offset Relative WP700Zi-OM-E-RevA...
-
Page 377: Timing Functions
Once installed, JTA2's math and parameter selections will appear in the Math and Measure menus. JitterTrack,PersistenceHistogramandPersistenceTrace are timing functions in LeCroy’s JitterPro and JTA jitter and timing analysis packages. The JitterTrack feature is key to identifying the source of excessive jitter or non- normal jitter characteristics. -
Page 378: Timing Parameters
WavePro 7Zi forms , each representing a different characteristic of the waveform. Insight into edge details is given down to a few picoseconds — valuable in applications such as the examination of fast signal transitions. Timing parameters can also be used to measure cycle-to-cycle jitter, the width of positive and negative pulses, the duty cycle of either polarity, and an infinite number of cycles on long records. -
Page 379: Jittertrack Or Trend
Operator's Manual Figure 5-26. When “Data” Mode is selected. Set the desired reference clock frequency for an ideal position against which the signal is to be compared, or use “Find Frequency.” Specify the level at which the jitter measurement is to be made, as well as the rising or falling edge on which the measurement is to start. -
Page 380: Clock Or Data
WavePro 7Zi Use… When you need to monitor the evolution of a waveform parameter Trend— Jitter works only on one acquisition at a time or attribute over several acquisitions... time-correlate an event and a parameter JitterTrack value... JitterTrack— Trend points are not evenly monitor an evolution in the frequency spaced in time and therefore cannot be used for FFT (Fast Fourier domain... -
Page 381: Jitter Math Setup
Operator's Manual diagram on the previous page shows a data stream in relation to its clock signal. It illustrates how data pulses contain, within themselves, multiples of their clock-signal pulse widths. Analyzing the positive pulses in the data stream, we observe a great variance between each sample in, for instance, the range 7 to 37 . In fact, it is the small variations (the jitter) that are important. -
Page 382: Jitter Parameters Setup
WavePro 7Zi JitterTrack If you want to enable JitterTrack in addition to (or instead of) a persistence function trace, touch the Jitter button in the Select Math Operatormenu , then the Track button. The Select Math Operator menu closes, and the JitterTrack is automatically enabled. Jitter Parameters Setup Touch Measure in the menu bar, then Measure Setup... -
Page 383: Selecting The Math Function
Operator's Manual Touch a parameter. The setup dialog for the Px position you selected opens automatically. A mini-dialog also opens to the right of the main dialog, giving you more setup options for the selected parameter. The Persistence Histogram function builds a histogram from a persistence map to reveal the features that are only visible when several acquisitions have been superimposed on one another.the histogram as statistical tool simply graphs waveform parameters such as amplitude, frequency, or pulse width on an acquisition or series of acquisitions. -
Page 384: Setting Up The Histogram
WavePro 7Zi Setting Up the Histogram The mini-dialog contains setup fields for your histogram. Selecting the Cut Touch inside the Cut Direction field and select either Vertical or Horizontal. If you choose to cut a vertical slice, the units of the center and width of the slice are given in nanoseconds. If you choose a horizontal cut, the units of the center and width of the slice are given in millivolts. -
Page 385: An Innovative Visual And Processing Tool
Operator's Manual An Innovative Visual and Processing Tool With this timing function, not only can waveform noise and jitter be displayed but further processing can also be done. Persistence Trace generates special graphic representations of the persistence waveform on which further processing, such as the application of parameters and even Pass/Fail testing, can be performed. - Page 386 WavePro 7Zi Ptrace Range Ptrace Sigma A setup mini-dialog opens to the right of the main dialog, offering the following additional setup options: Function Options How It Works For each vertical time slice on the persistence map, Ptrace Mean calculates and plots a trace corresponding to the map’s mean value.
-
Page 387: The Basic Idea
Operator's Manual This table lists the Jitter and Timing Analysis (JTA) parameters and the tasks that they can perform. Additional analysis and processing of the waveform can be carried out by activating Statistics and using histogram parameters. For some parameters, one of the variants of JitterTrack can perform the same task. Use This Timing If You Want To For Further Processing... -
Page 388: To Set Up And Configure Trend
WavePro 7Zi Plot the trend of the parameter. To Set Up and Configure Trend Parameter Setup Before a Trend can be plotted, the timing parameter must be selected, as follows: Touch Measure in the menu bar, then Measure Setup... in the drop-down menu. In the "Measure"... - Page 389 Operator's Manual Touch the Trend button at the bottom of the dialog. A Math Selection for Trendpop-up menu opens from which you must select a math trace to display the trend. A second setup dialog opens to the right of the main with more setup options. The options offered depend on the parameter you chose, but all include Level is, Percent Level, Slope, and Hysteresis.
-
Page 390: Acquisition Sequence
WavePro 7Zi You can touch the Find Center and Height button to automatically locate the center of the Trend waveform and to scale it to fit within the grid, without affecting zoom and position settings. Or you can enter specific values by touching inside the Center and Height data entry fields and typing in values, using the pop-up numeric keypad. -
Page 391: Zoom Traces And Segmented Waveforms
Operator's Manual The following table provides a summary of the number of Histogram or Trend events captured per acquisition or sweep for each parameter and for a waveform section between the parameter cursors. Parameter Number of Events Captured Timing Parameters: p@lv, freq@lv, wid@lv, ' p@lv, Unlimited number of events per acquisition edge@lv,duty@lv, tie@lv, skew@lv, setup@lv, hold@lv... -
Page 392: Serial Data Analyzer Standard And Optional Capabilities
WavePro 7Zi The next figure shows a histogram display of 17,999 parameter measurements divided or classified into 2000 bins. The standard deviation of the histogram sigma is 6.750 ps. The instrument’s parameter buffer is very effective for determining the optimal number of bins to be used. An optimal bin number is one where the change in parameter values is insignificant, and the histogram distribution does not have a jagged appearance. - Page 393 Operator's Manual deterministic jitter separation, and direct measurement of periodic jitter, DDj, and DCD. The SDA also provides the capability to directly measure failed bits and to indicate their locations in the bit stream. Note: SDA - name of the instrument: Serial Data Analyzer SDM - Serial Data Mask testing package, available on WaveMaster, WaveRunner Series, and WavePro Series oscilloscopes.
-
Page 394: Jitter Wizard
WavePro 7Zi STANDARD MODE Gigabit Ethernet 1000Base-CX TX normalized/absolute, RX Gigabit Ethernet (optical long-haul) 1000Base-LX Gigabit Ethernet (optical short-haul) 1000Base-SX 10GBase-LX4 TX normalized 10GFC-X4 Optical Display Port 1.62 Gb/s Source Connector TP2, Sink Connector TP3, Embedded TP3 Display Port 2.7 Gb/s Source Connector TP2, Sink Connector TP3, Embedded TP3 Transmitter, receiver low, receiver high, cable test low, cable test high Fibrechannel (optical) FC2125,... - Page 395 Operator's Manual The jitter wizard is accessed from the Analysis drop-down menu: The initial dialog for the wizard gives you an overview of wizard operation. This dialog can be disabled after the first use of the wizard by checking the “Don’t show me this message again” checkbox. In this case, the dialog will not be displayed until the instrument is restarted.
-
Page 396: Sda Basic Setup
WavePro 7Zi Each dialog has a default selection that represents the most common configuration. You can accept the defaults by simply touching the Next button in each dialog. SDA Basic Setup Note: Many of the measurements in the SDA require both a high sampling rate and long memory to compute accurately. - Page 397 Operator's Manual level field and enter a percentage value, using the pop-up keypad. The level is automatically set to the selected percentage on each acquisition. Note: The absolute level setting should be used for jitter measurements over several acquisitions because the relative setting can potentially remove jitter by tracking slowly, thereby varying level shifts that could occur between acquisitions.
- Page 398 WavePro 7Zi Place a check in the PLL On checkbox to enable it. Touch inside the PLL Type field to select the type of PLL to be used in the clock recovery function. The choices are FC Golden, PCI Express Gen1, PCI-Express G2 A 3dBpk 16 MHz fc, PCI-Express G2 B 3dBpk 8 MHz fc, PCI Express G2 C 1dBpk 5 MHz fc, DVI, FB-DIMM, and Custom.
-
Page 399: Summary
Operator's Manual 1,000,000. A low PLL cutoff divisor means that the PLL will track and, therefore, attenuate jitter at higher frequencies. The default value of 1667 causes the clock recovery to operate as a "golden PLL," as defined in the Fibrechannel specification.] field and enter a value by means of the pop-up keypad. - Page 400 WavePro 7Zi Traditional – This conventional mode uses a trigger and one UI goes into the eye diagram per sweep. This is done using short acquisitions, is very slow, and adds trigger jitter to the signal jitter. This mode is likely to disappear and is only present because it’s what people used to do in order to produce an eye diagram.
-
Page 401: Setting The Vertical Scale
Operator's Manual Mask Margin Touch inside the X field and enter a value from 0 to 100%. As you enlarge the mask's X margin, you lengthen the horizontal dimension, bringing the mask closer to your waveform. Consequently, you will have more failures. - Page 402 WavePro 7Zi Touch the Show Error Map checkbox to enable a display of the error map. The error map displays bit errors in a three-dimensional display, with errors shown in white and correct bits in dark gray. The display is a 2-color surface map with frame number in the Y direction and bit number in the X direction. A frame is indicated by the frame sync bit sequence and is composed of the bits from the end of one frame sync to the start of the next one.
-
Page 403: Bit Error Rate
Operator's Manual Total jitter is derived from the histogram of timing error measurements. The histogram of measurements is accumulated and the tails of the distribution are extrapolated to form an estimate of the histogram for a population of 10 measurements. The extrapolated histogram is then integrated to determine the cumulative distribution function which forms the sides of the bathtub curve. -
Page 404: Pj Breakdown
WavePro 7Zi Tj Total jitter at a specific BER. The value is determined by the width of the curve expressing the confidence limits of the extrapolated TIE histogram. The value represents the expected range of values observed for a number of observed measurements equal to 1/BER. The Tj parameter is accumulated over all acquisitions since the start of the measurement or the last clear sweeps operation. -
Page 405: Mjsq Jitter
Operator's Manual Tj values at BER levels below 10 . The jitter breakdown is the best-fit to the bathtub curve for very low BER values, but does not take into account the jitter contribution at the very top of the bathtub curve. The figure below shows the flow of the effective jitter measurement. -
Page 406: Bathtub Curve
WavePro 7Zi MJSQRj MJSQ Random Jitter is determined by finding the average of the two standard deviations of the best-fit Gaussian distributions to the left and right sides of the measured jitter probability density function. MJSQDj MJSQ Deterministic Jitter is the difference between the mean values of the best-fit Gaussian distributions to the left and right sides of the measured jitter probability density function. -
Page 407: Jitter Filter
Operator's Manual Press the Serial Data Analyzer (SDA) button on the Quick Access toolbar; or, touch Analysis in the menu bar, then Serial Data in the drop-down menu. The display defaults to the "Scope" dialog, which enables you to set up SDA measurements while you continue to view currently displayed waveforms. Touch the Jitter button. -
Page 408: Tie Histogram
WavePro 7Zi A TIE histogram is often useful to display the raw measured histogram of the measured jitter values because it can give clues as to the sources of deterministic jitter and it also gives a good indication of whether the extrapolated total jitter value is likely to be accurate. - Page 409 Operator's Manual Touch inside the DDj Calc Method control and select Synch N Cycle for a repeating pattern (available for Edge-Ref or Edge-Edge method). Touch the ISI button. Note the change in the DDj measured value. Touch the ISI Edge-Edge tab. Touch the Detect Pattern button to find the pattern and length.
- Page 410 WavePro 7Zi Touch inside the ISI N Bits field to set the pattern length for the ISI plot. Touch the Individual Patterns checkbox to display the bit patterns of the length specified in the ISI N Bits field. Only the patterns that exist in the acquired data stream will be displayed: Touch any bit pattern in the list, then touch Add to display that trace.
- Page 411 Operator's Manual If you selected Custom from the Signal Type menu, touch inside the Bit Rate field and enter a bit rate, using the pop-up keypad. By touching the Find Bit Rate button, you can have the bit rate determined automatically.
- Page 412 WavePro 7Zi Tj Total jitter at a specific BER. The value is determined by the width of the curve expressing the confidence limits of the extrapolated TIE histogram. The value represents the expected range of values observed for a number of observed measurements equal to 1/BER. The Tj parameter is accumulated over all acquisitions since the start of the measurement, or the last clear sweeps operation.
-
Page 413: Adjust Rj
Operator's Manual DDj The peak-to-peak jitter caused by systematic effects related to the sequence of data transitions. Adjust Rj The TIE measurements in the edge-to-edge mode are measured by determining the timing between transitions of the data signal and comparing this to the nominal UI. The measurement is essentially the difference between two random values (the location of each transition in time). -
Page 414: Altncycle
WavePro 7Zi Timing of the transitions in the data waveform is measured for each transition and plotted as a function of the number of unit intervals over which the timing is measured. The N-Cycle dialog is used to control how this measurement is performed, and the diagram and table below describe the function in detail. - Page 415 Operator's Manual Control Values Description first edge normalized to a unit interval for each N. DDsdev gives the standard deviation for each edge relative to the first edge normalized to a UI for each N. Length This field displays the pattern length if Sync to Pattern is selected. Otherwise, maximum N (UI) this is the maximum N value displayed in the plot.
- Page 416 WavePro 7Zi Output Waveform Type Format The total jitter curve for a Gaussian with zero mean and TjGaussian unity standard deviation The log of the estimated (extrapolated) time interval error LogEstTIE histogram The total jitter curve which, shows the cumulative probability of an edge being greater (right-hand side) or less (left-hand side) than its nominal location in the center.
-
Page 417: Jitter Filter Function
Operator's Manual The jitter filter function generates a time sequence of jitter measurements that are filtered by the selected band- pass filter. Low-pass and high-pass frequencies are set in the function’s menu. You must enter the bit frequency (data rate) to set the sampling rate for the digital filter. This function is only valid when operating on the TIETrend trace generated by the SDA. - Page 418 WavePro 7Zi 100 kHz The bit rate of the signal under test. This number can also be set to a sub-multiple Frequency to 4.5 of the bit rate to show more than one eye. For example, 2.5 GHz will show one eye of a 2.5 Gb/s signal while setting the control to 1.25 GHz will display two eyes.
- Page 419 Operator's Manual An accurate reference clock is central to all of the measurements performed by the SDA. The recovered clock is defined by the locations of its crossing points in time. Starting with zero, the clock edges are computed at specific time intervals relative to each other.
- Page 420 WavePro 7Zi of n is the PLL cutoff divisor that is set from the SDA main menu. The cutoff frequency is Fd/n where Fd is the data rate. This filter is related to its analog counterpart through a design process known as impulse invariance and is only valid for cutoff frequencies much less than the data rate.
-
Page 421: Eye Violation Locator (Asda Option)
Operator's Manual clock timing points and the segments delimited by the clock samples are overlayed by aligning the clock samples for each segment. A monochrome or color persistence display is used to show the distribution of the eye pattern data. The jitter added by the measurement system in this case is from the sampling clock which, for the SDA is very low: on the order of 1 ps rms. -
Page 422: Eye Height
WavePro 7Zi Eye Height The eye height is a measure of the signal-to-noise ratio of a signal. The mean of the “0” level is subtracted from the mean of the “1” level as in the eye amplitude measurement. This number is modified by subtracting the standard deviation of both the “1”... -
Page 423: Eyeber
Operator's Manual eyeBER EyeBER is the estimated bit error rate from an eye diagram. It is calculated using the intersection of the distribution of the one and zero levels. EyeBER differs from in that eyeBER is calculated from Q-factor is, therefore, based on signal-to-noise ratio; BER, on the other hand, is based on jitter. Jitter is measured by the relative variation in the location in time of the transitions of the signal level across a specific level. -
Page 424: Bit Error Rate And Jitter
WavePro 7Zi The processes that make up jitter are complex and come from many different random and non-random (deterministic) sources. The PDF of the jitter is the convolution of all individual component PDF’s. Measurements are able to estimate the jitter PDF but are not able to determine the distributions of the random and deterministic parts of the overall distribution. -
Page 425: Total Jitter
Operator's Manual Total Jitter Figure 5-38. Probability of a data edge displacement greater than time t from the sampling clock. The mean value of the distribution is 0 which represents perfect alignment. The total jitter is the peak-to-peak jitter in a clock or data signal within a specified confidence, equal to 1-BER. An example of a normally distributed jitter PDF is shown in Figure 8. -
Page 426: Extrapolating The Pdf
WavePro 7Zi Figure 5-40. The bathtub curve is constructed by rescaling the total jitter curve in Figure 9 to one unit interval, and centering the right side of the total jitter curve at 0 UI and the left side at 1 UI (the left and right sides of the bathtub curve). -
Page 427: Separating Rj And Dj – Two Methods
Operator's Manual Figure 5-41. Logarithm of the measured TIE histogram superimposed on the extrapolated curve (in yellow). The extrapolation uses a quadratic curve fit to the histogram bins at the extremes. A smaller data set is extrapolated in order to estimate the data for the larger sample size. The extrapolation of the measured histogram of TIE values uses the random nature of jitter at the extremes of the histogram to extrapolate the bins below the 10th percentile and above the 90th percentile. -
Page 428: Effective Random And Deterministic Jitter
WavePro 7Zi described by equation 1 is fitted to the measured curve by selecting the Rj (slope) and Dj (intercept) to minimize the error in the fit. The second method of fitting Rj and Dj to the measured data is based on direct measurements of the deterministic jitter. - Page 429 Operator's Manual transition of a given bit. A user-selectable number of bits (from 3 to 10) is used in the measurement. The acquired waveform is processed in segments the size of the selected number of bits. For example, if 5 bits are selected, segments 5 UI long are examined.
-
Page 430: Bit Error Map
WavePro 7Zi Figure 5-44. Measured jitter bathtub curve (blue curve) based on the extrapolation of the measured TIE histogram. The red and green curves are the estimated bathtub curves based on the direct Dj and effective measurements respectively. Note that the direct Dj method underestimates the total jitter below the BER at which it is computed. -
Page 431: Jitter Measurement
Operator's Manual Figure 5-45. Bit Error Map for 127-Bit Pattern Containing Random Errors (White Squares). Figure 5-46. Bit Error Map for 127-Bit Pattern Containing Pattern Dependent Errors. Introduction Jitter is a measure of the timing error of data or clock signal transitions. The error is determined by measuring the time at which the signal crosses a given amplitude level and comparing it to the “expected”... -
Page 432: Signal Slew Rate And How Vertical Noise Converts To Jitter
(and incoherent with the signal, which is nearly always the case), this compensated Rj figure can be reported. As such, the LeCroy SDA software has been equipped to perform this compensation, and applies it to the Rj figure and not the Dj figure; however, the corresponding effect on Tj is reported as well. -
Page 433: Introduction
Operator's Manual Per model noise figures are supplied as a built-in database for each SDA oscilloscope, and a procedure for updating the values for a specific oscilloscope channel and probe are provided. Introduction Jitter is an important aspect of signal integrity for both optical and electrical serial data streams (and clocks). The SDA (serial data analysis) software is designed to measure the jitter and its components: random jitter (Rj), deterministic jitter (Dj), data dependent jitter (DDj) duty cycle distortion (DCD), and periodic jitter (Pj). - Page 434 For example: the BER is “ten to the minus 15th.”] . Historical Note: Before this approach was taken by LeCroy, the extrapolation was applied to the histogram tails, whereas now the extrapolation is applied to the EDF; in fact, to each half of the EDF, as described previously.
- Page 435 Operator's Manual And the complementary error function But more importantly, the inverse error function erf-1(x) is the inverse function (neither reciprocal nor complementary). This function gives the displacement x, for which a given value is the error function of that displacement.
- Page 436 (so upper bounded by 1) but normally about 0.5 for standard test patterns and, in particular, for PRBS patterns. See white paper from LeCroy on this subject.] , since the purpose of the alpha factor is to calculate Tj, and transition density is required for this purpose (since jitter is only pertinent for bit errors that have transitions).
- Page 437 Operator's Manual The other interesting attribute of this representation is that the slope of the lines gives the sigma of the distribution. This is all common treatment so far. All is well for a single Gaussian distribution. Now enter the idea that this coordinate transformation should have a variable normalization factor. This normalization is such that when the area of an un-normalized Gaussian is , then that resulting CDF manifests norm...
- Page 438 WavePro 7Zi This is the heart of the (patent pending) method for analysis of EDF, yielding best estimates of the underlying PDFs defining the measured system’s behavior. The procedure is straightforward: create the symmetric EDF for each side of the distribution. The method can be described in steps as: Forming a set of elements to be fitted, which are 3 values each, a vertical (Q-scale) value, a horizontal coordinate (for the case of time variable jitter, but the method is extensible to vertical noise analysis or, in...
- Page 439 Operator's Manual WP700Zi-OM-E-RevA...
- Page 440 WavePro 7Zi WP700Zi-OM-E-RevA...
- Page 441 Operator's Manual While there are detailed differences between this and other approaches for obtaining Rj and Dj, the most important figure we need to establish is total Jitter. Referring roughly back to the heuristic jitter equation, we rewrite this as: where Dj is the separation between the two means of the distributions.
- Page 442 WavePro 7Zi We do, however, calculate Tj from the most precise estimation of the CDF from the renormalized Q-scale fit, using correct weights and sigmas to reconstruct a theoretical PDF, using the central region of the histogram “as is” and the extremes replaced by theoretical Gaussians of the correct strength, sigma, and mean to estimate each extreme region.
-
Page 443: Fsb Eye Mode Configuration
Operator's Manual For example, the FSB mode requires setting up multiple channels to carry out the eye diagram measurements, as described in the example below. The Gated Eye Diagram requires at least two inputs: The Data and the Gate signal. The Transition Mode requires at least one input (the Data Stream, but depending on the specific serial data standard, a clock input may also be required to recover the clock information). - Page 444 WavePro 7Zi Eye Diagram Setup and Measurements Select Mask for each Eye Diagram -- Depending on the Standard selected, there may be one or several types of serial data masks available. Select a Mask Margin (as % of the nominal mask size) if desired. Select a Measurement Type.
-
Page 445: Introduction To Fsb
Operator's Manual Introduction to FSB Front Side Bus is also known as the processor bus, memory bus, or system bus. The FSB connects the processors to the main memory, and is used to connect to other resources within the computer. The FSB can range from speeds of 66 MHz, 133 MHz, 100 MHz, 266 MHz, 400 MHz, and higher. - Page 446 WavePro 7Zi Rising edge (ASTB#) samples address bit 1 Figure 5-50. Address Bus Timing Diagram ©Intel Corporation. Common Clock Bus Characteristics (Refer to the Following Figure) During every period of BCLK, 1 bit is sent or there's an idle state meaning high voltage on the signal. BCLK is a differential signal.
- Page 447 Operator's Manual Figure 5-52. Transition Mode. For example, Section 4.3.3.1 of PCI Express Specification defines the requirements for Transition and Non- transition eye diagrams: “There are two eye diagrams that must be met for the Transmitter. Both eye diagrams must be aligned in time using the jitter median to locate the center of the eye diagram.
- Page 448 WavePro 7Zi Figure 5-53. Data (M1) and Gate (M2) signal sources. The following display is the Eye diagram resulting from applying the Gate signal. When the Gate is high, the bit data goes to one eye diagram. When the Gate is low, data goes to the other eye. WP700Zi-OM-E-RevA...
-
Page 449: Dda Quick Access Toolbar Button
Operator's Manual Figure 5-54. Gated Eye Diagram Example. You can click the Disk Drive Analysis (DDA) Quick Access toolbar button to display the Drive Analysis setup dialogs Additional DDA Triggers Sector Pulse: Triggers on the n sector pulse (1 to 50) after index. Index and sector pulse polarity and sector pulse number are selectable. -
Page 450: Disk Drive Measurement Package (Ddm2)
WavePro 7Zi Servo Gate: Triggers on the n servo gate after index and every m thereafter. Index and servo gate pulse polarity are selectable. PES Trigger: Triggers on Position Error Signal (PES) exceeding an adjustable voltage window. Servo gate can be selected as qualifier. -
Page 451: Advanced Dda Analysis
Operator's Manual Advanced DDA Analysis Head Filter/Equalizer Emulation Channel Emulation SAM Histograms Plot of SAM Values PES Runout Analysis Analog Compare Correlation Trend Histogram Obstacles that Can be Overcome using the DDA’s Channel Analysis Disk Drive engineers who are analyzing channels to determine where and why data errors occur face important obstacles. -
Page 452: Channel Emulation
WavePro 7Zi Identify areas where two head signal differences are greatest and provide a benchmark for the difference and the byte locations where these occur The Channel Analysis feature can be operated in either of these basic modes: Channel Emulation Analog Compare Because each requires a similar setup, both share the same Channel Setup menu system, which lets you switch between modes without the need to redefine setup details. -
Page 453: Analog Compare
Operator's Manual Stop On SAM The second selection mode of operation is Stop on SAM. When this mode is enabled, the DDA is placed in what is essentially a test mode for PRML signal quality based on SAM. When in Normal acquisition mode, the DDA will continuously acquire and analyze head signals until it finds a PRML sample value with a SAM value below a user- specified level. -
Page 454: Measure's Drive Parameters
WavePro 7Zi Noise Analysis Disk noise parameters enable parameter measurements of media signal-to-noise (msnr), residual (electronics) signal-to-noise (rsnr), and the ratio of media to residual signal-to-noise (m_to_r). The calculation of all three parameters is based on the distribution of the averaged Viterbi input samples. msnr can be applied to any single-frequency, sector-based data pattern. -
Page 455: Channel Setup
Operator's Manual goes true, it is recommended that Read Gate be used. If Read Gate is not present, the entire waveform will be used unless the Analyze Region cursors are enabled. If for Read Gate you selected other than none, Touch inside the Gate Polarity field and select positive or negative polarity. - Page 456 WavePro 7Zi Touch inside the Signal Type field and make a selection from the pop-up menu Touch inside the Code Rate field and make a selection from the pop-up menu . If you select Custom, also touch inside the Custom m/ndata entry field and enter new m and n values, using the pop-up keyboard.
-
Page 457: Drive Analysis Setup
Operator's Manual 11. Touch inside the Boost field and enter a value from 0 to 13 dB using the pop-up numeric keypad. See Boost at fc in "PRML Channel Emulation" then touch Back to complete this setup. 12. Touch inside the Group Delay field and enter a value from –30.0% to +30.0% using the pop-up numeric keypad. -
Page 458: Read Gate
WavePro 7Zi Touch the Drive Analysistab Touch the Noise Analysis button. The Noise Analysis setup checkbox, buttons, and data entry field appear. Touch inside the Head Signal field and select a signal source from the pop-up menu. The choices comprise channel inputs C1-C4, math traces F1-F8, memories M1-M4, or Reference. Touch the Trace On checkbox to turn the Head Signal on. -
Page 459: Sector Pulse
Operator's Manual Sector Pulse Sector Pulse triggers on the specified (n ) sector start pulse after the Index mark. To set it up, proceed as follows: Press the Disk Drive Analysis (DDA) button on the Quick Access toolbar. The disk drive dialogs appear. Touch the Disk Triggers tab. - Page 460 WavePro 7Zi Touch inside the Position Segment data entry field and enter a value from 1 to 999 using the pop-up numeric keypad. Touch inside the Position Byte field and enter a value from -50 to 50,000 using the pop-up numeric keypad.
-
Page 461: Using The Dda's Equalization Filter
Operator's Manual If the channel analysis method selected is Channel Emulation, the DDA will perform PRML channel emulation to determine the location of problems in the data field. Often, there is a delay between the end of valid data and the disabling of the Read Gate. - Page 462 WavePro 7Zi Case 1: Only Read Gate True regions are analyzed Similarly, if Analyze Region is disabled and Read Gate enabled, the area of the Head Signal during which Read Gate is true is analyzed, as shown in sections A, B, C, D, and E in Case 2 Case 2: Head Signal Read Gate True regions analyzed If Analyze Region is enabled and Read Gate is not available, only the area of the Head Signal within the region is analyzed, as shown in Case 3.
-
Page 463: Which Signals To Provide
Operator's Manual Case 4: The entire head signal is analyzed DDA Markers If Read Clock is acquired by the DDA, the "sample time" markers can be drawn. Because the phase relation of RCLK to the head signal is not known, it is adjustable. It is worth noting here that the ML markers are at positions determined by the instrument's channel emulation;... -
Page 464: Selecting The Reference Waveform
WavePro 7Zi Channel Emulation with a reference saves up to 20,000 bits as its reference, while also saving ML sample results; there can be up to 250 separate Read Gate true sections in the data analyzed by Channel Emulation with reference. Analog Compare can handle one block of data of any length up to the maximum that can be acquired and stored by the DDA. -
Page 465: Automatically Shown Traces
Operator's Manual analyze: for channel emulation methods the start marker should always be near the beginning of the VCO Synch field. However, even 0.1% speed variance becomes 0.8 s of jitter after 8 ms of delay. That is probably several hundred bit cells (far more than Analog Compare can compensate for) which may cause the channel emulation methods to miss the VCO Synch field entirely. -
Page 466: Channel Emulation Without Reference
WavePro 7Zi errors for peak detect signals. It can also be used for PRML signals, although Channel Emulation with a reference signal is the recommended method if a reference signal is available. See Using Analog Compare for a full description of this method. Channel Emulation without Reference Since it does not require a reference, Channel Emulation without a reference signal is the easiest of the channel analysis methods to use for PRML signals. - Page 467 Operator's Manual of the selected sequence and the other possible sequence leading to the selected state (SAM) is then calculated. For each sample in the Viterbi detector, Channel Emulation without reference determines a SAM indicating the confidence it has in making a decision between the two most likely sequences. If Run Length Limit has a non-zero value, run length limit will also be detected and violations reported.
-
Page 468: Notes On Using Channel Emulation Without Reference
WavePro 7Zi Notes on Using Channel Emulation without Reference Sequenced Amplitude Margin (SAM) is used by the Viterbi detector to decide whether a bit should be "1" or "0". As the Viterbi detector receives each sample, the detector must choose between two possible sequences, which lead to the state it selects. - Page 469 Operator's Manual subsequent acquisition and looks at the margin for the states in the final surviving state of the reference bit sequence. As long as the bit sequence for the current acquisition and the reference acquisition match, the margin is > 0. When a different decision is actually made the margin reported is less than zero: there was less then zero margin to making a different decision;...
-
Page 470: Notes On Using Channel Emulation With Reference
WavePro 7Zi adjust the phase of the PLL (phase locked loop), which generates the sampling clock, and to adjust the AGC (automatic gain control). Most commonly the VCO Synch is 2T. Bit Cell Time: is used as a starting estimate of the VCO Synch signal. If the value is not known and the VCO Synch field is at the beginning of the area to be analyzed, selecting Measure Bit Cell Time will determine it automatically. -
Page 471: Notes On Using Head/Analog Compare
Operator's Manual Analog Threshold: This is the user-specified threshold used by Analog Compare to decide when to record an error. A typical value for the Analog Threshold might be about 0.025. See Note 1 below. Additionally, these parameters are useful (but not essential) for Analog Compare: Read Gate: If the Read Gate signal is available, it will be used as described in Note 2, below. -
Page 472: Overview
WavePro 7Zi Overview The term "local feature computation" indicates that a parameter computed on a waveform is determined only by information in the immediate vicinity of a specified feature of that waveform. The DDA defines a local feature as a waveform peak followed by a trough, like this: However, it is not the opposite: a trough followed by a peak. - Page 473 Operator's Manual When a waveform rises by an amount that is more than the hysteresis, compared to the lowest prior waveform sample, the criterion for the existence of a peak is met. Then the search for its exact location and voltage value is initiated.
- Page 474 WavePro 7Zi Local baseline and local baseline separation if not last local feature Baseline identified Baseline identified Baseline Local Baseline peak-to-trough trough-to-peak Separation (PTBase) (TPBase) average of PTBase + TPBase PTBase – TPBase PTBase PTBase midpoint of local peak and trough Setting Hysteresis Hysteresis must be set for all local parameters.
- Page 475 Operator's Manual lbase Local Base Definition The value of the baseline for a local feature. The average value of the local baselines for all local features between the parameter cursors Description is displayed as lbase. For histograms, each individual baseline value for all local features between the parameter cursors is provided.
- Page 476 WavePro 7Zi Parameter Selecting this parameter from the Measure menus prompts you for a hysteresis setting, which allows you to set the hysteresis value to a specified number of vertical divisions. Settings Example lmin Local Minimum Definition The minimum value of a local feature. The minimum value of all the local features between the parameter cursors is determined, and Description the average value is displayed as lmin.
- Page 477 Operator's Manual Example Local Peak-to-Peak Definition The vertical difference between the peak and trough for a local feature. The peak-to-trough voltage difference is determined for all local features in a waveform, and Description the average is displayed as lpp. Provided for histograms is the peak-to-peak value of each local feature between the parameter cursors.
- Page 478 WavePro 7Zi Example ltbp Local Time Between Peaks Definition The time between a local feature peak and the next local feature peak. The average of the time between successive local feature peaks is determined, and its value Description displayed as ltbp. Provided for histograms are the times between successive peaks for all peaks between the parameter cursors.
- Page 479 Operator's Manual Example ltmn Local Time at Minimum Definition The time of the minimum value of a local feature. The time of the minimum value of the first local feature in a waveform after the left parameter Description cursor is determined. The time is returned as ltmn. Provided for histograms are all times for local feature minimums between the parameter cursors.
- Page 480 WavePro 7Zi Example ltpt Local Time Peak-to-Trough Definition The time between a local feature peak and trough. The average of the time between all local feature peaks and troughs is displayed as ltpt. Description Provided for histograms are the times between peak-trough pairs for all local features between the parameter cursors.
- Page 481 Operator's Manual Example lttp Local Time Trough-to-Peak Definition The time between a local-feature trough and the next local-feature peak. The average of the time between all local feature troughs and the following local feature peak Description is displayed as lttp. Provided for histograms are the times between trough and following peak for all local features between the parameter cursors.
-
Page 482: Disk Standard Parameters
WavePro 7Zi Example These parameters enable standard disk drive waveform parameter measurements. These parameters are accessible by touching Measure in the menu bar, then touching the My Measure button, and then a parameter button: P1 to P8. DISK STANDARD DEFINITION PARAMETER aasym amplitude asymmetry between taa+ and taa-... - Page 483 Operator's Manual p@lv Period at Level Definition Calculates the period of each cycle in an acquired waveform For each cycle in a waveform, p@lv determines the time from the beginning of the cycle as Description defined by a user specified threshold and slope to the end of the cycle as shown in the diagram below.
- Page 484 WavePro 7Zi A BlackmanHarris window is applied to the input data to minimize leakage effects. The net result is that nbpw will provide excellent results even if frequency changes occur due to spindle speed variations. If the actual frequency differs from the specified frequency, and the bin width is 0.105% (minimum resolution bandwidth), the resulting power will be reduced from the actual as in this table: Frequency Difference dB Reduction...
- Page 485 Operator's Manual The average pulse width at the 50% point between a local baseline and the local-feature peak, Definition and between the local baseline and the local feature-trough. All local features between the parameter cursors for an input waveform are identified. The local baseline is identified for each feature, and the height between the local baseline and the peak is determined.
-
Page 486: Correlation Theory Of Operation
WavePro 7Zi All local features between the parameter cursors for an input waveform are identified. The peak-to-trough amplitude is determined for each feature, and the average is returned as taa. Description Provided for histograms is the peak-to-trough amplitude for each local feature between the parameter cursors. - Page 487 Operator's Manual Correlation values can be calculated as a function of various amounts of time shift between two waveform sections used in calculating a correlation. This calculation, as a function of the starting point of the second section being the i waveform sample, is determined by: where Corr is the i...
- Page 488 WavePro 7Zi acsn. An ACSN measurement is performed for each pattern, and the results averaged. All individual ACSN measurements can be observed by histogramming the acsn parameter. ACSN is limited to measuring signal-to-noise ratios of 9.6 dB or greater. ACSN results are presented in dB. All averaging, including statistics and trend average, is performed on linear units.
- Page 489 Operator's Manual 6.25E-8 26.97 dB 7.50E-8 26.78 dB 8.75E-8 26.57 dB 1.000E-7 26.47 dB 1.125E-7 26.41 dB 1.250E-7 26.30 dB Correlation ACSN .9995 33.0 dB .9990 30.0 dB .9985 28.2 dB .9980 27.0 dB .9975 26.0 dB .9970 25.2 dB nlts Non-Linear Transition Shift Definition...
-
Page 490: Notes
WavePro 7Zi the NLTS calculations are adjusted by dividing their value by the correlation coefficient value at an integral number of pattern-length delays. The following table gives the standard deviation of the nlts parameter for varying amounts of auto-correlation signal-to-noise, and numbers of repetitions of the pseudorandom sequence in the input waveform. -
Page 491: Noise Parameters
Operator's Manual Partial erasure and hard/easy transition shift (due to DC erase) creates separate correlation echo peaks which, depending on the pattern used, may be close to the adjacent transition nlts echo and interfere. It is important to pick a good PRS. ACSN #Pattern Repetitions nlts Standard Deviation... - Page 492 WavePro 7Zi msnr Media Signal-to-Noise Ratio Definition Provides a signal-to-noise ratio for single-frequency, sector-based waveforms. Granularity in magnetic media produces zigzag transitions. The exact location of the zigzags changes from write to write causing media noise (also known as zigzag noise). During read operations, the read head effectively averages across the track the location of all the zigzags.
-
Page 493: Why Prml
Operator's Manual m_to_r MSNR-to-RSNR Ratio Provides a media signal-to-noise residual to signal-to-noise ratio for single-frequency, sector- Definition based waveforms. The m_to_r ratio provides a quick measurement to compare the media noise with the residual noise. If this ratio is greater than 1.00, the signal is residual, or electronics noise dominated. Description The measurement is calculated by: m_to_r =... -
Page 494: Principle Of Equalization
WavePro 7Zi EPR4 E2PR4 2.31 However, the higher order PRML schemes need very complex circuits and decoders. While the Class IV partial response (PR4) system works with three vertical levels of samples, extended partial response 4 (E2PR4) has seven levels, and requires not only a higher resolution of ADC, but a complicated timing and gain recovery circuit and sophisticated ML detector as well. - Page 495 Operator's Manual The DDA does this work automatically: you set the desired -3 dB frequency, and the DDA calculates fc for the current Boost and Group delay. The frequency cutoff accuracy (alpha = 0) is < 2% of the setting. Boost at fc The pulse shape produced by a transition going under a head is nearly Lorentzian, but that is not the correct shape for PRML.
-
Page 496: Resampling Adc
WavePro 7Zi Resampling ADC Because the DDA data is already digital, this simply interpolates between DDA samples to produce a digital value at the channel sample time. Finite Impulse Response (FIR) In addition to the continuous time analog filter (CTAF), there is normally an FIR filter following the analog-to-digital converter at the PRML channel’s sample rate. -
Page 497: Ml Detector
Operator's Manual Note that the VCO Synch must exist in the acquired head signal, or the channel emulation cannot be run. The phase and gain steering algorithm in the emulation will adjust for changes in the signal after VCO Synch, assuming it starts correctly. -
Page 498: Encoding
The first characters in the file must be USER DEFINED VITERBI TRELLIS FOR LECROY DDA. If the string USER DEFINED VITERBI TRELLIS FOR LECROY DDA is not seen at the start of the file, the file is not parsed, and any previously loaded user definition is left undisturbed. The message "Header not found at start of file - read aborted"... -
Page 499: Loading Your Udt File Remotely
To call the UDT file when operating the instrument remotely, use remote command DD_LOAD_UDF "filename" where: filename = full qualified path to the UDT file, for example, "C:\Lecroy\myudf" General Rules and Error Messages All lexical elements should be separated by white space. Lexical elements include keywords and their arguments. - Page 500 WavePro 7Zi keyword: KEYWORDS_VERSION arguments: required?: "Keywords version is newer than software rev!" When the keywords file is updated, this possible error message will specify KEYWORDS_VERSION 2. New software will be able to handle messages: versions 1 and 2. Old software will produce this error message if it encounters KEYWORDS_VERSION 2.
- Page 501 Operator's Manual keyword: NORMALIZED_LEVELS arguments: (see note below) Notes: 1. This keyword takes LEVELS arguments, each a value from -1 to 1, in order. required?: 2. If this keyword is not supplied, levels default to LEVELS: equally spaced values from -1 to 1. 3.
- Page 502 WavePro 7Zi where: phase error = distance from sample to level * slope * DSO samples per bit cell Notes: 1. Distance is normalized (-7200 = -1 level, +7200 = +1 level) 2. Slope is (normalized codes/DSO sample) around the channel sample position 3.
- Page 503 Operator's Manual can be specified. "Must set #states before STATE info!" - see note 4 above. possible error "State <number>?? Expected states 0 to <STATES - 1>!" messages: "State <number>: must be -1 < expected level < 1!" keyword: STATES arguments: <number from 4 to 16>...
-
Page 504: Example File
An example of a user definition equivalent to E2PR4 (d=0) follows. This file was named E2PR4.UDF: USER DEFINED VITERBI TRELLIS FOR LECROY DDA // a comment can go here // The above line is required exactly as shown or the file will be rejected! -
Page 505: Probe Calibration With The Tf-Dsq Fixture
Operator's Manual // State initializers - one for each valid state // state prev from 0 level prev from 1 level STATE 0 0 0 8 -0.33333 STATE 1 0 0.33333 8 0 STATE 2 1 0.66667 9 0.33333 STATE 3 1 1 9 0.66667 STATE 4 2 0 10 -0.33333 STATE 5 2 0.33333 10... -
Page 506: Tf-Dsq Fixture Overview
The combination of TF-DSQ fixture and scope software is designed with an important use model. Connecting probes to the circuit under test can be a difficult procedure. LeCroy's system, therefore, is designed in a manner that allows you to set up the probe calibration fixture, calibrate each individual probe once, connect your probes to the circuit, and disconnect the fixture. - Page 507 Operator's Manual The TF-DSQ fixture comes in a soft case containing the following components: The TF-DSQ fixture A 50-ohm cable A ProLink extender A CD containing PDF files of manuals for several scope options, including the TF-DSQ fixture TF-DSQ Components TF-DSQ Fixture Elements WP700Zi-OM-E-RevA...
- Page 508 WavePro 700Zi See the fixture overview to identify individual components. System assembly is accomplished in the following steps: Connect one end of the 50-ohm cable to the ProLink extender (this comes normally connected) Connect the other end of the 50-ohm cable to the SMA connector on the TF-DSQ fixture. Connect the ProLink cable from the extender to the TF-DSQ fixture.
- Page 509 Operator's Manual The TF-DSQ provides multiple probe connectors for various kinds of probes. Probes are connected electrically in either a single-ended or differential arrangement, depending on the type of probe. Probes are connected mechanically using either the probing pads, or a probing clip provided for solder-in probing solutions. Probe Connection Points and the Clip Differential probes are connected with the tip designated V+ mated to the "+"...
- Page 510 WavePro 700Zi Differential Probe Properly Connected to the Fixture (Browsing Configuration) Differential Probe Properly Connected to the Fixture (Solder-in Configuration) WP700Zi-OM-E-RevA...
-
Page 511: Probe Calibration Menu
Operator's Manual Accessing the Probe Calibration Menu The probe calibration menu can be accessed from the Vertical drop-down menu or from the channel "Vertical Adjust" dialog: Probe Calibration Menu Description Probe Calibration Information and Controls The information in the probe calibration menu is organized such that each row represents the information for a given channel, and each column represents the calibration information or control for that channel. - Page 512 WavePro 700Zi Probe Channel and Type Identification This area shows the type of probe connected to the channel. All other information shown in a given row is associated with that probe. Full Calibration Button This button causes the scope to automatically perform a full DC and deskew calibration. See details of probe DC calibration probe deskew...
-
Page 513: Basic Probe Calibration
Operator's Manual probes. In other words, it shows you the calibration information and provides the capability to calibrate the probe with a single button press, clear the calibration information, and manually reload the calibration information following a scope reboot. When the advanced mode button is checked, you have access to the advanced mode probe calibration menu. -
Page 514: The Advanced Menu
WavePro 700Zi The Advanced Menu The Advanced Menu contains information and functionality useful to the advanced user of the TF-DSQ fixture. These include: Risetime Skew Correction Deskew All (or common deskew capability) Common mode voltage settings for DC calibration Rise Time Skew Correction This field shows the signal risetime and the corresponding skew correction based on the signal risetime. - Page 515 Operator's Manual Deskewing is an adjustment of the times of waveform data points on the screen. Deskewing is an operation to correct the times that waveforms are displayed on the screen, mainly to account for propagation delays through probes and cables. When considering skew, there are two important things to consider: The relative skew between two channels The absolute skew from the zero time reference (i.e., the trigger point)
- Page 516 WavePro 700Zi between channel 4 and channel 3 is calculated as 40 ps and -40 ps is entered in channel 4's skew entry. When triggering on channel 4, channel 2 is advanced 30 ps in time and channel 3 is advanced 40 ps in time such that all of the edges are aligned with each other and with the trigger point.
- Page 517 Operator's Manual In this example, you can see that the application of signals with the same risetime, but different from that applied by the deskew fixture produces a deskew error, unless compensated. In the above figure, the green trace is the actual signal applied to the probes that has a risetime of twice that employed by the fixture.
- Page 518 WavePro 700Zi In the case of single-ended probes, the DC levels applied to the V+ probing pad are the same as the voltages that appear at the appropriate grid locations on the scope screen. Differential probes are handled slightly differently. In their case, the voltage applied to the V+ tip is the voltage specified in the Common mode voltage field, plus half the voltage desired on the scope screen.
- Page 519 Operator's Manual Note: Specifications are subject to change without notice. SDA, SDA, DDA, SDA, SDA, DDA, Vertical System WavePro 715Zi WavePro WavePro WavePro WavePro 760Zi 725Zi 735Zi 740Zi Analog (ProLink Input) 4 GHz 6 GHz Bandwidth @ 50 (-3dB) (• 10 (•...
- Page 520 WavePro 7Zi WavePro SDA, WavePro SDA, DDA, SDA, WavePro SDA, DDA, Horizontal System 715Zi 725Zi WavePro 735Zi 740Zi WavePro 760Zi External Timebaase 10 MHz; 50 impedance, applied at the rear input Reference (Input) Extrenal Timebase Reference 10 MHz; 50 impedance, applied at the rear output (Output) External Clock 0.1 Hz-100 MHz, 50...
- Page 521 Operator's Manual SDA, DDA, SDA, WavePro SDA, WavePro SDA, DDA, Triggering System WavePro 715Zi WavePro 725Zi 740Zi WavePro 760Zi 735Zi Edge Trigger (Ch 1-4) 1.5 div @ 2 GHz 1.5 div @ 3 GHz ProLink Inputs 1.0 div @ 200 1.0 div @ 200 (for DC, AC, (for DC, AC,...
- Page 522 Color 15.3" flat panel TFT-Active Matrix LCD with high resolution touch Type screen Resolution WXGA; 1280 x 768 pixels LeCroy WaveStream Fast Viewing Mode Intensity 256 Intensity Levels, 1-100% adjustable via front panel control Number of Channels Up to 4 simultaneously...
- Page 523 15-pin D-Type WXGA compatible to support customer-supplied external monitor. DVI and power connector to support LeCroy WPZi-EXTDISP-15 additional touch screen display External Monitor Port accessory. Includes support for extended desktop operation with optional LeCroy or other second monitor. WP700Zi-OM-E-RevA...
- Page 524 Interface Z10Zi Z25Zi Z35Zi Z40Zi Z60Zi Peripheral Bus LeCroy LBUS standard Auxiliary Input Signal Types Select External Trigger or External Clock Input on the front panel Coupling 50 : DC; 1 M : AC, DC, GND 50 : 5 V ;...
- Page 525 Operator's Manual Environmental three orthogonal axes, 18 shocks total as tested per MIL-PRF-28800F Physical Dimensions Dimensions (HWD) 355 mm x 467 mm x 289 mm; 14' x 18.4" x 11.4" (height excludes feet) Weight 18.4 kg; 40 lbs. Shipping Weight 26.6 kg;...
-
Page 526: Technical Support
WavePro 7Zi For assistance with installation, calibration, and a full range of software applications contact the customer service center nearest you. You can also find contact information for the following offices on the LeCroy Web site at http://www.lecroy.com/tm/ServiceSupport. Contact Your Local LeCroy Technical Support Office for Help... -
Page 527: Safety Symbols
Operator's Manual This section contains information and warnings that must be observed to keep the instrument operating in a correct and safe condition. You are required to follow generally accepted safety procedures in addition to the safety precautions specified in this section. Safety Symbols Where the following symbols appear on the instrument’s front or rear panels, or in this manual, they alert you to important safety considerations. -
Page 528: Operating Environment
WavePro 7Zi Operating Environment The instrument is intended for indoor use and should be operated in a clean, dry environment with an ambient temperature within the range of 5 °C to 40 °C. Note: Direct sunlight, radiators, and other heat sources should be taken into account when assessing the ambient temperature. -
Page 529: Ac Power Source
Operator's Manual AC Power Source 100 to 240 Vrms (+/-10%) AC at 50/60 Hz; 115 Vrms (+/-10%) AC at 400 Hz; Automatic AC voltage selection; Installation Category: 300V CAT II No manual voltage selection is required because the instrument automatically adapts to line voltage. WavePro 700Zi - </= 800 watts (800 VA) depending on accessories installed (probes, PC port plug-ins, etc.). -
Page 530: Calibration
WavePro 7Zi You have the ability to change the oscilloscope's original factory settings via the Power Options Properties menu in Windows under Control Panel Power Options. It is important to note that the Windows Power Option named Standby provides control of only the oscilloscope’s computer subsystems (CPU, hard drive, etc.) and does not affect the other subsystems within the oscilloscope. -
Page 531: Configuration Menus
Operator's Manual choice of signals, 478 clock hysteresis, 415 Clock setup fields, 414 (sinx)/x interpolation, 399 Clock Slope field, 415 Clock Source field, 415 configuration menus, 426 configuration options table, 425 100BT fall parameter, 240 coupling, 479 100BT rise parameter, 240 Data fields, 413 100BT tie parameter, 240 Data Gate field, 413... -
Page 532: Back Panel
WavePro 7Zi nT: setting of, 430 calculation, 423 ODATA math function, 497 example, 482 PAA parameter, 450 reading, 423 parameter buffer, 423 setup, 421 parameter events: capture of, 423 Trend menu selection, 417 Parameter menu selection, 417 Units menu, 413 parameters with trends &... -
Page 533: Trace Descriptors
Operator's Manual channel deskew, 402 exponential decay time constant, 107 channel emulation, 679 gated parameter, 109 setup, 665 multiple inputs and outputs, 100 with reference, 682 multiple traces, 112 without reference, 680 surface plot, 114 cleaning, 754 trace descriptors, 99 clipboard, 383 golden waveform VBS example, 86 clock or data, 563... -
Page 534: Dual Channel Acquisition
WavePro 7Zi channel emulation w/o reference, 681 dropout trigger, 368 d/k, 715 DSO process, 160 dark calibration, 404 Dtime@level parameter, 243 data formats, 286 Dtrig time parameter, 243 date & time, 386 Dual Channel Acquisition, 44 dcd parameter, 242 duration parameter, 243 DDA channel analysis, 679 duty cycle parameter, 243 capabilities, 661... -
Page 535: Fft Setup
Operator's Manual eye ac rms parameter, 244 aliasing, 216 eye amplitude, 244 choosing a window, 212 eye ber parameter, 244 coherent gain, 216 eye bit rate parameter, 244 dynamic range, 212 eye bit time parameter, 244 enbw, 216 eye cross n parameter, 244 filters, 216 eye cross p parameter, 244 frequency bins, 216... -
Page 536: Hardware And Software Controls
WavePro 7Zi hold time parameter, 249 holdoff, 376 gain: varying, 401 hparam script parameter, 249 gate: measure, 235 hysteresis, 697 glitch trigger, 362 and local features, 686 grid intensity, 141 factors, 688 grid on top, 141 group delay compensation, 403 IIR filters, 538 installation, 511 half period parameter, 247... -
Page 537: List Of Parameters
251 locating entries, 187 locking of persistence traces, 157 managing notebook entries, 189 logic trigger, 356 miscellaneous settings, 182 LPA (LeCroy ProLink Adapter), 57, 81 notebook database, 189 report fomats, 188 last parameter, 249 m_to_r, 709 last trace, 155... -
Page 538: Parameter Status
WavePro 7Zi number of points, 217 standard vertical, 231 number of taps, 540 statistics, 230 Nyquist frequency, 217 status symbols, 228 turning on, 225 X-Stream browser parameter status, 228 partitions: hard disk, 272 one level parameter, 252 pass/fail setup, 61 operating environment, 751 pass/fail testing, 61 operating system: restarting, 179... -
Page 539: Screen Layout, Groupings, And Controls
Operator's Manual picket fence (fft), 217 and analog compare, 685 Pj parameter, 254 real power parameter, 255 pks parameter, 172 recalling default scope settings, 284 polling pattern, 509 recalling scope settings, 284 power & ground connections, 753 reference waveform power density spectrum (fft), 217 using analog compare, 685 power factor parameter, 254 remote: configuring, 382... -
Page 540: Pll Setup
WavePro 7Zi searching for a symbol, 513 eyeBER, 625 sector pulse, 677 height, 622 segments Q factor, 623 displaying, 30, 279 violation locator, 620 sensitivity and position: adjusting, 395 width, 622 Sequence Display Modes, 26, 275 eye patterns, 622 sequence mode display setup, 142 function reference, 609 Sequence Sampling Mode –... -
Page 541: Single-Shot Sampling Mode
Operator's Manual Rj & Dj: separating, 628 interval trigger, 364 effective, 628 runt trigger, 370 Rj parameter, 595 slew rate trigger, 372 SDM masks, 582 SNTP, 386 signal mode, 590 software assisted trigger, 348 slice width, 591 software: restoring, 176 slice2persist, 615 sparser, 202 symmary view, 589... -
Page 542: Tf-Dsq Overview
WavePro 7Zi gain & offset, 741 optimization, 374 high-speed edge, 739 slope, 374 overview, 725 source, 375 probe calibration menu, 730 trigger types, 345 probe connection, 728 window slope, 375 probe DC information, 731 trigger sources, 375 probe deskew information, 731 trigger types, 345 recall calibration, 731 TriggerScan, 34, 378... -
Page 543: Welcome
Operator's Manual delay control, 389 filter methods, 77 delay in, 389 filter wizard, 76 desktop, 393 histograms, 68 email, 384 index table, 69 file, 383 level markers, 66 hardcopy, 383 measurement mode, 74 offset control, 389 non-monotonic mode, 71 options, 388 persistence, 67 performance optimization, 389 runt mode, 72... - Page 544 Thank you for purchasing a WavePro, ® SDA or DDA 7 Zi Oscilloscope.
Need help?
Do you have a question about the WavePro 7 Zi series and is the answer not in the manual?
Questions and answers