
Related Manuals for Owon HSA1075


Summary of Contents for Owon HSA1075
- Page 1 HSA1000 Series Handheld Spectrum Analyzer User Manual ◼HSA1016 ◼HSA1016-TG ◼HSA1036 ◼HSA1036-TG ◼HSA1075 ◼HSA1075-TG Notice: -TG models are with tracking generator For product support, visit:www.owon.com.hk/download...
- Page 2 LILLIPUT Company. Fujian LILLIPUT Optoelectronics Technology Co., Ltd. No. 19, Heming Road Lantian Industrial Zone, Zhangzhou 363005 P.R. China Tel: +86-596-2130430 Fax: +86-596-2109272 Web: www.owon.com E-mail: info@owon.com.cn...
- Page 3 General Warranty We warrant that the product will be free from defects in materials and workmanship for a period of 3 years from the date of purchase of the product by the original purchaser from our company. The warranty period for accessories is 12 months.
-
Page 4: Table Of Contents
Table of contents List of figures ..............iii 1. General Safety Requirements ........1 2. Safety Terms and Symbols ..........4 3. Document Overview ............5 4. Quick Start ..............6 4.1 General Inspection ............6 4.2 Safety Precaution before Operation......6 4.3 First Time to Power on ............ - Page 5 6. Specification ..............73 7. Troubleshooting ............86 8. Appendix ............... 87 Appendix A: Enclosure ............87 Appendix B: General Care and Cleaning......88 Appendix C: USB Disk Requirements ....... 88 Appendix D: PC Software Requirements......88...
- Page 6 List of figures Figure 4-1 Front panel ............... 9 Figure 4-2 Top panel .............. 10 Figure 4-3 Rear panel .............. 12 Figure 4-4 User interface ............13 Figure 4-5 Function softkeys ..........16 Figure 4-6 Shift key and function hardkeys ......18 Figure 4-7 Numeric keypad ............
-
Page 7: General Safety Requirements
1.General Safety Requirements 1. General Safety Requirements Before use, please read the following safety precautions to avoid any possible bodily injury and to prevent this product or any other connected products from damage. To avoid any contingent danger, ensure this product is only used within the ranges specified. - Page 8 1.General Safety Requirements do not operate in a humid environment. ◼ Do not operate in an explosive atmosphere. In order to avoid damages to the device or personal injuries, it is important to operate the device away from an explosive atmosphere.
- Page 9 1.General Safety Requirements ◼ Handling Safety. Please handle with care during transportation to avoid damages to buttons, knob, interfaces and other parts on the panels.
-
Page 10: Safety Terms And Symbols
2.Safety Terms and Symbols 2. Safety Terms and Symbols Safety Terms Terms in this manual (The following terms may appear in this manual): WARNING Warning indicates conditions or practices that could result in injury or loss of life. CAUTION Caution indicates the conditions or practices that could result in damage to this product or other property. -
Page 11: Document Overview
3.Document Overview 3. Document Overview ⚫ Quick Start This chapter states the matters need to attention before first power on, how to power on at first time, introduces spectrum analyzer’s front/rear panel and user interface, explains how to use the instrument with a measurement example demonstration. -
Page 12: Quick Start
4.Quick Start 4. Quick Start This chapter states the matters need to attention before first power on, and how to power on at first time, introduces spectrum analyzer’s front/top panel and user interface, explains how to use the instrument with a measurement example demonstration. 4.1 General Inspection When you receive your new instrument, it is recommended that you check the instrument following these steps:... -
Page 13: First Time To Power On
4.Quick Start AC-DC adapter requirement Table 4-1 AC-DC adapter parameter Compatible range Input Voltage 100 V - 240 VAC, 50/60 Hz Output Voltage 12 - 15 VDC Max. Power 45 W 4.2.2 Electro-static Discharge (ESD) Protection ESD is an issue often ignored by users. Damage from ESD on the instrument is unlikely to occur immediately but will significantly reduce the reliability of it. - Page 14 4.Quick Start ventilation and cooling of the instrument. CAUTION Use only the original AC-DC adapter or originally supplied battery for the power source. The maximum RF input level of an average continuous power is 30 dBm (or 50 VDC signal input). Avoid connecting a signal into the analyzer that exceeds the maximum level.
-
Page 15: Front Panel Overview
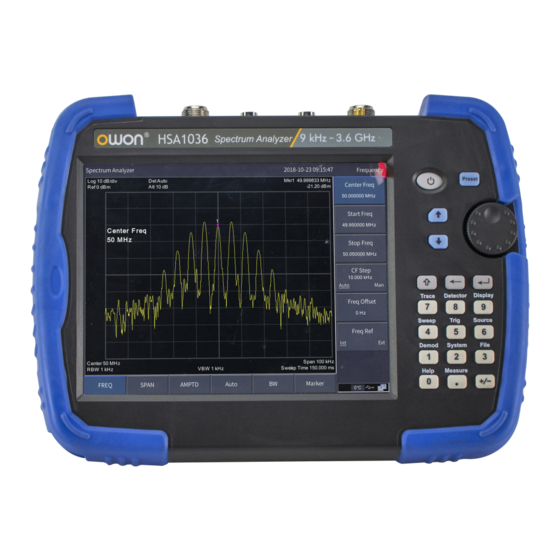
4.Quick Start 4.4 Front Panel Overview Figure 4-1 Front panel NO. Description ① LCD touchscreen. ② Light Sensor: Adjusts the screen backlight according to the environmental light. This state can be specified in 【Display】→ [Brightness]. ③ Power key: Long push to turn on the analyzer, push to turn on/off the LCD display, long push to turn off the analyzer. -
Page 16: Top Panel Overview
4.Quick Start ⑦ Shift key: Press the Shift key to active it, the light is on. When the Shift key is active, pressing a number key will execute the upper function. Long press the Shift key to active it persistently. To switch to the brief active status, short press the Shift key. - Page 17 4.Quick Start N type female connector. Connector for RF input. CAUTION RF Input ④ Input voltage at RF input port must not be higher connector than 50 V DC to avoid damage to the attenuator (50 Ω) and input mixer tracking generator. When input attenuator is higher than 10 dB, the RF port input signal must be less than +30 dBm.
-
Page 18: Rear Panel Overview
4.Quick Start 4.6 Rear Panel Overview Figure 4-3 Rear panel NO. Name ① Battery compartment ② Air vents ③ Tilt stand 4.7 User Interface Overview Figure below illustrates the user interface, with touch screen menu keys, top bar, and measurement settings and results around the graph area. -
Page 19: Figure 4-4 User Interface
4.Quick Start 11 12 13 Figure 4-4 User interface Name Description Related Key Set the reference FREQ → External ① frequency as Int (internal) reference [Freq Ref] or Ext (external) input. Turn on/off the AMPTD→ ② Preamplifier preamplifier. [Preamplifier] 【Sweep】→ Set the sweep status to [Sweep ③... - Page 20 4.Quick Start Set the trigger type to Auto, Video, Pos 【Trig】 ⑤ Trigger type (external positive edge), Neg (external negative edge). 【Marker】→ Continuous Open/close continuous ⑥ peak search peak search. [Peak>] Automatic automatic search 【Auto】 ⑦ search mode. ⑧ USB sign USB access mark.
- Page 21 4.Quick Start Display current trace1 type refresh,the ⑰ Trace 1 detection is a positive peak. Display current trace2 type is maximum hold ,the ⑱ Trace 2 detection is a positive peak. Display current trace3 type is minimum hold,the ⑲ Trace 3 detection negative peak.
-
Page 22: Function Keys
4.Quick Start Display current activated Frequent marker,drag the marker ㉛ Marker Marker to change the marker position. 【AMPTD】→ Amplitude Amplitude display scale ㉜ scale setting ratio. [Scale/div] Amplitude Scale Type can 【AMPTD】→ Amplitude ㉝ choose Log (logarithmic) Scale Type [Scale Type] or Line (linear). - Page 23 4.Quick Start Activates the frequency sweep span function, Span and set Full Span\Zero Span\Last Span. Activates the reference level function, and AMPTD accesses the amplitude softkeys, with which you set functions that affect data on the vertical axis. Searches the signal automatically within the full Auto frequency range.
-
Page 24: Figure 4-6 Shift Key And Function Hardkeys
4.Quick Start Shift key and function hardkeys Figure 4-6 Hardkeys Description The trace measurement and display mode 【Trace】 can be set, and the related trace can be operated. 【Detector】 Set the detection mode. 【Display】 Set the parameters displayed on the screen. The system is set to single or continuous 【Sweep】... -
Page 25: Parameter Input
4.Quick Start Browse, delete, export, load, power on, and 【File】 reset stored files. On the spectrum analyzer help menu, click this key once to open the system help 【Help】 function, and then click again to disable the help function. The expanded measurement functions based on the spectrometer platform include adjacent channel power measurement, channel power 【Measure】... -
Page 26: Figure 4-8 The Rotary Knob
4.Quick Start Decimal point A decimal point "." will be inserted at the cursor position when this key is pressed. Sign key Sign key "+/-" is to toggle the sign of a parameter. When pressed the first time, a "-" will be inserted and changed into "+"... -
Page 27: Build-In Help
4.Quick Start while editing a parameter. Note: Press FREQ→[CF Step] to set the center frequency step. 2) Move the cursor though the directory tree in the【File】function. 4.10 Build-in Help The built-in help provides information that refers to every function key and menu key on the front panel. Users can view this help information if required. - Page 28 4.Quick Start ⚫Select a menu softkey: Touch the menu softkeys in the bottom, or in the right. ⚫Switch menu items: If there are options that can be switched in the menu, you can repeatedly touch the area of the menu item to switch.
- Page 29 4.Quick Start Three finger taps to capture the screen ⚫Move the active marker to the desired frequency (Marker → ] → turn the knob): When a marker is active, hold down [Marker > the marker and drag it to the desired position to release. Single-tap to move the active marker to the desired frequency...
- Page 30 4.Quick Start Control the reference level ⚫Set the center or start frequency (FREQ→ [Center Freq] or [Start Freq]): Swipe left or right in the display area. Control the center frequency ⚫Set the Span (Span→[Span]):In the trace display area, place two fingers horizontally on the touch screen and close or separate to reduce the increase of the sweep width and achieve the effect of horizontally enlarging or shrinking the trace.
-
Page 31: External Keyboard Control
4.Quick Start Pinch and spread can control the Span ⚫Set the Scale/Div (AMPTD → [Scale/Div]): In the display area, pinch and spread vertically to change the Scale/Div. Pinch and spread vertically to change the Scale/Div 4.12 External keyboard control Plug the keyboard into the USB Host port (Type A) on the top panel. You can control and input through the keyboard. - Page 32 4.Quick Start correspond to the following: 【F】 Frequency 【S】 Span 【A】 Amplitude 【R】 Auto Tune 【B】 Band Width 【D】 Detector 【W】 Sweep 【O】 Track Gen 【T】 Trace 【V】 Display 【I】 Trig 【M】 Mode 【Y】 System 【Q】 Quick Save 【P】 Peak 【K】...
-
Page 33: Basic Measurement
4.Quick Start 4.13 Basic Measurement Basic measurements include, input signal frequency and amplitude display, marked by a frequency marker. Follow these five simple steps below to implement input signal measurement. a) Find the signal frequency at full sweep width; b) Set the center frequency according to the signal frequency in step 1;... -
Page 34: Figure 4-10 Full Span
4.Quick Start Figure 4-10 Full Span To clearly observe the signal, reduce the frequency span to 1 MHz and set the center frequency to 100MHz. 2) Setting center frequency Press FREQ softkey on the bottom, select [Center Freq] on the right submenu. -
Page 35: Figure 4-11 Set Frequency Span
4.Quick Start Figure 4-11 Set frequency span 4) Activate marker —Press Marker softkey on the bottom,the button is located at the bottom of the screen. Then select [Marker ] softkey on the > right screen. And press the softkey to select [Marker 1 2 3 4 5 6 7 8], select Marker 1, the marker is located at horizontal center by default, that is the signal peak point or its neighbor. -
Page 36: Figure 4-12 Set Reference Level
4.Quick Start the unit to dBm. Also can use step button or knob to adjust. The reference level is set at -10 dBm, which is the signal peak value near the top of the grid. The balance between the signal peak value and noise is dynamic range. -
Page 37: Menu Interpretation
5.Menu Interpretation 5. Menu Interpretation This chapter provides you with the information on the function softkeys and hardkeys of the spectrum analyzer. 5.1 【FREQ】 bottom softkey Key access: [FREQ] softkey at the bottom of the screen The frequency range of a channel can be expressed by either of two groups of parameters: Start Frequency and Stop Frequency;... - Page 38 5.Menu Interpretation enter the desired parameter data. Key Points: ⚫ The span and center frequency are changed automatically according to the start frequency. The change of the span would have influence on other system parameters. For more details, please refer to "Span". ⚫...
-
Page 39: Span】 Bottom Softkey
5.Menu Interpretation switch between measurement channels in a specified step in order to sweep the adjacent channels manually. ⚫ You can modify this parameter using the numeric keys, knob, or direction keys. Frequency step lends itself to detect the harmonic waves and bandwidths that are beyond the current span. - Page 40 5.Menu Interpretation will be available along the right side of the display. You can modify span using the numeric keys, knob or direction keys. Use numeric key or [Zero Span] to clear span. 5.2.1 [Span] Sets the frequency range of the sweep. When pressed, the frequency mode is switched to Center Freq/Span.
-
Page 41: Amptd】 Bottom Softkey
5.Menu Interpretation 5.3 【AMPTD】 bottom softkey Key access: [AMPTD] softkey at the bottom of the screen Sets the amplitude parameters of the analyzer. Through these parameters, signals under measurement can be displayed at an optimal view with minimum error. The amplitude submenu includes [Ref Level], [Attenuation Auto Manual], [Scale/Div], [Scale Type Lin Log], [Ref Offset], [Ref Unit], and [Preamp On Off]. - Page 42 5.Menu Interpretation (or small signals) to pass from the mixer with low distortion (or low noise). It only works under internal mixer mode to adjust input attenuator insider analyzer. In Auto mode, input attenuator is related with reference level. Key points: ⚫...
- Page 43 5.Menu Interpretation ⚫ You can modify this parameter using the numeric keys, knob, or direction keys. 5.3.4 [Scale Type Lin Log] Sets the Scale Type of Y-axis to Lin or Log, the default is Log. It only works under internal mixer mode. In general, select mV as Lin amplitude scale unit.
-
Page 44: Auto】 Bottom Softkey
5.Menu Interpretation Choose decibel equals to 1mW as amplitude unit. [dBμW] Choose decibel equals to 1μW as amplitude unit. [dBpW] Choose decibel equals to 1pW as amplitude unit. [dBmV] Choose decibel equals to 1mV as amplitude unit. [dBμV] Choose decibel equals to 1μW as amplitude unit. Choose Watts as amplitude unit. -
Page 45: Marker】 Bottom Softkey
5.Menu Interpretation numeric key, step key or knob to switch resolution bandwidth. The underline under Auto or Manual means Auto mode or Manual mode. Press [RBW Auto Manual] to have Auto underlined. Then the resolution bandwidth is under auto coupling mode. Key points: ⚫... - Page 46 5.Menu Interpretation Key access: [Marker] bottom softkey → [Marker >] right softkey We can easily readout the parameters of the marked point on the trace, such as the amplitude, frequency and sweep time. Key points: ⚫ The analyzer allows for up to 8 pairs of markers to be displayed simultaneously, but only one pair or one single marker can be active at a time.
- Page 47 5.Menu Interpretation Single-tap to move the active marker to the desired frequency 5.6.1.2 [Trace 1 2 3 4 5] In the trace measurement, the marker used to activate the traces. 5.6.1.3 [Normal] One of the marker types, which is used to measure the values of X (Frequency or Time) or Y (Amplitude) at certain point of the trace.
- Page 48 5.Menu Interpretation Reference point and certain point on the trace. When selected, a pair of markers appears on the trace, which are the Reference Marker and the Delta Marker. Key points: ⚫ If a single marker already exists, the reference marker will be activated at the position of current marker.
- Page 49 5.Menu Interpretation 5.6.2【MarkerFctn >】right softkey Key access: [Marker] bottom softkey → [MarkerFctn >] right softkey Accesses the marker function setting menu. 5.6.2.1 [Function Off] Turn off marker measurement function. 5.6.2.2 [NdB On Off] Enables the N dB bandwidth measurement or sets the value of N. The N dB bandwidth denotes the frequency difference between points that are located on both sides of the current marker while the amplitude falls off (N<0) or rises (N>0) N dB separately,...
- Page 50 5.Menu Interpretation Sets the frequency counter resolution. The allowed values are 1 Hz, 10 Hz, 100 Hz and 1 kHz. Changing the counter resolution can change the counter accuracy. The higher the resolution, the higher the counting accuracy. 5.6.2.5 [FIELD>] After the antenna is connected, it is used to measure the field strength of the air signal.
- Page 51 5.Menu Interpretation Use the current marker readings to set the parameters (such as Center frequency, Reference level). → 5.6.3.1 [Mkr Sets the center frequency of the analyzer to the frequency of the current marker. This feature quickly moves the signal to the center of the screen.
- Page 52 5.Menu Interpretation frequency at which the Delta Marker is located. ⚫The function is not available in zero span mode. → 5.6.3.5 [Mkr Ref Level] Sets the reference level of the analyzer to the amplitude of the current marker. ⚫ In Normal marker mode, the reference level will be set to the amplitude of the current marker.
- Page 53 5.Menu Interpretation label.. 5.6.4.3 [Next Peak] Searches the peak whose amplitude is the closest to that of the current peak. The peak is then identified with a marker. When this key is pressed repeatedly, you can quickly find a lower peak. 5.6.4.4 [Left Peak] Searches the nearest peak located to the left of the current marker.
-
Page 54: Trace】 Hardkey
5.Menu Interpretation 5.7 【Trace】 hardkey Key access: Press Shift key, then Trace hardkey (7 in numeric keypad). As the sweep signal is displayed as a trace on the screen, you can set parameters about the trace using this key. The analyzer allows for up to five traces to be displayed at one time. -
Page 55: Detector】 Hardkey
5.Menu Interpretation 5) [View] Holds and displays current trace for observation. The trace register is not updated as the analyzer sweeps. 6) [Blank] Clear the trace on screen. The selected trace register stores the trace data, and will not be updated as the analyzer sweeps. 7) [Return] Return to the upper-level menu. -
Page 56: Table 5-1 Detector Type Comparison
5.Menu Interpretation While displaying a wider span, each pixel contains spectrum information associated with a larger subrange. That is, several samples may fall on one pixel. Which of the samples will be represented by the pixel depends on the selected detector type. The submenu includes[Trace 1 2 3 4 5], [Pos Peak], [Neg Peak], [Normal], [Sample], [RMS Avg], [Voltage Avg], [Quasi-Peak]. - Page 57 5.Menu Interpretation Quasi-Peak Quasi-peak detector is a weighted form of peak detection. The measured value drops as the repetition rate of the measured signal decreases. It is used in EMI testing. 5.8.1 [Trace 1 2 3 4 5] Select the trace, the spectrum analyzer provides 1, 2, 3, 4, 5 traces, the selected trace number and the status menu item in which the trace is located will be underlined.
-
Page 58: Display】 Hardkey
5.Menu Interpretation sample bucket. 5.8.7.2 [Quasi-Peak] Set the detector to the Quasi-Peak detector mode. This mode is available when EMI filter is turned on. The quasi-peak detector is a peak detector that is weighted by the duration and repetition rate of the signal, as specified by the CISPR 16-1-1 standard. -
Page 59: Sweep】 Hardkey
5.Menu Interpretation menu is hided after the specified time when no keys or touch screen operation. 5.9.6 [ Brightness Toggle the screen brightness between Auto and Man. When it is set to Auto, the brightness adjusts according to the environment automatically with the built-in light sensor. -
Page 60: Trig】 Hardkey
5.Menu Interpretation 5.10.3 [Sweep Cont] Press [Sweep Cont] to set the sweep mode to continuous sweep. The analyzer performs one sweep after another as soon as it is triggered. 5.11 【Trig】 hardkey Key access: Press Shift key, then Trig hardkey (5 in numeric keypad). - Page 61 5.Menu Interpretation When the Source is turned on, an independent signal or a signal with the same frequency of the current sweep signal will be output from the GEN Output 50Ω terminal on the top panel. Press the key to access the submenu includes [Output On Off], [Source GEN CW TG], [Output Level], [Output FREQ], [OF Step], [Network Meas >].
-
Page 62: Mode】 Hardkey
5.Menu Interpretation source network measurement. After connecting the instrument RF output to the RF input, the display displays a straight line on the 0dB scale after pressing the "Perform Normalization" soft menu. Note: Normalization must be turned off before performing this operation. - Page 63 5.Menu Interpretation 5.13.2.4 [Return] Return the upper-level menu. 5.13.3 [Modulation >] Enter the analog demodulation submenu. 5.13.3.1 [AM >] Enter AM demodulation submenu. 1) [Carrier Freq] Set the carrier frequency of the AM modulation signal. 2) [ IF BW] Set the demodulation bandwidth . 3)[Setup >] Set the time axis, depth axis and AF trigger of AM modulation.
- Page 64 5.Menu Interpretation Set AF triggering conditions. ⚫[AF Trigger On Off] Set AF trigger is open or close. ⚫[Edge Neg Pos] Set positive edge or negative edge. ⚫[Trigger Mode] Set trigger mode is single trigger or continue trigger. ⚫[Trigger Level] Set trigger amplitude. ⚫[Trigger Delay] Set trigger delay time.
- Page 65 5.Menu Interpretation ⚫[Return] Return to the upper-level menu. [Deviation Axis >] Set the deviation axis parameters. ⚫[Ref.Deviation] Sets the reference offset position, expressed as a vertical percentage. ⚫[Position] Set the reference position of the waveform on the deviation axis. ⚫[Scale/Div Auto Man ] Set each scale automatically or manually.
-
Page 66: System】 Hardkey
5.Menu Interpretation 5.14 【System】 hardkey Key access: Press Shift key, then System hardkey (2 in numeric keypad). The menu for system parameter settings includes [System >], [Setting >], [PowerOn/Preset >], [Save/Recall >]. For first time you use the spectrum analyzer, set the system settings, the system will store the settings, restart the machine after power off won’t change the settings. - Page 67 5.Menu Interpretation Access the option submenu. TG, EMI, CW can be selected as option. 5.14.2 [Setting >] Access the submenu for setting the analyzer, including [LAN >], [Shutdown], [Language >], [Date/Time >]. 5.14.2.1 [LAN >] Access the submenu for LAN port configuring. The analyzer supports LAN port connection for data transfer.
-
Page 68: Table 5-2 [Factory] Settings
5.Menu Interpretation time. The format is HHMMSS. E.g. 16:55:30 should be entered as 165530. ⚫ [Date/Time On Off] Turn on or off date/time display. 5.14.3 [PowerOn/Preset>] Sets the analyzer power on setting or preset setting. 1. [Power Set >] Select power-on settings as [Factory] and [User]. 2. - Page 69 5.Menu Interpretation Sweep 1.600000000GHz 3.600000000GHz 7.500000000GHz AMPTD Reference 0.00dBm Level Attenuator Auto 10 dB Scale/Div 10.00dB Scale Type Ref Offset 0.00dB Ref Unit Preamplifi Auto 1MHz Auto 1MHz Detector Trace Detector Pos Peak Type Sweep 3.6G 7.5G 1.6G Sweep Time Auto 76.731ms Auto 169.144ms Auto 202.972ms...
- Page 70 5.Menu Interpretation Trigger Auto Type Peak Peak Search Peak 10.00dB altitude Search mode Sort mode Amplitude Peak table Marker Fctn Marker Noise Frequency Count Marker Marker Trace Marker Table Meas Time Spectrum ACPR Channel Power Pass-Fail Meas Setup Channel 1.000000MHz Bandwidth Channel 2.000000MHz...
- Page 71 5.Menu Interpretation Power 99.00% Percent 5.14.4 【Save/Recall >】 Accesses the menu to save/recall the screenshot, trace data, IAStrace data or user state. 5.14.4.1 [Save >] Save screen shots, trace data, or user status. ⚫[Screen Pixmap >] Enter screenshot save submenu, you can choose to save screenshots to local memory or USB disk, the image file format is PNG.
-
Page 72: File】 Hardkey
5.Menu Interpretation Accesses the submenu to recall the screenshot, trace data, or user state. ⚫[Type >] You can choose to call back the screen image, trace data, user configuration, scatter map, or all file types to the local. The image file format is bmp, trace data file format is csv, user configuration file is user, and scatter map file is sp. - Page 73 5.Menu Interpretation 5.15.1 [Storage Int Ext] Select a file storage location: internal or external. 5.15.2 [Type >] Select the file type you wish to view under the directory, includes screen image, trace data, user states, or display all. ⚫ Screens (*.png) A screen file is the captured graphic of the screen.
-
Page 74: Help】 Hardkey
5.Menu Interpretation Press [Delete All] to delete all the files. 5.15.7.3 [Export >] When a USB disk is inserted, you can export the files in the local memory to the USB disk. Press [Select] to export the selected file to USB disk. Press [Page] to export the files in current page to USB disk. - Page 75 5.Menu Interpretation the spectrum analyzer built-in and user-defined measurement function soft menu, turn on or off the time spectrum, adjacent channel power measurement, channel power measurement, occupied bandwidth, Pass-Fail measurement menu. 5.17.1 [Measure off] You can directly close the currently running measurement function, you can also choose to close the measurement menu.
- Page 76 5.Menu Interpretation be measured from the total power ratio within the in-band power span, with a default value of 99% (the user can set this value). 5.17.6 [Pass-Fail >] Enter the pass / fail measurement function submenu. Pass / fail measurement has two modes of window measurement and limit measurement.
- Page 77 5.Menu Interpretation Turn On or Off limit measurement mode. 2) [Line Up On Off] When the upper limit line is turned on or off, the upper limit line is opened by default when the area measurement is on. 3) [Line Low On Off] When the lower limit line is turned on or off, the lower limit line is opened by default when the area measurement is on.
- Page 78 5.Menu Interpretation Select Traces to view relevant information by name, by time, and by size as desired. ⚫[First Page ] Go to the first page of current directory. ⚫[Prev Page] Go to the previous page. ⚫[Next Page] Go to the next page. ⚫[Last Page] Go to the last page.
-
Page 79: Specification
6.Specification 6. Specification This chapter lists the technical specifications and general technical specifications of the spectrum analyzer. Unless otherwise stated, the technical specifications apply to the following conditions: ⚫The instrument has been preheated for 30 minutes before use. ⚫ The instrument is in the calibration cycle and has been self-calibrated. - Page 80 6.Specification Counter resolution 1 Hz,10 Hz,100 Hz,1 kHz ± (frequency indication × frequency reference Counter uncertainty accuracy + counter resolution) Frequency Span 0 Hz,100 Hz to max frequency of instrument Span Range Span Uncertainty ± span / (sweep points-1) SSB Phase Noise (20℃ to 30℃,fc=1GHz) <...
- Page 81 6.Specification Resolution Filter <5(nominal) Shape Factor(60 dB: 3 dB) Video Bandwidth (-3 10 Hz to 3MHz,step by 1-3-5-10 dB) Resolution Bandwidth 200 Hz,9 kHz,120 kHz,1 MHz (-6 dB) (EMI option) Amplitude Measurement range DANL to +10 dBm, 100 kHz~ 10 MHz, Preamp HSA1016(TG)...
- Page 82 6.Specification Displays the average noise level( DANL ) Attenuator is 0 dB,Resolution Bandwidth and Frequency Video Bandwidth are 100 Hz,sample detection,trace average number ≥ 50,20℃ to 30℃,input resistence is 50 Ω 9 kHz to 1 MHz -95 dBm(Typical), <-88 dBm 1 MHz to 500 -140 dBm (Typical)...
- Page 83 6.Specification 6 GHz to 7.5 -129 dBm (Typical), <-119 -135 dBm (Typical),<-128 100 kHz to 1 1 MHz to 500 -160 dBm Typical) , <-150dBm HSA1016(TG) 500 MHz to -158 dBm (Typical), <-148 1.6 GHz -135 dBm (Typical),<-128 100 kHz to 1 1 MHz to 500 -160 dBm Typical)...
- Page 84 6.Specification fc ≥ 9 kHz,attenuator is 10 dB,Relative to 50 MHz,20℃ to 30℃ Preamp Off < 0.7 dB fc ≥ 100 kHz,attenuator is 10 dB,Relative to 50 MHz,20℃ to 30℃ Preamp On < 1.0 dB Input attenuation error Setting range 0 dB to 40 dB,step by 1 dB fc= 50 MHz,relative to 10 dB,20℃...
- Page 85 6.Specification Absolute amplitude accuracy fc= 50 MHz,Peak detector,Preamp off, attenuator is 10 dB,Input signal level =-10 Uncertainty dBm,20℃ to 30℃ <0.4 dB Resolution bandwidth switch Relative to 10 kHz RBW Uncertainly <0.1 dB Reference level Range -80dBm to +30 dBm,step by 1 dB 0.01 dB scale Resolution...
- Page 86 6.Specification 100 kHz to 3.6GHz 1036 (T G) 100 kHz to 7.5 GHz 1075 (T G) Level measurement uncertainly(95% Confidence degree,S/N>20 dB, resolution bandwidth and Videobandwidth are1 kHz,Preamp off, attenuator is 10 dB) Level measurement <0.7 dB uncertainly Radio frequency input VSWR(Set attenuator≥10dB) HSA1016(TG)...
- Page 87 6.Specification Distortion Second harmonic cut-off point fc ≥ 50 MHz,input signal level is -20 dBm, Second harmonic attenuator is 10 dB cut-off point(SHI) > +45 dBm Third order intermodulation cut-off point fc ≥ 50 MHz,two magnitudes are -20 dBm, frequency interval 200 kHz Two-tone signal Third order input mixer,attenuator is 0 dB intermodulation cut-off...
- Page 88 6.Specification Spurious response Input port connected to 50 Ω load,attenuator is Residual response 0 dB,20℃ to 30℃ <-90 dBm,Typical < -60 dBm Medium frequency feedthrough Local oscillator correlation,A/D transformation correlation, harmonics and subharmonics of the System dependent first oscillator are related sideband <...
- Page 89 6.Specification 5 V TTL level External trigger level Trace source(option) Trace source output HSA1016 100 kHz to 1.6 GHz Frequency range (TG) HSA1036 100 kHz to 3.6 GHz (TG) HSA1075 100 kHz to 7.5 GHz (TG) -40 dBm to 0 dBm Output level range Output level resolution 1 dB Relative to 50 MHz...
- Page 90 6.Specification reference Output level +3 dBm to +10 dBm,+8 dBm(Typical) 50 Ω(nominal) Resistance BNC negative head Connector Frequency 10 MHz ± 5 ppm Output level 0 dBm to + 10 dBm External 50 Ω(nominal) reference Resistance BNC negative head Connector External trigger output 1 kΩ(nominal)...
- Page 91 6.Specification range Storage -20 ℃to 70 ℃ temperature range ≤ 95% relative humidity Humi 0℃ to 30℃ ≤ 75% relative humidity dity 30℃ to 40℃ Altitu Altitude operation 3000 below Appearance Dimension 265 mm (width)×190 mm (high)×58 mm (depth) Weight Approx.
-
Page 92: Troubleshooting
7.Troubleshooting 7. Troubleshooting Typical issues that may occur when using your spectrum analyzer: ◼ Power on malfunction ◼ No signal displays ◼ Wrong measurement results or poor frequency or amplitude precision. 1. Power on malfunction Power on malfunction can include a situation where the screen is still dark (no display) after switch on. -
Page 93: Appendix
8.Appendix 8. Appendix Appendix A: Enclosure (The accessories subject to final delivery.) Standard Accessories Power Cord CD Rom Quick Guide AC-DC Adapter USB Cable GPS Antenna Metal Case Options N-N Cable N-SMA Cable SMA-SMA Cable SMA Adaptor N-SMA Adaptor Near Field Probe includes: Four near-field probes, Carrying Case N-SMA adapter, SMA-SMA cable ( Frequency range: 30 MHz –... -
Page 94: Appendix B: General Care And Cleaning
8.Appendix Appendix B: General Care and Cleaning General Care Do not store or leave the instrument where the liquid crystal display could be exposed to direct sunlight for long periods of time. Caution: To avoid any damage to the instrument or probes, do not exposed it to any sprays, liquids, or solvents.
Need help?
Do you have a question about the HSA1075 and is the answer not in the manual?
Questions and answers