Table of Contents
Advertisement
Quick Links
Advertisement
Table of Contents

Related Manuals for Owon SDS200S Series


Summary of Contents for Owon SDS200S Series
- Page 1 SDS200S Series Digital Storage Oscilloscope User Manual For product support, visit:www.owon.com.hk/download ※:The illustrations, interface, icons and characters in the user manual may be slightly different from the actual product. Please refer to the actual product.
- Page 2 LILLIPUT Company. Fujian LILLIPUT Optoelectronics Technology Co., Ltd. No. 19, Heming Road Lantian Industrial Zone, Zhangzhou 363005 P.R. China Tel: +86-596-2130430 Fax: +86-596-2109272 Web: www.owon.com.cn E-mail: info@owon.com.cn...
-
Page 3: General Warranty
General Warranty We warrant that the product will be free from defects in materials and workmanship for a period of 3 years from the date of purchase of the product by the original purchaser from the our company. The warranty period for accessories such as probes is 12 months. -
Page 4: Table Of Contents
Table of Contents 1. General Safety Requirements ................. 1 2. Safety Terms and Symbols ................2 3. Quick Start ......................4 Introduction to the Structure of the Oscilloscope ............4 Front Panel ..........................4 Rear Panel ..........................5 Control Area ..........................6 User Interface Introduction .................... - Page 5 Connect the output ....................... 49 Set the waveform ......................49 Output the sine waveform ......................49 Set the Frequency / Period ........................49 Set the Amplitude / High Level ......................49 Set the Offset / Low Level ........................50 Output the square waveform ....................50 Output the ramp waveform .......................
-
Page 6: General Safety Requirements
1.General Safety Requirements 1. General Safety Requirements Before use, please read the following safety precautions to avoid any possible bodily injury and to prevent this product or any other connected products from damage. To avoid any contingent danger, ensure this product is only used within the ranges specified. -
Page 7: Safety Terms And Symbols
2.Safety Terms and Symbols 2. Safety Terms and Symbols Safety Terms Terms in this manual (The following terms may appear in this manual): Warning: Warning indicates conditions or practices that could result in injury or loss of life. Caution: Caution indicates the conditions or practices that could result in damage to this product or other property. - Page 8 2.Safety Terms and Symbols It is not allowed to measure AC power when the AC powered oscilloscope is connected to the AC-powered PC through the ports. Warning: To avoid fire or electrical shock, when the oscilloscope input signal connected is more than 42V peak (30Vrms) or on circuits of more than 4800VA, please take note of below items: ...
-
Page 9: Quick Start
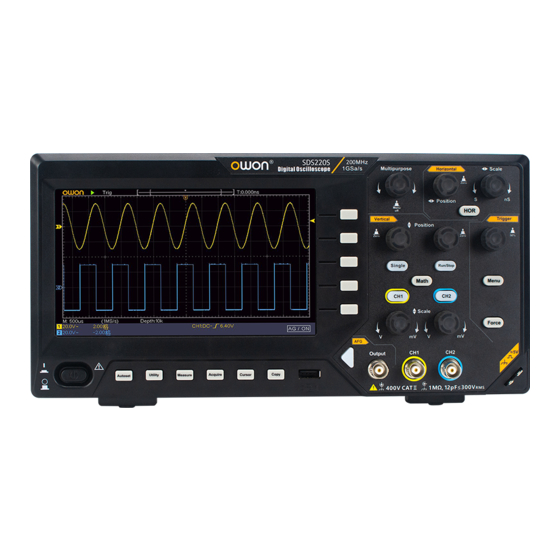
3.Quick Start 3. Quick Start Introduction to the Structure of the Oscilloscope This chapter makes a simple description of the operation and function of the front panel of the oscilloscope, enabling you to be familiar with the use of the oscilloscope in the shortest time. -
Page 10: Rear Panel
3.Quick Start 9. Function menu button. 10. Power on/off. Rear Panel Figure 3- 2 Rear Panel 1. Handle. 2. Air vents. 3. AC power input jack. 4. Foot stool: Adjust the tilt angle of the oscilloscope. 5. USB Device port: It is used to transfer data when external USB equipment connects to the oscilloscope regarded as "slave device". -
Page 11: Control Area
3.Quick Start Control Area Figure 3- 3 Control Area Overview 1. Horizontal control area:with 1 button and 2 knobs. "HOR" button refer to horizontal system setting menu, "Horizontal Position" knob control trigger position, " Horizontal Scale" control time base. 2. Trigger control area: with 2 buttons and 1 knob. The Trigger Level knob is to adjust trigger voltage. -
Page 12: User Interface Introduction
3.Quick Start User Interface Introduction Figure 3- 4 Illustrative Drawing of Display Interfaces 1. Waveform Display Area. 2. Run/Stop. 3. The state of trigger, including: Auto: Automatic mode and acquire waveform without triggering. Trig: Trigger detected and acquire waveform. Ready: Pre-triggered data captured and ready for a trigger. Scan: Capture and display the waveform continuously. -
Page 13: How To Implement The General Inspection
3.Quick Start Rising edge triggering; Falling edge triggering; Video line synchronous triggering; Video field synchronous triggering. The reading shows the trigger level value of the corresponding channel. 14. It indicates the measured type and value of the corresponding channel. "T" means period, "F"... -
Page 14: How To Implement The Function Inspection
3.Quick Start 1. Check whether there is any damage caused by transportation. If it is found that the packaging carton or the foamed plastic protection cushion has suffered serious damage, do not throw it away first till the complete device and its accessories succeed in the electrical and mechanical property tests. -
Page 15: How To Implement The Probe Compensation
3.Quick Start Figure 3- 5 Auto set Check CH2 by repeating Step 2 and Step 3. How to Implement the Probe Compensation When connect the probe with any input channel for the first time, make this adjustment to match the probe with the input channel. The probe which is not compensated or presents a compensation deviation will result in the measuring error or mistake. -
Page 16: How To Set The Probe Attenuation Coefficient
3.Quick Start Figure 3- 7 Adjust Probe How to Set the Probe Attenuation Coefficient The probe has several attenuation coefficients, which will influence the vertical scale factor of the oscilloscope. To change or check the probe attenuation coefficient in the menu of oscilloscope: (1) Push the function menu button of the used channels (CH1 or CH2 button). -
Page 17: How To Use The Probe Safely
3.Quick Start How to Use the Probe Safely The safety guard ring around the probe body protects your finger against any electric shock, shown as Figure 3- 9. Figure 3- 9 Finger Guard Warning: To avoid electric shock, always keep your finger behind the safety guard ring of the probe during the operation. - Page 18 3.Quick Start Figure 3- 10 Vertical Control Zone 1. Use the Vertical Position knob to show the signal in the center of the waveform window. The Vertical Position knob functions the regulating of the vertical display position of the signal. Thus, when the Vertical Position knob is rotated, the pointer of the earth datum point of the channel is directed to move up and down following the waveform.
-
Page 19: Introduction To The Horizontal System
3.Quick Start Introduction to the Horizontal System Shown as Figure 3- 11, there are a button and two knobs in the Horizontal Controls. The following practices will gradually direct you to be familiar with the setting of horizontal time base. Figure 3- 11 Horizontal Control Zone 1. - Page 20 3.Quick Start Figure 3- 12 Trigger Control Zone 1. Push the Trigger Menu button and call out the trigger menu. With the operations of the menu selection buttons, the trigger setting can be changed. 2. Use the Trigger Level knob to change the trigger level setting. By turning the Trigger Level knob, the trigger indicator in the screen will move up and down.
-
Page 21: Advanced User Guidebook
4.Advanced User Guidebook 4. Advanced User Guidebook This chapter will deal with the following topics mainly: How to Set the Vertical System How to Set the Horizontal System How to Set the Trigger System How to Set the Sampling/Display ... -
Page 22: How To Set The Vertical System
4.Advanced User Guidebook How to Set the Vertical System The VERTICAL CONTROLS includes three menu buttons such as CH1, CH2 and Math, and four knobs such as Vertical Position, Vertical Scale for each channel. Setting of CH1 and CH2 Each channel has an independent vertical menu and each item is set respectively based on the channel. - Page 23 4.Advanced User Guidebook Taking the Channel 1 for example, the measured signal is a square wave signal containing the direct current bias. The operation steps are shown as below: (1) Push the CH1 button to show the CH1 SETUP menu. (2) In the right menu, select Coupling as DC.
-
Page 24: Use Mathematical Manipulation Function
4.Advanced User Guidebook Take the Channel 1 as an example,the operation steps are shown as follows: (1) Push the CH1 button to show the CH1 SETUP menu. (2) In the lower menu, select Limit. (3) In the right menu, select OFF.The high-frequency components contained in the measured signal can pass through. -
Page 25: Using Fft Function
4.Advanced User Guidebook 4. In the right menu, select Sign as +. 5. In the right menu, select Factor2 as CH2. 6. Press Next Page in the right menu. Select Vertical (div), the symbol is in front of div, turn the M knob to adjust the vertical position of Math waveform. - Page 26 4.Advanced User Guidebook 2. In the right menu, select Type as FFT. 3. In the right menu, select Source as CH1. 4. In the right menu, select Window. Select the proper window type in the left menu. 5. In the right menu, select Format as Vrms or dB. 6.
- Page 27 4.Advanced User Guidebook Best solution frequency, worst magnitude. Best type measuring frequency spectrum nonrepetitive signals measuring frequency components near DC. Recommend to use for: Rectangle Transients or bursts, the signal level before and after the event are nearly equal. Equal-amplitude sine waves...
-
Page 28: Use Vertical Position And Scale Knobs
4.Advanced User Guidebook aliasing. So pay more attention to the relation between the frequency being sampled and measured. Use Vertical Position and Scale Knobs 1. The Vertical Position knob is used to adjust the vertical positions of the waveforms. The analytic resolution of this control knob changes with the vertical division. -
Page 29: Zoom The Waveform
4.Advanced User Guidebook Zoom the Waveform Push the Horizontal HOR button to enter wave zoom mode. The top half of the display shows the Main window and the bottom half displays the Zoom window. The Zoom window is a magnified portion of the Main window. In normal mode, the Horizontal Position and Horizontal Scale knobs are used to adjust the horizontal position and time base of the Main window. -
Page 30: Single Trigger
4.Advanced User Guidebook channels simultaneously. Alternate trigger: Trigger on non-synchronized signals. The Single Trigger, Alternate Trigger menus are described respectively as follows: Single Trigger Single trigger has two types: edge trigger, video trigger. Edge Trigger: It occurs when the trigger input passes through a specified voltage level with the specified slope. -
Page 31: Video Trigger
4.Advanced User Guidebook before another trigger occur. Holdoff Set Holdoff time as default value (100 ns). Reset Prev Page Enter previous page. Trigger Level: trigger level indicates vertical trig position of the channel, rotate trig level knob to move trigger level, during setting, a dotted line displays to show trig position, and the value of trigger level changes at the right corner, after setting, dotted line disappears. -
Page 32: How To Operate The Function Menu
4.Advanced User Guidebook mode is used to observe two unrelated signals. Trigger mode is edge trigger. Alternate trigger menu list: Menu Settings Instruction Set vertical channel trigger type as alternate Type trigger. Channel 1 as trigger signal. Source Channel 2 as trigger signal. Next Page Enter next page. - Page 33 4.Advanced User Guidebook Function Setting Description Menu Sample Normal sampling mode. Peak Detect Use to capture maximal and minimal samples. Finding highest and lowest points over adjacent intervals. It is used for the detection of the jamming burr and the possibility of reducing Acqu Mode Average the confusion.
-
Page 34: How To Save And Recall A Waveform
4.Advanced User Guidebook are displayed as bright spots. The operations of all control knobs are as follows: The Vertical Scale and the Vertical Position knobs of Channel 1 are used to set the horizontal scale and position. The Vertical Scale and the Vertical Position knobs of Channel 2 are used to set the vertical scale and position continuously. - Page 35 4.Advanced User Guidebook The object Wave0 –Wave15 are listed in the left menu, turn the M knob to choose the object which the waveform is saved to or recall from. Recall or close the waveform stored in the current object address. When the Object show is ON, if the current object address has been used, the stored...
-
Page 36: Save And Recall The Waveform
4.Advanced User Guidebook Function Menu Setting Description Function Save Display the save function menu. Type Image Choose the saving type as image. Save the current display screen. The file can be only stored in a USB storage, so a USB storage must be Save connected first. - Page 37 4.Advanced User Guidebook knob to choose the keys; press the M knob to input the chosen key. The length of file name is up to 25 characters. Select the key in the keyboard to confirm. 7. Recalling: The BIN waveform file could be open by our company waveform analysis software (on the supplied CD).
- Page 38 4.Advanced User Guidebook Figure 4- 2: Disk Management of computer 4. Right click 1 or 2 red mark area, choose Format. And system will pop up a warning message, click Yes. Figure 4- 3: Format the USB disk warning 5. Set File System as FAT32, Allocation unit size 4096. Check "Perform a quick format"...
- Page 39 4.Advanced User Guidebook 6. Formatting process. Figure 4- 5: Formatting the USB disk Check whether the USB disk is FAT32 with allocation unit size 4096 after formatting. Use Minitool Partition Wizard to format Download URL: http://www.partitionwizard.com/free-partition-manager.html Tip: There are many tools for the USB disk formatting on the market, just take Minitool Partition Wizard for example here.
- Page 40 4.Advanced User Guidebook Figure 4- 6: Reload Disk 4. Right click 1 or 2 red mark area, choose Format. Figure 4- 7: Choose format 5. Set File System FAT32, Cluster size 4096. Click OK. Figure 4- 8: Format setting 6. Click Apply at the top left of the menu. Then click Yes on the pop-up warning to begin formatting.
-
Page 41: How To Implement The Auxiliary System Function Setting
4.Advanced User Guidebook Figure 4- 9: Apply setting 7. Formatting process Figure 4- 10: Format process Format the USB disk successfully Figure 4- 11: Format successfully How to Implement the Auxiliary System Function Setting ●Configure Push the Utility button, select Function in the right menu, select Configure in the left menu. - Page 42 4.Advanced User Guidebook Function Setting Description Menu Function Configure Show the configure menu. Language Select demand language. Lock all keys. Unlock method: push Trigger Menu button in trigger control KeyLock area, then push Force button, repeat 3 times. Device USBTMC Select device connected type.
-
Page 43: How To Update Your Instrument Firmware
4.Advanced User Guidebook Function Menu Description Function Bring up the calibration function menu. Adjust Self Cal Carry out the self-calibration procedure. Default Call out the factory settings. ProbeCh. Check whether probe attenuation is good. Do Self Cal (Self-Calibration) The self-calibration procedure can improve the accuracy of the oscilloscope under the ambient temperature to the greatest extent. - Page 44 About in the right menu. View the model and the currently installed firmware version. 2. From a PC, visit www.owon.com.cn and check if the website offers a newer firmware version. Download the firmware file. The file name must be Scope.update.
-
Page 45: How To Measure Automatically
4.Advanced User Guidebook Press the button to power on the instrument. How to Measure Automatically Push the Measure button to display the menu for the settings of the Automatic Measurements. At most 8 types of measurements could be displayed on the bottom left of the screen. -
Page 46: The Automatic Measurement Of Voltage Parameters
4.Advanced User Guidebook the Video trigger mode. On the Scan format, period and frequency can not be measured. Measure the period, the frequency of the CH1, following the steps below: 1. Push the Measure button to show the right menu. 2. -
Page 47: The Automatic Measurement Of Time Parameters
4.Advanced User Guidebook Figure 4- 13 Mean: The arithmetic mean over the entire waveform. PK-PK: Peak-to-Peak Voltage. RMS: The true Root Mean Square voltage over the entire waveform. Max: The maximum amplitude. The most positive peak voltage measured over the entire waveform. Min: The minimum amplitude. -
Page 48: Other Measurements
4.Advanced User Guidebook Figure 4- 14 Rise Time: Time that the leading edge of the first pulse in the waveform takes to rise from 10% to 90% of its amplitude. Fall Time: Time that the falling edge of the first pulse in the waveform takes to fall from 90% to 10% of its amplitude. -
Page 49: How To Measure With Cursors
4.Advanced User Guidebook FallEdgeCnt : The number of negative transitions from the high reference value to the low reference value in the waveform. Area : The area of the whole waveform within the screen and the unit is voltage-second. The area measured above the zero reference (namely the vertical offset) is positive;... - Page 50 4.Advanced User Guidebook Display the channel to which the cursor Source measurement will be applied. Perform the following operation steps for the time and voltage cursor measurement of the channel CH1: 1. Push Cursor to display the cursor menu. 2. In the right menu, select Source as CH1. 3.
- Page 51 4.Advanced User Guidebook The Cursor Measurement for FFT mode In FFT mode, push the Cursor button to turn cursors on and display the cursor menu. The description of the cursor menu in FFT mode is shown as the following table: Function Setting Description...
-
Page 52: How To Use Executive Buttons
4.Advanced User Guidebook 2. Push Cursor to display the cursor menu. 3. In the right menu, select Window as Extension. 4. Press the first menu item in the right menu, select Freq&Vamp for Type, two blue dotted lines displayed along the horizontal direction of the screen, two blue dotted lines displayed along the vertical direction of the screen. -
Page 53: [Run/Stop] Button
4.Advanced User Guidebook Judge waveform type by Autoset Five kinds of types: Sine, Square, video signal, DC level, Unknown signal. Menu as follow: Waveform Menu Sine Multi-period, Single-period, FFT, Cancel Autoset Square Multi-period, Single-period, Rising Edge, Falling Edge, Cancel Autoset Video signal Type (line, field), Odd, Even, Line NO., Cancel Autoset... -
Page 54: How To Use The Waveform Generator (Optional)
5.How to Use the Waveform Generator (Optional) How to Use the Waveform Generator (Optional) The instrument can provide 4 basic waveforms, sine wave, square wave, ramp wave, pulse wave, and 16 arbitrary waveforms. Connect the output Connect the BNC cable to the port marked Output in the top of the oscilloscope. Warning:... -
Page 55: Set The Offset / Low Level
5.How to Use the Waveform Generator (Optional) Press Ampl/High Level key,Amplitude will display in the right menu(If there is no Amplitude in the menu, select High Level and press again to switch to Amplitude),use the M knob to set the desired value. ... -
Page 56: Set The Rise Time / Fall Time Of The Pulse Waveform
5.How to Use the Waveform Generator (Optional) Press Pulse Width/Duty key again can switch to Duty(If there is no Duty in the menu, select Pulse Width and press again to switch to Duty),use the M knob to set the desired value. Set the Rise time / Fall time of the pulse waveform ... -
Page 57: Configure
5.How to Use the Waveform Generator (Optional) Base 10 logarithmic function Lorentz Natural logarithmic waveform Ln(X) Natural logarithmic waveform Square function Configure Set the load Press the AG Output key to switch to configure setting interface. Press the Load key to set the instrument load to Hi-Z or 50ohm. -
Page 58: Communication With Pc
6.Communication with PC 6. Communication with PC The oscilloscope supports communications with a PC through USB. You can use the Oscilloscope communication software to store, analyze, display the data and remote control. For the specific operation method of Oscilloscope host software, please download and view the host help document on our download website. -
Page 59: Demonstration
7.Demonstration 7. Demonstration Example 1: Measurement a Simple Signal The purpose of this example is to display an unknown signal in the circuit, and measure the frequency and peak-to-peak voltage of the signal. 1. Carry out the following operation steps for the rapid display of this signal: (1) Set the probe menu attenuation coefficient as 10X and that of the switch in the probe switch as 10X (see "How to Set the Probe Attenuation... -
Page 60: Example 2: Gain Of A Amplifier In A Metering Circuit
7.Demonstration Figure 6- 1 Measure period and frequency value for a given signal Example 2: Gain of a Amplifier in a Metering Circuit The purpose of this example is to work out the Gain of an Amplifier in a Metering Circuit. First we use Oscilloscope to measure the amplitude of input signal and output signal from the circuit, then to work out the Gain by using given formulas. -
Page 61: Example 3: Capturing A Single Signal
7.Demonstration Gain (db) = 20×log (gain) Figure 6- 2 Waveform of Gain Measurement Example 3: Capturing a Single Signal It's quite easy to use Digital Oscilloscope to capture non-periodic signal, such as a pulse and burr etc. But the common problem is how to set up a trigger if you have no knowledge of the signal? For example, if the pulse is the logic signal of a TTL level, the trigger level should be set to 2 volts and the trigger edge be set as the rising edge trigger. -
Page 62: Example 4: Analyze The Details Of A Signal
7.Demonstration (9) In the right menu, press Next Page, select Coupling as DC. (10)In the right menu, select Slope as (rising). (11)Turn the Trigger Level knob and adjust the trigger level to the roughly 50% of the signal to be measured. (12)Check the Trigger State Indicator on the top of the screen, if it is not Ready, push down the Run/Stop button and start acquiring, wait for trigger to happen. - Page 63 7.Demonstration (1) Push the Acquire button to display the right menu. (2) In the right menu, select Acqu Mode as Peak Detect. The signal displayed on the screen containing some noise, by turning on Peak Detect function and changing time base to slow down the incoming signal, any peaks or burr would be detected by the function (see Figure 6- 4).
-
Page 64: Example 5: Application Of X-Y Function
7.Demonstration Figure 6- 5 Reduce Noise level by using Average function Example 5: Application of X-Y Function Examine the Phase Difference between Signals of two Channels Example: Test the phase change of the signal after it passes through a circuit network. -
Page 65: Example 6: Video Signal Trigger
7.Demonstration (7) Turn the Vertical Scale and Vertical Position knobs, optimizing the waveform. (8) With the elliptical oscillogram method adopted, observe and calculate the phase difference (see Figure 6- 6). The signal must be centered and kept in the horizontal direction. Figure 6- 6 Lissajous Graph Based on the expression sin (q) =A/B or C/D, thereinto, q is the phase difference angle, and the definitions of A, B, C, and D are shown as the graph... - Page 66 7.Demonstration (1) Push the Trigger Menu button to display the right menu. (2) In the right menu, select Type as Single. (3) In the right menu, select Single as Video. (4) In the right menu, select Source as CH1. (5) In the right menu, select Modu as NTSC. (6) In the right menu, press Next Page, select Sync as Field.
-
Page 67: Troubleshooting
8.Troubleshooting 8. Troubleshooting 1. Oscilloscope is powered on but no Display. Check whether the power connection is connected properly. Restart the instrument after completing the checks above. If the problem persists, please contact us and we will be under your service. -
Page 68: Technical Specifications
9.Technical Specifications 9. Technical Specifications Unless otherwise specified, the technical specifications applied are for the oscilloscope only, and Probes attenuation set as 10X. Only if the oscilloscope fulfills the following two conditions at first, these specification standards can be reached. ... - Page 69 9.Technical Specifications Performance Characteristics Instruction Vertical Resolution 8 bits (2 channels simultaneously) (A/D) Sensitivity 2 mV/div~10 V/div ±1 V (2 mV/div – 100 mV/div) Displacement ±60 V (200 mV/div – 10 V/div) SDS210(S) 100 MHz Analog bandwidth SDS215(S) 150 MHz SDS220(S) 200 MHz Single bandwidth Full bandwidth...
-
Page 70: Waveform Generator (Optional)
9.Technical Specifications Performance Characteristics Instruction Trigger level Internal ±4 div from the screen center range Trigger level Accuracy Internal ±0.3 div (typical) Trigger According to Record length and time base displacement Trigger Holdoff 100 ns – 10 s range 50% level setting Input signal frequency ≥... -
Page 71: General Technical Specifications
9.Technical Specifications Rise/fall time <30ns Overshoot <5% Ramp Bandwidth 1MHz < 2% of peak output Linearity (typical 1 kHz, 1 Vpp, symmetry 50%) Symmetry 0% to 100% Pulse Period 200ns to 1Ms Pulse Width 100ns Rise/fall time >12ns Overshoot <5% Arbitrary Bandwidth 5MHz... - Page 72 9.Technical Specifications Relative Humidity ≤ 90% Operating: 3,000 m Height Non-operating: 15,000 m Cooling Method Natural cooling Mechanical Specifications Dimension 301 mm× 152 mm×70 mm (L*H*W) Weight About 1.1 kg Interval Period of Adjustment: One year is recommended for the calibration interval period.
-
Page 73: Appendix
10.Appendix 10. Appendix Appendix A: Enclosure (The accessories subject to final delivery.) Standard Accessories: Power Cord Probe Adjust Quick Guide USB Cable Probe Options: Soft Bag Appendix B: General Care and Cleaning General Care Do not store or leave the instrument where the liquid crystal display will be exposed to direct sunlight for long periods of time. - Page 74 10.Appendix Warning: Before power on again for operation, it is required to confirm that the instrument has already been dried completely, avoiding any electrical short circuit or bodily injury resulting form the moisture.
Need help?
Do you have a question about the SDS200S Series and is the answer not in the manual?
Questions and answers