
Subscribe to Our Youtube Channel
Related Manuals for UNI-T UTS3000A Series


Summary of Contents for UNI-T UTS3000A Series
- Page 1 User’s Manual UTS3000B/A Series User’s Manual UTS3000B/A Series Spectrum Analyzer GlobalTestSupply www. .com Find Quality Products Online at: sales@GlobalTestSupply.com...
-
Page 2: Copyright Information
UNI-T or an authorized UNl-T distributor. - Page 3 If the product is shipped to the location of the UNI-T service center, UNI-T shall pay the return shipping fee. If the product is sent to any other location, the customer shall be responsible for all shipping, duties, taxes, and any other expenses.
-
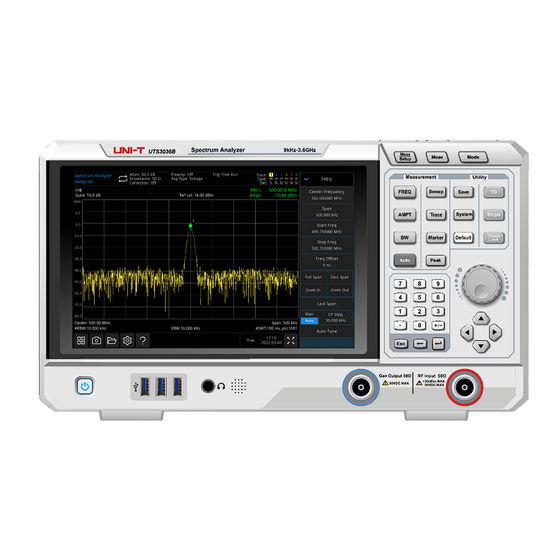
Page 4: Overview Of Front Panel
User’s Manual UTS3000B/A Series Overview This chapter is to introduce the main functions and features of UTS3000B/A spectrum analyzer, and brief introduce the front and rear panel keys and symbols Overview of UTS3000B/A UTS3000B/A is a swept spectrum analyzer with frequency range of 9kHz to 8.4GHz. It can be used as the main equipment to set up automatic control system. - Page 5 User’s Manual UTS3000B/A Series FREQ: press this key to enable center frequency function and enter the frequency setup menu AMPT: press this key to enable reference level function and enter amplitude setup menu BW: press this key to enable resolution bandwidth function and enter control bandwidth, visualize ...
-
Page 6: User Interface
User’s Manual UTS3000B/A Series built-in tracking generator. The input impedance is 50Ω. Warning It is forbidden to load input signals on the output port to avoid damage or abnormal function. 8. Loudspeaker: display analog demodulation signal and warning tone. 9. Headphone Jack: 3.5 mm. 10. - Page 7 User’s Manual UTS3000B/A Series Tap screen sign to quick switch different modes, different letter presents different mode: Letter in highlight white color, it presents the trace is being update; Letter in grey color, it presents the trace is not update; ...
-
Page 8: Overview Of Rear Panel
User’s Manual UTS3000B/A Series Overview of Rear Panel Figure 1-3 Rear Panel 10MHz Reference Input: Spectrum analyzer can use internal reference source or as an external reference source. If the instrument detects that the [REF IN 10MHz] connector is receiving a 10MHz clock signal from an ... -
Page 9: Safety Instruction
Users must follow the following conventional safety precautions in operation, service and maintenance of this device. UNI-T will not be liable for any personal safety and property loss Warning caused by the user’s failure to follow the following safety precautions. This device is designed for professional users and responsible organizations for measurement purposes. -
Page 10: Safety Statements
User’s Manual UTS3000B/A Series Safety Statements “Warning” indicates the presence of a hazard. It reminds users to pay attention to a certain operation process, operation method or similar. Personal injury or death may occur if the Warning rules in the “Warning” statement are not properly executed or observed. Do not proceed to the next step until you fully understand and meet the conditions stated in the “Warning”... - Page 11 User’s Manual UTS3000B/A Series Standby power supply: when the power switch is turned off, this device is not Power completely disconnected from the AC power supply. Supply Secondary electrical circuit connected to wall sockets through transformers or similar equipment, such as electronic instruments and electronic equipment; CAT I electronic equipment with protective measures, and any high-voltage and low-voltage circuits, such as the copier in the office.
-
Page 12: Safety Requirements
User’s Manual UTS3000B/A Series Safety Requirements Warning Please connect this device to AC power supply with the power cable provided; The AC input voltage of the line reaches the rated value of this device. See the product manual for specific rated value. Preparation before use The line voltage switch of this device matches the line voltage;... - Page 13 If this device may be faulty, please contact the authorized maintenance personnel of Abnormity UNI-T for testing. Any maintenance, adjustment or parts replacement must be done by the relevant personnel of UNI-T. Do not block the ventilation holes at the side and back of this device;...
-
Page 14: Environmental Requirements
User’s Manual UTS3000B/A Series Environmental Requirements This instrument is suitable for the following environment: Indoor use. Pollution degree 2 In operating: altitude lower to 3000 meter;in non-operating: altitude lower to 15000 meter. Operating temperature 0℃ to﹢40℃; Storage temperature -20℃ to +70℃(unless otherwise ... -
Page 15: Preparation Work
10MHz In port on the rear panel. The measuring bar on the top of the screen will indicate Freq Ref: Ext. Activate the Option If user want to activate the option, user need to input secret key of the option. Please contact UNI-T office to purchase it. -
Page 16: Touch Operation
User’s Manual UTS3000B/A Series Figure 2-2 Upgrade Package 2. Insert the USB flash drive into the USB port on the front panel of the device, then press the File System at the left bottom of the screen. Open the file system->USB flash drive>upgrade package->select xxxx.upg file, Click the menu on the right panel of the screen to load and confirm the upgrade;... -
Page 17: Operating Mode
User’s Manual UTS3000B/A Series After help information displayed on the center of the screen, tap “×” or other key to close the dialog box. ● Operating Mode Spectrum analyzer provides various operating mode, use Mode key to select it, Spectral analysis, refer to chapter 4 ... - Page 18 User’s Manual UTS3000B/A Series Enter Key If input numerical value without unit or user want to use the default unit to be the unit for this numerical value, press [Enter] key as the termination key for this numerical value. Use Panel Menu Press panel menu (vertical permutation on the right of the screen) to enter the corresponding function item, the following are examples of panel menu Switch...
- Page 19 User’s Manual UTS3000B/A Series Read Frequency and Amplitude Value 1. Press [Peak] to place a marker at 10MHz peak (the default: marker 1). Notes Frequency and amplitude value of this mark will displayed on functional area on the top right of the screen. Figure 3-1 Read Frequency and Amplitude Use rotary knob, direction key or [Peak] on the panel menu to move the marker Change Reference Level...
- Page 20 User’s Manual UTS3000B/A Series Press [AMPT]>Ref Level>20dBm 4. Place a marker at the maximum peak(10MHz): Press [Peak] next peak on the left and next peak on the right to move marker from peak to peak. Marker should at 10MHz reference signal. 5.
- Page 21 User’s Manual UTS3000B/A Series Press [AMPT]>Ref Level>20dBm 4. Place a marker at 10MHz peak and set stepped center frequency as the frequency value(10MHz)of marker: Press [Peak]>Marker→> CF Step 5. Turn on difference value△ marker function: Press [Marker]>Marker Mode>Delta △ 6. Use center frequency to increase 10MHz: Press [FREQ]>Center Frequency,...
- Page 22 User’s Manual UTS3000B/A Series Figure 3-4: Instrument Setting for Acquire Two Channel’s Signal 1. As shown in Figure 3-4, connect two signal sources to RF IN port via directional coupler. 2. Set the frequency of one of signal source to 300MHz and the frequency of another signal source to 300.1MHz, amplitude of the two signal sources to -20dBm, and turn on the signal output.
- Page 23 User’s Manual UTS3000B/A Series Figure 3-7 Distinguished Two Equal-Amplitude Signal(2) When the resolution is decreased, the sweep time will increased and the displayed signal will be smoother at the same time. For the fastest measurement, use the maximum resolution bandwidth as much as possible.
- Page 24 User’s Manual UTS3000B/A Series 5. Reduce the resolution bandwidth to check the hidden small signal: Press [BW]>3 kHz Press [Peak] Press [Marker]>Marker Mode>Delta △ Press [Marker]>Marker Frequency>10 kHz Figure 3-9: Distinguish Small Signal from Big Signal Notes UTS3000B/A’s filter has 4:8:1 shape factor. With a resolution bandwidth of 3 kHz, its 60dB bandwidth is 14.4 kHz.
- Page 25 User’s Manual UTS3000B/A Series Figure 3-10 Instrument Setting for Acquire Single Signal 3. Set the center frequency, sweep span and reference level: Press [FREQ]>Center Frequency>300MHz,Span>5MHz Press [AMPT]>Ref Level> -40dBm 4. Move all the required peak (this example is 300MHz) to the center of the screen: Press [Peak]>Marker→>CF 5.
- Page 26 User’s Manual UTS3000B/A Series Figure 3-12 Measuring Small Signal with 0dB Attenuation Reduce Resolution Bandwidth Resolution bandwidth will affect internal noise level, however, waveform continuous signal will not affect by resolution bandwidth. Reduce resolution bandwidth to 10 times, ground noise will decrease 10dB accordingly.
-
Page 27: Trace Averaging
User’s Manual UTS3000B/A Series Trace Averaging Trace averaging is a digital process that adds the current value of each trace point to the previous average and then took the average. Select the averaging, if the spectrum analyzer is automatic coupling, change the detection mode to sampling mode, it can make the displayed noise level be smooth. - Page 28 User’s Manual UTS3000B/A Series 4. Place a marker at signal peak and turn on search continuous peak function: Press [Peak] 5. Use the maximum hold to measure signal drift: Press [Trace]>Trace Type>Max Hold When the signal is changing, the maximum hold function is to remain the maximum respond of input signal.
- Page 29 User’s Manual UTS3000B/A Series Figure 3-16 Harmonic Distortion The harmonic distortion component is generated by this signal at the input mixer of the spectrum analyzer (lined up sequentially with the original 200MHz signal at 200MHz intervals). 4. Change the center frequency to the frequency value of first harmonic: Press [Peak]>Next PK Press [Marker]>Marker→>CF 5.
- Page 30 User’s Manual UTS3000B/A Series shown in Figure 3-17). The input attenuation should be adjusted up in this case. 3-17 Component of Harmonic Distortion Figure The reading of amplitude difference of △Mkr1 is affected by the following factors: 1. Increasing the input attenuation will deteriorate the signal-to-noise ratio, and that causes the reading of △Mkr1 to positive.
- Page 31 User’s Manual UTS3000B/A Series 3-18 Figure Instrument Setting of Third-Order Intercept Signal Notes Directional coupler must have high degree of isolation between the two inputs so that the two source signals will not cross modulate. 2. Set the frequency of a signal source (signal generator) to 299.95MHz, the frequency of the other signal source to 300.05MHz, so the frequency spacing is 100kHz.
- Page 32 User’s Manual UTS3000B/A Series 3-19 Figure Measuring Distortion Product Measurement of Phase Noise Measuring the phase noise is to measure the stability in the frequency domain. Specify the phase noise as the sideband power with respect to the output frequency of fundamental RF, measured at each offset of the carrier frequency and normalized to 1 Hz in measurement bandwidth.
-
Page 33: Create New File
User’s Manual UTS3000B/A Series Check Catalogue and Save File The spectrum analyzer saves and acquires data in a similar way to a personal computer: both have internal memory and a USB drive. The spectrum analyzer allows you to view and save files on the internal memory or on a USB. -
Page 34: Delete File
User’s Manual UTS3000B/A Series Move File If you need to move file or folder from catalogue or move it from the internal memory to a USB flash drive, please refer to the following steps: 1. Press >LocalDisk>UTS3036B to select file or folder; 2. -
Page 35: Key Function
User’s Manual UTS3000B/A Series 4. Key Function Notes Key function in this chapter is for sweep mode of the spectrum analyzer. FREQ Press [FREQ] key to activate the center frequency function and enter the frequency menu. The numerical value of center frequency, sweep span, start frequency and stop frequency are displayed at the bottom of the screen. - Page 36 User’s Manual UTS3000B/A Series In zero span mode, if start frequency, center frequency and stop frequency are the same, it will be modified together. Freq Offset: Set a frequency offset to explain the frequency conversion between the device under test and the import of spectrum analyzer.
- Page 37 User’s Manual UTS3000B/A Series the signal to be measured should be understood and carefully select reference level, in order to perform the best measurement effect and protect the spectrum analyzer. Attenuation(Auto/Man): Set RF front-end attenuator so that signal can pass through the mixer with low distortion (small signals with low noise).
- Page 38 User’s Manual UTS3000B/A Series 2. Correction (On/Off): The switch of correction, the default is off. 3. Close all: Close all the correction has been turned on. 4. Edit Correction: Select Provide 10 correction factors to save, the default: correction 1 Go To row Select number of revised row Insert row...
- Page 39 User’s Manual UTS3000B/A Series noise level and the signal response displayed on the screen is blurred, the ratio can be set to less than 1 to reduce the noise. When reset with [Default], the ratio is set to 1.000. User can change the ratio by using the numeric key, rotary knob, direction key or touch panel menu.
- Page 40 User’s Manual UTS3000B/A Series the sweeping points. The minimum sweep time is 1us. The maximum scan time is 4000s. Sweeping Type Rule (Normal/Accuracy) : The sweep modes are divided into common sweeping and precise sweeping. Common sweeping can get faster scanning speed, and precise sweeping is for high accuracy measurement.
- Page 41 User’s Manual UTS3000B/A Series Demod: Set the demodulation type to "AM" or "FM" or turn off the demodulation function. The default is "Off". 1. When AM (or FM) demodulation is turned on, the system will automatically turn on a cursor, locate it to the center frequency, and perform AM (or FM) demodulation for that frequency point.
- Page 42 User’s Manual UTS3000B/A Series display when a new minimum value is generated. Detector: Set the detection mode of the current measurement and apply the detection mode to the current trace. Optional detector types includes sampling, peak, negative peak, normal detection, and average. 1.
- Page 43 User’s Manual UTS3000B/A Series and add the offset, and then store the result in the target trace. During the sweep, the following calculation is performed for each point: Trace=A-B+offset In the above formula, the unit of trace data is dBm. 5.
- Page 44 User’s Manual UTS3000B/A Series Marker Mode: 1. Normal: For measuring X (frequency or time) and Y (amplitude) values in a point of trace. After selecting normal, a cursor identified by the current cursor number will appear on the trace, such as “1”, pay attention to the following points in using: If no activated cursor at the current, then activate a cursor at the center frequency of the current trace.
- Page 45 User’s Manual UTS3000B/A Series “Difference” cursor shows the reciprocal of the frequency difference. When the frequency difference is zero, then the reciprocal will be infinite and the reading show as “---”. Time: When this type of reading is selected, “Normal” and “Fixed “cursor shows the time difference between the cursor and sweep start.
- Page 46 User’s Manual UTS3000B/A Series 5. Counter ( on/off) : Turn on the frequency counting function of the cursor. The cursor displays the precise frequency of the frequency point with the maximum energy. Enable the frequency meter will affect the scanning speed. 6.
- Page 47 User’s Manual UTS3000B/A Series Marker Table: Turn on/off marker Table When the marker Table is opened, all open cursors are displayed as a Table in the window of the split screen. The display includes cursor number, marker mode, marked trace number, X-axis scale type, X-axis reading and amplitude.
- Page 48 User’s Manual UTS3000B/A Series Continue Peak Search(On/Off): Turn on/off continuous peak search, the default setting is off. When continuous peak search is turned on, the spectrum analyzer automatically performs a peak search after each sweep, which is used to track the measuring signal. Peak Table(On/Off): Turn on/off peak Table, the default setting is off.
- Page 49 User’s Manual UTS3000B/A Series Trace Selection: there are six traces for selection. 1. Press Save key, the instrument will save the current state and trace by the default file name or the input file name. 2. After the trace and state file is selected, press Recall key to read the current trace and state files. Measurement Data: Press Measurement Data panel menu to access measurement data save menu.
- Page 50 User’s Manual UTS3000B/A Series Language: Chinese, English. Clock Format: 12-hour and 24-hour. Date/Time: touch this area to pop out the setting dialog box, swipe the numeric up and down to modify it. After the setting, touch “√” to confirm it and close the setting dialog box. Picture Format: set the format of screenshot, it has bmp and png for selection.
- Page 51 User’s Manual UTS3000B/A Series (1) Access Local Area Network The computer and the oscilloscope should under the same LAN. Check the local IP address through the UTILITY menu of the spectrum analyzer, and then the browser accesses the spectrum analyzer by http://ip:9000 port.
- Page 52 User’s Manual UTS3000B/A Series Figure 4-5 Web Instrument Control The operation can be set in touch screen of a physical instrument, such as select the menu panel, click the function key, input number and character and drag the marker. And this Web page also can be operate and PrintScreen.
- Page 53 User’s Manual UTS3000B/A Series (3) Network Setting Modify the internet information and frp service of the spectrum analyzer as shown in Figure 4-6. Figure 4-6 Web Setting (4) Password Setting Modify Web password of the spectrum analyzer as shown in Figure 4-7. The original password refers to physical instrument->System->Setting->Port Setting.
- Page 54 User’s Manual UTS3000B/A Series Figure 4-7 Web Password Setting (5) SCPI Executing SCPI as shown in Figure 4-8. Input the command in edit box and click Send key, the executed result will print to the following report frame. Figure 4-8 SCPI Control Restore Defaults: enter restore default menu to perform this function.
- Page 55 User’s Manual UTS3000B/A Series Default Press [Default] key to provide a convenient start environment for measurement. Press [Default]>restore to the factory setting, 1. Reset spectrum analyzer to Spectrum Analyzer (SA) mode. 2. Enter frequency menu. 3. Set the default parameter for some environment. 4.
- Page 56 User’s Manual UTS3000B/A Series Press [TG] key to enter tracking source panel menu. Tracking source(on/off): Turn on/off tracking source. After the tracking source is turned on, [TG] key indicator on the front panel will light up, and the [Gen Output 50ω] connector on the front panel will output a signal with the same frequency as the current sweep signal.
- Page 57 User’s Manual UTS3000B/A Series Meas/Setup Press [Meas/Setup] key to open the parameter setting panel menu corresponding to the measurement selected by the current [Meas] function key. It includes the following setting. Avg|Hold Number: Set the average time of trace. User can change the average time by using the numeric key, rotary knob, direction key or touch the panel menu.
- Page 58 User’s Manual UTS3000B/A Series 4. Margin(On/Off): Turn on/off margin display. When the margin is opened, the margin line is displayed on the measurement interface. When it off, the margin is invalid. 5. Type (Upper/Lower) : Select the type of the current limit line as Upper or Lower. If the trace amplitude is greater than the upper limit amplitude or smaller than the lower limit amplitude, then the test is failed.
- Page 59 User’s Manual UTS3000B/A Series 5. One-key Measurement This chapter is to introduce how to use [Meas] key on the front panel (spectrum analysis mode). Spectrum Sweeping Press [Meas] > Swept SA There are sweep analysis (frequency domain), FFT analysis (frequency domain), or zero span analysis (time domain) for measurement.
- Page 60 User’s Manual UTS3000B/A Series mode of the spectrum analyzer. When the exponential average mode is selected, after a specified average time is reached, each channel trace data is weighted exponentially, added to the previous average value and then take the average. In the exponential average mode, the weight of the new data is larger than that of the old data, which is conducive to track signals that change slowly.
- Page 61 User’s Manual UTS3000B/A Series specified average time of sweep is reached, this average mode is used to determine the average operation mode of the spectrum analyzer. When the exponential average mode is selected, after a specified average time is reached, each channel trace data is weighted exponentially, added to the previous average value and then take the average.
- Page 62 User’s Manual UTS3000B/A Series default percentage for testing is 99%. The power-bandwidth program calculates the power sum of all signals on the trace at first. For 99% of the occupied power bandwidth, the markers are placed at the two frequency on the left and right, and the power between the two frequency accounts for 99% of the total spectrum power.
- Page 63 User’s Manual UTS3000B/A Series the panel menu. x dB: the number of dB that defines the highest point (P1) in the signal, for measuring the transmit bandwidth, the transmit bandwidth should within the span of OBW. This function is independent of the calculation of OBW.
- Page 64 User’s Manual UTS3000B/A Series after the sweeping. Select (off) to turn off this measuring average function. Avg Mode(Exponential/Repeat): Switch between exponential and repetition average mode. When the specified average time of sweep is reached, this average mode is used to determine the average operation mode of the spectrum analyzer.
- Page 65 User’s Manual UTS3000B/A Series measurement results. Sweep time range is from 1 to 999. User can change the average time by using the numeric key, rotary knob, direction key, or touch the panel menu. Measured average result will be displayed after the sweeping.
- Page 66 User’s Manual UTS3000B/A Series Figure Spectrum Monitoring Horizontal axis is frequency, vertical axis is time, and color presents the energy size of spectrum. It is used to detect the intermittent occurrence of the spectrum, and the spectrum monitoring can observe the change of the signal in a period of time.
- Page 67 User’s Manual UTS3000B/A Series Meas Preset: Reset all parameters of the current measuring mode to factory setting. Carrier to Noise Ratio Figure Measurement of Carrier-to-Noise Ratio : carrier power, noise power and carrier-to-noise-ratio. Measurement of Carrier-to-Noise Ratio Search for the maximum positive peak f1 as the carrier within the screen range, calculating the power within the carrier bandwidth centered at f1, take it as the carrier power.
- Page 68 User’s Manual UTS3000B/A Series averaging is to average the power of the signal (the square of the amplitude),the average detection type will change to RMS (power) detection.Voltage averaging is to average the voltage values of the signal envelope measured in a signal collection unit, the average detection type will changed to voltage detection, The voltage averaging is still a linear display.
- Page 69 User’s Manual UTS3000B/A Series numeric key, rotary knob, direction key, or touch the panel menu. Measured average result will be displayed after the sweeping. Select (off) to turn off this measuring average function. Avg Mode(Exponential/Repeat): Switch between exponential and repetition average mode. When the specified average time of sweep is reached, this average mode is used to determine the average operation mode of the spectrum analyzer.
- Page 70 User’s Manual UTS3000B/A Series 6. System Prompt and Troubleshooting System Prompt All the operating mode parameter setting are invalid, use the default value. Name Minimum Maximum Center Frequency 50Hz 8.409999950GHz Span Zero span Full span Start Freq 8.409999900GHz Stop Freq 100Hz 8.41GHz Freq Offset...
-
Page 71: Troubleshooting
Troubleshooting This chapter lists the possible faults and troubleshooting methods of the spectrum analyzer. Please follow the corresponding steps to handle it, if these methods is not work, please contact UNI-T and provide your machine. Device information (acquisition method: [System] >Information) After press the power soft switch, the spectrum analyzer still display a blank screen, and nothing is displayed. -
Page 72: Maintenance And Cleaning
Calibrate the instrument regularly to compensate for measurement errors caused by instrument aging. If you need calibrate the instrument after the guarantee calibration period. Please contact UNI-T company or obtain paid service from authorized measurement institutions. -
Page 73: Warranty Overview
In any case, UNI-T does not bear any responsibility for indirect, special, or consequential loss. Contact Us If the use of this product has caused any inconvenience, if you in mainland China you can contact UNI-T company directly. Service support: 8am to 5.30pm (UTC+8), Monday to Friday or via email. Our email address is infosh@uni-trend.com.cn...
Need help?
Do you have a question about the UTS3000A Series and is the answer not in the manual?
Questions and answers