Table of Contents
Advertisement
Quick Links
Advertisement
Table of Contents

Subscribe to Our Youtube Channel
Related Manuals for UNI-T UTS1000B Series


Summary of Contents for UNI-T UTS1000B Series
- Page 1 User’s Manual UTS1000B/T Series Spectrum Analyzer...
-
Page 2: Copyright Information
Copyright Information Copyright is owned by Uni-Trend Technology (China) Co., Ltd. UNI-T products are protected by patent rights in China and other countries, including issued and pending patents. Uni-Trend reserves the rights to any product specification and pricing changes. Uni-Trend Technology (China) Co., Ltd. all rights reserved. Trend reserves all rights. Information in this manual supersedes all previously published versions. -
Page 3: Warranty Service
If the product is shipped to the location of the UNI-T service center, UNI-T shall pay the return shipping fee. If the product is sent to any other location, the customer shall be responsible for all shipping, duties, taxes, and any other expenses. - Page 4 User’s Manual UTS1000B/ T Series Overview Overview of UTS1000B/T Overview of Front Panel User Interface Overview of Rear Panel This chapter is to introduce the main functions and features of UTS1000B/T spectrum analyzer, and brief introduce the front and rear panel keys and symbols Instruments.uni-trend.com 4 / 76...
- Page 5 User’s Manual UTS1000B/ T Series Overview of UTS1000B/T UTS1000B/T is a swept spectrum analyzer with frequency range of 9kHz to 3.2GHz. It can be used as the main equipment to set up automatic control system. This instrument can also meet different test and application needs in the functional/terminal/QA test systems required in the electronics manufacturing industry.
-
Page 6: Overview Of Front Panel
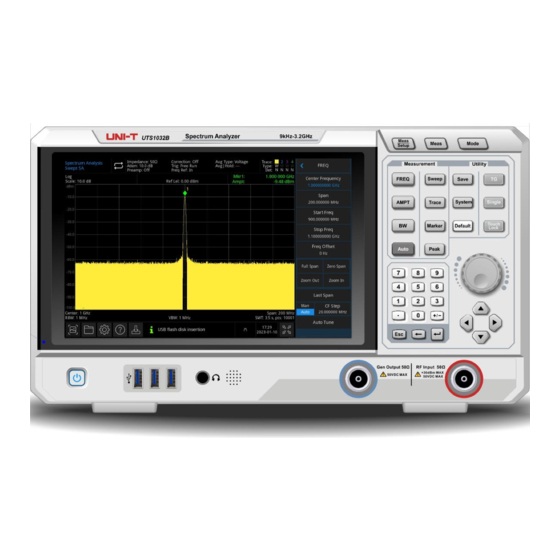
User’s Manual UTS1000B/ T Series Overview of Front Panel Figure 1-1 Front Panel 1. Display Screen: display area, touch screen. 2. Measurement: the main functions to active spectrum analyzer, including: FREQ: press this key to enable center frequency function and enter the frequency setup menu ... - Page 7 User’s Manual UTS1000B/ T Series Save: press this key to enter save interface, the types of files the instrument can save include state, trace line + state, measurement data, limit, correction and export. System: access to the system menu and set up the relevant parameters. ...
-
Page 8: User Interface
User’s Manual UTS1000B/ T Series User Interface Figure 1-2 User Interface 1. Working mode: RF analysis, vector signal analysis, EMI, analog demodulation. 2. Sweep/Measuring: Single / continuous sweep, tap the screen symbol to quick step through the mode. Measuring bar: Display the measurement information which includes input impedance, input attenuation, presetting, correction, trigger type, reference frequency, average type, and average/hold. - Page 9 User’s Manual UTS1000B/ T Series 5. Display Scale: Scale value, scale type (logarithm, linear), scale value in linear mode cannot change. 6. Reference Level: Reference level value, reference level offset value. 7. Result of Cursor Measurement: Display the current result of cursor measurement which is frequency, amplitude.
-
Page 10: Overview Of Rear Panel
User’s Manual UTS1000B/ T Series Overview of Rear Panel Figure 1-3 Rear Panel 10MHz Reference Input: Spectrum analyzer can use internal reference source or as an external reference source. If the instrument detects that the [REF IN 10MHz] connector is receiving a 10MHz clock signal from an ... - Page 11 User’s Manual UTS1000B/ T Series 10MHz clock signal generated by the instrument’s internal reference source, w hich can be used to synchronize other devices. Warning It is forbidden to load input signals on the output port to avoid damage or abnormal function. 3.
- Page 12 User’s Manual UTS1000B/ T Series 2. User Guide Inspect Product and Packing List Safety Instruction Environmental Requirements Connecting Power Supply Electrostatic Protection Preparation Work Usage Tip Touch Operation Remote Control Help Information ...
-
Page 13: Safety Instruction
Users must follow the following conventional safety precautions in operation, service and maintenance of this device. UNI-T will not be liable for any personal safety and property loss Warning caused by the user’s failure to follow the following safety precautions. This device is designed for professional users and responsible organizations for measurement purposes. - Page 14 User’s Manual UTS1000B/ T Series Safety Signs It indicates possible danger of electric shock, which may cause personal injury Danger or death. It indicates that you should be careful to avoid personal injury or product Warning damage. It indicates possible danger, which may cause damage to this device or other equipment if you fail to follow a certain procedure or condition.
-
Page 15: Safety Requirements
User’s Manual UTS1000B/ T Series Equipment designed to “initial connection”, such as power distribution system of power station, power instrument, front-end overload protection, and any outdoor transmission line. Certificatio CE indicates a registered trademark of EU. Certificatio UKCA indicates a registered trademark of United Kingdom. Conforms to UL STD 61010-1, 61010-2-030, Certified to CSA STD C22.2 No. - Page 16 Please use power fuse of specified specification. If the fuse needs to be replaced, it Power fuse must be replaced with another one that meets the specified specifications by the maintenance personnel authorized by UNI-T. There are no components available to operators inside. Do not remove the protective Disassembly cover.
- Page 17 If this device may be faulty, please contact the authorized maintenance personnel of Abnormity UNI-T for testing. Any maintenance, adjustment or parts replacement must be done by the relevant personnel of UNI-T. Do not block the ventilation holes at the side and back of this device;...
-
Page 18: Environmental Requirements
User’s Manual UTS1000B/ T Series Environmental Requirements This instrument is suitable for the following environment: Indoor use. Pollution degree 2 In operating: altitude lower to 3000 meter;in non-operating: altitude lower to 15000 meter. Operating temperature 0℃ to﹢40℃; Storage temperature -20℃ to +70℃(unless otherwise ... -
Page 19: Preparation Work
10MHz In port on the rear panel. The measuring bar on the top of the screen will indicate Freq Ref: Ext. Activate the Option If user want to activate the option, user need to input secret key of the option. Please contact UNI-T office to purchase it. -
Page 20: Remote Control
User’s Manual UTS1000B/ T Series Turn on and move the cursor Use auxiliary quick key to perform common operation Use [Touch/Lock] to turn on/off touch screen function. Remote Control The UTS1000B/T series spectrum analyzers support communication with computers via USB and LAN interfaces. -
Page 21: Function And Application
User’s Manual UTS1000B/ T Series 3. Function and Application Basic Measurement Measurement of Multiple Signal Measurement of Low Level Signal Measurement of Frequency Shift of Signal Source Measurement of Signal Distortion Measurement of Phase Noise ... -
Page 22: Basic Measurement
User’s Manual UTS1000B/ T Series Basic Measurement In this manual, key marked with [ ], such as [FREQ], [AMPT] and [Marker] are physical keys on the front panel. In most cases, press one of this hard key to enter a function menu, this menu will display on the right of the screen, such as center frequency and reference level. - Page 23 User’s Manual UTS1000B/ T Series Press [System]> Restore Defaults to select reset type. Select Setup, system setting of spectrum analyzer will return to the default. Select Data, all the saved data will be deleted. Select All,all the setting of spectrum analyzer will return to the default, delete all data. Observe Signal See the following steps to observe a simple signal.
- Page 24 User’s Manual UTS1000B/ T Series 2. Press [Marker]> Marker→> Ref Lvl Notice: Changing the reference level will change the amplitude value of the top grid line. Measurement of Multiple Signal This chapter will describe how to measure different kinds of multiple signal. Use Difference Value△...
- Page 25 User’s Manual UTS1000B/ T Series Figure 3-2 Marker Mode Difference Value△ on the Same Screen to Compare Signal Note Turn on the frequency meter to increase the resolution of marker reading. Use Difference Value△ Marker on the Different Screen to Compare Signal With difference value marker function, user can easily measure the difference of amplitude and frequency between the two signals on the different screen.
- Page 26 User’s Manual UTS1000B/ T Series signal peak(10MHz). Until the center frequency becomes 100MHz, frequency of △Mkr1 is 90MHz, which is marker 100MHz harmonic component. The annotation of △Mkr1 will show the amplitude and frequency difference of 10MHz signal peak and 100MHz signal peak. Figure 3-3 Difference Value Marker of Reference Signal Out of Screen 7.
- Page 27 User’s Manual UTS1000B/ T Series Press [Default]>Reset Press [FREQ]>Center Frequency>300MHz, Span>1MHz Press [BW]>100kHz A single envelope signal can be seen at this point. Figure 3-5 Undistinguished Two Equal-Amplitude Signals 4. Adjust the resolution bandwidth ( RBW) to 30kHz to make its lower or equal to the frequency space of two input signal: Press [BW]>RBW>300 kHz Refer to Figure 3-6, two signal peaks can be seen at this point.
- Page 28 User’s Manual UTS1000B/ T Series Figure 3-7 Distinguished Two Equal-Amplitude Signal(2) When the resolution is decreased, the sweep time will increased and the displayed signal will be smoother at the same time. For the fastest measurement, use the maximum resolution bandwidth as much as possible.
- Page 29 User’s Manual UTS1000B/ T Series Figure 3-8: Fail to Distinguish Small Signal from Big Signal 5. Reduce the resolution bandwidth to check the hidden small signal: Press [BW]>3 kHz Press [Peak] Press [Marker]>Marker Mode>Delta △ Press [Marker]>Marker Frequency>10 kHz Figure 3-9: Distinguish Small Signal from Big Signal Note UTS1000B/T’s filter has 4:8:1 shape factor.
- Page 30 User’s Manual UTS1000B/ T Series Measurement of Low Level Signal This chapter will describe how to measure the low level signal and how to distinguish it from noise in the same spectrum. The main method to measure the low signal as follows. Reduce Input Loss The spectrum analyzer's ability to measure low level signal is limited by the noise it generates internally.
- Page 31 User’s Manual UTS1000B/ T Series Figure 3-11 A Signal Close to Ground Noise Note Increase attenuation value to make ground noise close to signal level. 7. Reduce attenuation to 0dB to observe signal more clearly: Press [AMPT]>Attenuation>0>dB Figure 3-12 Measuring Small Signal with 0dB Attenuation Reduce Resolution Bandwidth Resolution bandwidth will affect internal noise level, however, waveform continuous signal will not affect by resolution bandwidth.
- Page 32 User’s Manual UTS1000B/ T Series Press [BW] to select the resolution bandwidth As the noise level is reduced, the low signal level will become clearer at this point. Figure 3-13 Reduce Resolution Bandwidth Please note that there is a sign”#” at the bottom left of the screen, it presents resolution bandwidth has no coupling.
- Page 33 User’s Manual UTS1000B/ T Series Figure 3-14 Trace Averaging Track Signal Drift This chapter will describe how to measure and track signal drift. Measurement of Frequency Shift of Signal Source This spectrum analyzer can measure the stability of a signal. Use the maximum hold function to display and keep the maximum amplitude level and frequency shift of an input signal trace.
- Page 34 User’s Manual UTS1000B/ T Series Figure 3-15 Maximum Hold and Update to Observe Signal Drift Measurement of Signal Distortion This chapter will describe how to recognize and measure signal distortion. Recognize the Distortion Generated by Spectrum Analyzer A high level input signal may cause the spectrum analyzer to generate a distortion signal, and this distortion signal will mask the true distortion to be measured on the input signal.
- Page 35 User’s Manual UTS1000B/ T Series Figure 3-16 Harmonic Distortion The harmonic distortion component is generated by this signal at the input mixer of the spectrum analyzer (lined up sequentially with the original 200MHz signal at 200MHz intervals). 4. Change the center frequency to the frequency value of first harmonic: Press [Peak]>Next PK Press [Marker]>Marker→>CF 5.
- Page 36 User’s Manual UTS1000B/ T Series In the change of input attenuation, the absolute amplitude of △Mkr1 is about ≥1dB, it can be assumed that at least part of this harmonic distortion component is generated by the spectrum analyzer (as shown in Figure 3-17).
- Page 37 User’s Manual UTS1000B/ T Series 3-18 Figure Instrument Setting of Third-Order Intercept Signal Note Directional coupler must have high degree of isolation between the two inputs so that the two source signals will not cross modulate. 2. Set the frequency of a signal source (signal generator) to 299.95MHz, the frequency of the other signal source to 300.05MHz, so the frequency spacing is 100kHz.
- Page 38 User’s Manual UTS1000B/ T Series 3-19 Figure Measuring Distortion Product Measurement of Phase Noise Measuring the phase noise is to measure the stability in the frequency domain. Specify the phase noise as the sideband power with respect to the output frequency of fundamental RF, measured at each offset of the carrier frequency and normalized to 1 Hz in measurement bandwidth.
- Page 39 User’s Manual UTS1000B/ T Series 3-20 Figure Phase Noise Check Catalogue and Save File The spectrum analyzer saves and acquires data in a similar way to a personal computer: both have internal memory and a USB drive. The spectrum analyzer allows you to view and save files on the internal memory or on a USB.
- Page 40 User’s Manual UTS1000B/ T Series If you need to move file or folder from catalogue or move it from the internal memory to a USB flash drive, please refer to the following steps: 1. Press >LocalDisk>UTS1032B to select file or folder; 2.
-
Page 41: Key Function
User’s Manual UTS1000B/ T Series 4. Key Function Frequency(FREQ) Amplitude(AMPT) Bandwidth(BW) Autotune (Auto) Sweep Trace Marker Peak File Storage(Save) System Setup Default Setup Tracking Source(TG) Single Touch/Lock Screen ... - Page 42 User’s Manual UTS1000B/ T Series FREQ Press [FREQ] key to activate the center frequency function and enter the frequency menu. The numerical value of center frequency, sweep span, start frequency and stop frequency are displayed at the bottom of the screen. Center Frequency: This function can set a specific frequency value at the center of the screen and respectively display the center frequency and sweep span values at the left and right side on the bottom of the screen.
- Page 43 User’s Manual UTS1000B/ T Series change the frequency offset. Note This parameter will not affect the hardware setting of spectrum analyzer, only change the display value of the center frequency, start and stop frequency. Set the frequency shift to 0Hz to eliminate the frequency offset. ...
- Page 44 User’s Manual UTS1000B/ T Series the user can change the input attenuation value via the numeric key, rotary knobs, direction key or touch panel menu. Note When the maximum mixer level and reference level are determined, the minimum of input attenuation ...
- Page 45 User’s Manual UTS1000B/ T Series Select Provide 10 correction factors to save, the default: correction 1 Go To row Select number of revised row Insert row Add revised point Delete row Delete select row at the current Delete Correction Delete Corrected data at the current 5.
- Page 46 User’s Manual UTS1000B/ T Series truncate some non-periodic signals, such as exponential decay signal. The flat top window behaves in the frequency domain with very small passband fluctuations as its name suggests. Auto Press [Auto] key to enable auto tune function to check input signal, the steps as follows, 1.
- Page 47 User’s Manual UTS1000B/ T Series Sweep(Single/Cont): Set the sweep mode to single and continuous, the default is continuous. The corresponding status at the top of the screen corresponding to the selected mode. Cont: Set sweep mode to continuous sweep, the icon indicates continuous.
- Page 48 User’s Manual UTS1000B/ T Series Trigger Type: Freedom trigger, external trigger and video trigger 1. Free Run: The trigger signal can be generated continuously at any time as long as the trigger conditions are met. No need to set trigger condition, after sweep each frame will sweep the next frame automatically.
- Page 49 User’s Manual UTS1000B/ T Series to noisy or noise-like signals. 2. Peak For each point on the trace, peak detection shows the maximum value of the sampled data within the corresponding time interval. 3. Negative For each point on the trace, negative peak detection shows the minimum value of the sampled data within the corresponding time interval.
- Page 50 User’s Manual UTS1000B/ T Series In the above formula, the unit of trace data is dBm. Note Trace arithmetic functions are mutually exclusive, when an arithmetic function is applied to a trace, it will turn off the last selected arithmetic function. Operand A: Set operation trace 1 in the operation function.
- Page 51 User’s Manual UTS1000B/ T Series If no activated cursor at the current, then activate a cursor at the center frequency of the current trace. The reading of the current cursor will display on the upper right of the screen. The resolution of X-axis (time or frequency) reading is related to the sweep span, which can be reduced to achieve higher reading resolution.
- Page 52 User’s Manual UTS1000B/ T Series cursor. In zero span mode, the default reading method is “Time”. Inverse Time: When this type of reading is selected, it shows the reciprocal of the sweep time difference between the difference cursor and reference cursor. When the time difference is zero, then the reciprocal will be infinite and the reading show as “---”.
- Page 53 User’s Manual UTS1000B/ T Series All Markers Off: Close all the marker point. Marker->: Use the value of the current cursor to set other system parameters of the spectrum analyzer (such as center frequency, reference level, etc.). If no cursor is available at the current, press Marker menu to activate a cursor automatically.
- Page 54 User’s Manual UTS1000B/ T Series Figure Marker List Peak Press [Peak] key to access peak search menu and perform a peak search function. Marker Frequency: The frequency point of the marker on the trace. User can change the frequency value by using the numeric key, rotary knob, direction key or touch panel menu.
- Page 55 User’s Manual UTS1000B/ T Series Continue Peak Search(On/Off): Turn on/off continuous peak search, the default setting is off. When continuous peak search is turned on, the spectrum analyzer automatically performs a peak search after each sweep, which is used to track the measuring signal. Peak Table(On/Off): Turn on/off peak Table, the default setting is off.
- Page 56 User’s Manual UTS1000B/ T Series Trace Selection: there are six traces for selection. 1. Press Save key, the instrument will save the current state and trace by the default file name or the input file name. 2. After the trace and state file is selected, press Recall key to read the current trace and state files. Measurement Data: Press Measurement Data panel menu to access measurement data save menu.
- Page 57 User’s Manual UTS1000B/ T Series Language: Chinese, English. Clock Format: 12-hour and 24-hour. Date/Time: touch this area to pop out the setting dialog box, swipe the numeric up and down to modify it. After the setting, touch “√” to confirm it and close the setting dialog box. Picture Format: set the format of screenshot, it has bmp and png for selection.
- Page 58 User’s Manual UTS1000B/ T Series Default Press [Default] key to provide a convenient start environment for measurement. Press [Default]>restore to the factory setting, 1. Reset spectrum analyzer to Spectrum Analyzer (SA) mode. 2. Enter frequency menu. 3. Set the default parameter for some environment. 4.
- Page 59 User’s Manual UTS1000B/ T Series Press [TG] key to enter tracking source panel menu. Tracking source(on/off): Turn on/off tracking source. After the tracking source is turned on, [TG] key indicator on the front panel will light up, and the [Gen Output 50ω] connector on the front panel will output a signal with the same frequency as the current sweep signal.
- Page 60 User’s Manual UTS1000B/ T Series noise or other random signals, thus highlight the stable signal characteristics in the signal. The higher the average time, the smoother the trace. Avg Type: 1. Log-Pwr averaging is to average the logarithmic amplitude values (in dB) of the signal envelope measured within a signal collection unit;...
- Page 61 User’s Manual UTS1000B/ T Series Go To Row: Select the row of the limit value table. Freq: Edit the frequency of the current point. User can change the display line level by using the numeric key, rotary knob, direction key or touch the panel menu. Ampt: Edit the current amplitude of the current point.
- Page 62 User’s Manual UTS1000B/ T Series 5. One-key Measurement This chapter is to introduce how to use [Meas] key on the front panel (spectrum analysis mode). Spectrum Sweeping Press [Meas] > Swept SA There are sweep analysis (frequency domain), FFT analysis (frequency domain), or zero span analysis (time domain) for measurement.
- Page 63 User’s Manual UTS1000B/ T Series mode of the spectrum analyzer. When the exponential average mode is selected, after a specified average time is reached, each channel trace data is weighted exponentially, added to the previous average value and then take the average. In the exponential average mode, the weight of the new data is larger than that of the old data, which is conducive to track signals that change slowly.
- Page 64 User’s Manual UTS1000B/ T Series When the exponential average mode is selected, after a specified average time is reached, each channel trace data is weighted exponentially, added to the previous average value and then take the average. In the exponential average mode, the weight of the new data is larger than that of the old data, which is conducive to track signals that change slowly.
- Page 65 User’s Manual UTS1000B/ T Series remaining 1% of the power is evenly distributed outside the marker. The frequency difference between the two markers are 99% power bandwidth and displayed on the screen. The o function can also be used to indicate the frequency difference between the center ccupied bandwidth frequency of the spectrum analyzer and the center frequency of the channel.
- Page 66 User’s Manual UTS1000B/ T Series The calculated result of xdB bandwidth is also called transmit bandwidth (EBW). A direction marker (F1 and F2) is placed at each of the two frequency of the left and right side of the highest point (P1). The amplitude of the two frequency is lower to dB number of the highest point(P1), it should be the same with the dB value specified by the user.
- Page 67 User’s Manual UTS1000B/ T Series When the exponential average mode is selected, after a specified average time is reached, each channel trace data is weighted exponentially, added to the previous average value and then take the average. In the exponential average mode, the weight of the new data is larger than that of the old data, which is conducive to track signals that change slowly.
- Page 68 User’s Manual UTS1000B/ T Series trace data is weighted exponentially, added to the previous average value and then take the average. In the exponential average mode, the weight of the new data is larger than that of the old data, which is conducive to track signals that change slowly.
- Page 69 User’s Manual UTS1000B/ T Series Horizontal axis is frequency, vertical axis is time, and color presents the energy size of spectrum. It is used to detect the intermittent occurrence of the spectrum, and the spectrum monitoring can observe the change of the signal in a period of time. Press [Meas] >Spectrum Monitor to enter the following panel menu.
- Page 70 User’s Manual UTS1000B/ T Series : carrier power, noise power and carrier-to-noise-ratio. Measurement of Carrier-to-Noise Ratio Search for the maximum positive peak f1 as the carrier within the screen range, calculating the power within the carrier bandwidth centered at f1, take it as the carrier power. Set frequency offset to make no carrier signal in the noise bandwidth.
- Page 71 User’s Manual UTS1000B/ T Series Meas Preset: Reset all parameters of the current measuring mode to factory setting. Harmonics 5-8 Harmonic Measurement Figure Harmonic Measurement: The amplitude of each sub-harmonic and the total harmonic distortion of the carrier signal, which can be measured up to 10 harmonics. THD is the total harmonic distortion.
- Page 72 User’s Manual UTS1000B/ T Series Fundamental: Set the frequency of the measured carrier signal. User can change the frequency of basic harmonic by using the numeric key, rotary knob, direction key, or touch the panel menu. By default, other harmonic measurements will be test at multiples of the specified fundamental frequency.
- Page 73 Troubleshooting This chapter lists the possible faults and troubleshooting methods of the spectrum analyzer. Please follow the corresponding steps to handle it, if these methods is not work, please contact UNI-T and provide your machine. Device information (acquisition method: [System] >Information) After press the power soft switch, the spectrum analyzer still display a blank screen, and nothing is displayed.
- Page 74 Check the fan. If the fan does not rotate and the screen is off, it presents the instrument is not enabled. In case of the above faults, do not disassemble the instrument by yourself. Please contact UNI-T immediately. 3. Spectral line is not updated for a long time.
- Page 75 In any case, UNI-T does not bear any responsibility for indirect, special, or consequential loss. Contact Us If the use of this product has caused any inconvenience, if you in mainland China you can contact UNI-T company directly. Instruments.uni-trend.com...
- Page 76 For product support outside mainland China, please contact your local UNI-T distributor or sales center. Many UNI-T products have the option of extending the warranty and calibration period, please contact your local UNI-T dealer or sales center. To obtain the address list of our service centers, please visit our website at URL: http://www.uni-trend.com...
Need help?
Do you have a question about the UTS1000B Series and is the answer not in the manual?
Questions and answers