
Subscribe to Our Youtube Channel
Related Manuals for UNI-T UTS5000A Series


Summary of Contents for UNI-T UTS5000A Series
- Page 1 User’s Manual UTS5000A Series Signal Analyzer User’s Manual UTS5000A Series Signal Analyzer REV 0 2023.10.31 Instruments.uni-trend.com 1 / 72...
- Page 2 Foreword Dear Users, Hello! Thank you for choosing this brand new UNI-T instrument. In order to use this instrument safely and correctly, please read this manual thoroughly, especially the Safety Requirements part. After reading this manual, it is recommended to keep the manual at an easily accessible place, preferably close to the device, for future reference.
-
Page 3: Copyright Information
If the products is shipped domestically to the purchase receipt of the original purchaser. If the product is shipped to the location of the UNI-T service center, UNI-T shall pay the return shipping fee. If the product is sent to any other location, the customer shall be responsible for all shipping, duties, taxes, and any other expenses. -
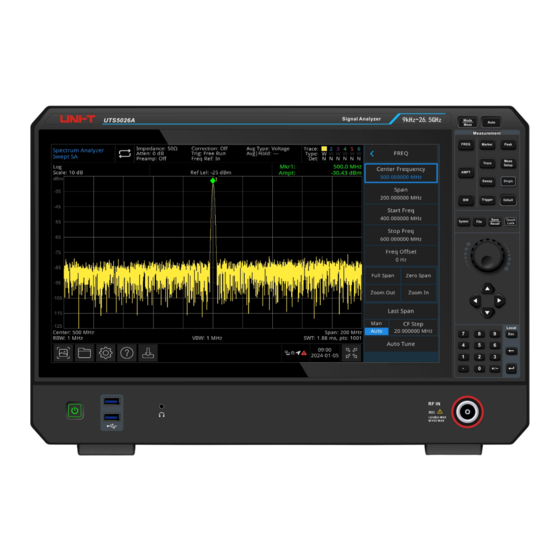
Page 4: Front Panel User Interface
UTS5000A UTS5000A series is a signal analyzer with a frequency range of 9 kHz to 26.5 GHz, which can be used as the main equipment to set up an automatic control system, and it can also meet your different testing and application needs in the test systems required for corporate R&D/factory production/educational... -
Page 5: Front Panel
User’s Manual UTS5000A Series Signal Analyzer Front Panel Figure 1-1 Front Panel Display screen: display area, touch screen 2. Advanced function key: used to active advanced measurement function of the signal analyzer, which including: Advanced measurement: access the menu of functions to measure transmitter power, such as adjacent channel power, occupied bandwidth and harmonic distortion ... - Page 6 User’s Manual UTS5000A Series Signal Analyzer display of these markers Peak: place a marker at the amplitude peak value of signal and control this marked point to perform its function Measurement setting: average/hold time and average type, display line and limit value ...
-
Page 7: User Interface
User’s Manual UTS5000A Series Signal Analyzer User Interface Figure 1-2 User Interface Working mode: spectral analysis, EMI, analog demodulation, vector signal analysis and real-time spectral analysis 2. Sweep/Measuring: the current sweep mode includes single / continuous, tap the screen icon to quick switch the mode 3. - Page 8 User’s Manual UTS5000A Series Signal Analyzer 5. Display scale: scale value, scale type (logarithm, linear). Scale value in linear mode cannot be changed 6. Reference Level: reference level value, reference level offset value 7. Result of cursor measurement: display the current result of cursor measurement, which is frequency, amplitude.
-
Page 9: Rear Panel
User’s Manual UTS5000A Series Signal Analyzer Rear Panel Figure 1-3 Rear Panel USB 2.0 port: used to connect USB and keyboard and mouse 2. HDMI port: HDMI video signal output port 3. LAN port: TCP/IP port for connecting remote control 4. - Page 10 User’s Manual UTS5000A Series Signal Analyzer Warning It is forbidden to load the input port with a signal that does not meet the rated value, and ensure that the probe or other connected accessories are effectively grounded to avoid equipment damage or abnormal function.
-
Page 11: Safety Information
Users must follow the following conventional safety precautions in operation, service and maintenance of this device. UNI-T will not be liable for any personal safety and property loss Warning caused by the user’s failure to follow the following safety precautions. This device is designed for professional users and responsible organizations for measurement purposes. - Page 12 User’s Manual UTS5000A Series Signal Analyzer Safety Statements “Warning” indicates the presence of a hazard. It reminds users to pay attention to a certain operation process, operation method or similar. Personal injury or death may occur if the rules Warning in the “Warning”...
- Page 13 User’s Manual UTS5000A Series Signal Analyzer Primary circuit of large equipment directly connected to the distribution board and circuit between the distribution board and the socket (three-phase distributor circuit includes a single commercial lighting circuit). Fixed CAT III equipment, such as multi-phase motor and multi-phase fuse box; lighting equipment and lines inside large buildings;...
-
Page 14: Environmental Requirements
If this device may be faulty, please contact the authorized maintenance personnel of Abnormity UNI-T for testing. Any maintenance, adjustment or parts replacement must be done by the relevant personnel of UNI-T. Do not block the ventilation holes at the side and back of this device;... -
Page 15: Connecting Power Supply
User’s Manual UTS5000A Series Signal Analyzer Unless otherwise specified, operating temperature is 0 to +40℃; storage temperature is -20 to+70℃ In operating: humidity temperature below to +35℃, ≤90% relative humidity In non-operating: humidity temperature +35℃ to +40℃, ≤60% relative humidity There are ventilation opening on the rear panel and side panel of the instrument. -
Page 16: Preparatory Work
Frequency: External. Activate the Option If user want to activate the option, you need to input secret key of the option. Please contact UNI-T office to purchase it. Refer to the following steps to activate the option you have purchased. -
Page 17: Touch Operation
Use [Touch Lock] to turn on/off touch screen function. Remote Control The UTS5000A series signal analyzers support communication with computers via USB and LAN interfaces. Through these interfaces, users can combine the corresponding programming language or NI-VISA, using the SCPI (Standard Commands for Programmable Instruments) command to remotely program and control the instrument, as well as interoperate with other programmable instruments that support the SCPI command set. -
Page 18: Operation Mode
User’s Manual UTS5000A Series Signal Analyzer Operation Mode The signal analyzer provides several operating modes, which can be selected by the Mode key. Spectral analysis, the detail refers to Chapter 4 Vector signal analysis Analog demodulation ... -
Page 19: Function And Application
User’s Manual UTS5000A Series Signal Analyzer 3. Function and Application Basic Measurement Measuring Multiple Signals Measuring Low Level Signal Measuring Frequency Shift of Signal Source Measuring Signal Distortion Measuring Phase Noise Checking Catalogue and Storage File This chapter introduces the main functions of this signal analyzer and how to make basic measurements. - Page 20 User’s Manual UTS5000A Series Signal Analyzer Press the panel menu (arranged vertically on the right side of the screen) to Using Front enter the corresponding function item. The following are examples of panel Panel menu. Switching Press this panel menu to switch manual/auto modes.
- Page 21 User’s Manual UTS5000A Series Signal Analyzer Figure 3-1 Read Frequency and Amplitude Using the rotary knob, arrow keys or panel menu on the [Peak] menu to move the marker. Change the reference level 1. Press [AMPT], please note that the reference level (Ref Level) is at the activated area function.
- Page 22 User’s Manual UTS5000A Series Signal Analyzer If a marker has labeled with x, it indicates this is a reference signal. 6. Use the rotary knob or the [Peak] key to move the marker 1Δ2 to the peak of the other signal.
- Page 23 User’s Manual UTS5000A Series Signal Analyzer marker at the harmonic component of 90 MHz. The annotation of ΔMkr1 displays the amplitude and frequency difference between the 10 MHz signal peak and the 90 MHz signal peak. Figure 3-3 Delta Mark of Reference Signal Outside of Screen Turn off the marker: Press [Marker]>...
- Page 24 User’s Manual UTS5000A Series Signal Analyzer Figure 3-5 Two equi-amplitude signal are not distinguished 4. Set resolution bandwidth (RBW) to 30 kHz, adjust it to lower than or equal to the frequency interval of the two input signals. Press [BW]> Resolution Bandwidth >30 kHz...
- Page 25 User’s Manual UTS5000A Series Signal Analyzer fastest measurement, use the largest resolution bandwidth as far as possible, which is the resolution coupled to the sweep width at the factory setting. Identifying the small signal hidden in the big signal In this example, use a narrow resolution bandwidth to recognize between two signals with a frequency difference of 10 kHz and an amplitude difference of 50 dBm.
- Page 26 User’s Manual UTS5000A Series Signal Analyzer Figure 3-9 Recognize a small signal from a larger signal Note The UTS5000A's filter has a shape factor of 4.1:1. When the resolution bandwidth is 3 kHz, its 60 dB bandwidth is 14.4 kHz. Half of this bandwidth (7.2 kHz) is greater than the frequency difference between the two signals (10 kHz), so the two input signals can be distinguished.
- Page 27 User’s Manual UTS5000A Series Signal Analyzer Press [AMPT]> Reference Level> -40dBm Move the selected peak (which is 300 MHz in this example) to the center of the screen Press [Peak]> Marker→> Center Frequency Decrease the sweep bandwidth to 500 kHz (as shown in Figure 3-11) Press [FREQ]>...
- Page 28 User’s Manual UTS5000A Series Signal Analyzer As the noise level decreases, the low level signal will become clearer at this point. Figure 3-13 Decreasing Resolution Bandwidth Note: There is a “#” symbol next to the RBW in the left bottom of the screen, indicating that the resolution bandwidth is uncoupled and manually adjusted.
-
Page 29: Measuring Signal Distortion
User’s Manual UTS5000A Series Signal Analyzer Tracing Drifting Signal This section introduces how to measure and trace the drifting signal. Measuring Frequency Drifting of Signal Source This signal analyzer measures the stability of a signal source and using the maximum hold function, displays and holds the maximum amplitude level and its frequency drift of an input signal trace. - Page 30 User’s Manual UTS5000A Series Signal Analyzer internally by the instrument. The user can use the trace and RF attenuator to recognize the signal. If there is In this example, use an output signal of signal generator to recognize whether the harmonic distortion component is generated by the signal analyzer.
- Page 31 User’s Manual UTS5000A Series Signal Analyzer 9. Set the RF attenuation increase to 10 dB. Press [AMPT]> Attenuation > 10dB Note: ΔMkr1 indicating a reading, this reading is the difference amplitude of the harmonic distortion component when the input attenuation is set to 0 dB and 10 dB respectively.
- Page 32 User’s Manual UTS5000A Series Signal Analyzer 3-18 Figure Instrument’s Setting of Third-order Intercept Point Signal Note Directional couplers must have a high degree of isolation between the two inputs so that the two source signals are not intermodulation. 2. Set the frequency of one signal source (signal generator) to 299.95 MHz and the frequency of the other signal source to 300.05 MHz, so that the frequency interval is 100 kHz, and the amplitude of the two...
-
Page 33: Measuring Phase Noise
User’s Manual UTS5000A Series Signal Analyzer Figure 3-19 Measure Distortion Product Measuring Phase Noise The phase noise measurement measures the stability in the frequency domain, and specify phase noise as the single-sideband power with respect to the fundamental RF output frequency, measured at various offsets from the carrier frequency and normalized to 1 Hz in the measurement bandwidth. - Page 34 User’s Manual UTS5000A Series Signal Analyzer Find File in Catalogue Tap the icon on the left bottom of the screen: find the file in the file folder This signal analyzer contains six types of files: State: save the settings of signal analyzer and the file suffix is .state Trace + State: save the trace and the file suffix is .trace...
- Page 35 User’s Manual UTS5000A Series Signal Analyzer 4. Tap “Delete” on the panel menu to delete multiple files Load Press > LocalDisk > UTS5026A to select the file 2. Tap “Load” to load the data of file, which includes state, trace, screen and limits Rename Rename the file or file folder.
- Page 36 User’s Manual UTS5000A Series Signal Analyzer 4. Key Function (Spectral Analysis) Frequency (FREQ) Amplitude (AMPT) Bandwidth (BW) Sweep Trigger Trace Marker Peak Measurement Setup (Meas/Setup) Single Default Setup (Default) ...
- Page 37 User’s Manual UTS5000A Series Signal Analyzer bandwidth will be symmetrically changed according to the center frequency. The reading of sweep bandwidth is the total displayed frequency range. To determine the sweep bandwidth for each horizontal scale division, the total displayed frequency range should be divided by 10.
- Page 38 User’s Manual UTS5000A Series Signal Analyzer frequency ranges. Zero sweep bandwidth: set the sweep bandwidth to zero. In this mode, the envelope of time-domain signal will be displayed, which equivalent of an oscilloscope. Note In the zero sweep bandwidth mode, it displays the time-domain feature of the fixed frequency components of the signal, it is very different from the non-zero sweep bandwidth mode.
- Page 39 User’s Manual UTS5000A Series Signal Analyzer Preamplifier: there are two preamplifiers, one for the low frequency band and one for the full frequency band. Control the switch of the instrument's internal preamplifier, turn on to generate the gain to compensate for the preamplifier, so that the reading of amplitude value is the actual value of the input signal.
-
Page 40: Bandwidth (Bw)
The user can change the ratio by using the numeric key, rotary knob and arrow key or touch the panel menu. RBW filter type: set the filter type of RBW. UTS5000A series supports two filters, Gaussian window and Flat window. - Page 41 User’s Manual UTS5000A Series Signal Analyzer When the sweep bandwidth is not zero When the scanning time is automatic, the signal analyzer selects an optimal (shortest) scanning time for the current setting, which is influenced by the following factors. 1. The maximum tuning frequency of the signal analyzer 2.
- Page 42 User’s Manual UTS5000A Series Signal Analyzer 2. The scanning time may become longer when the number of scanning points is increased due to the limitation of the minimum scanning point interval time. 3. Changing the number of scanning points affects several parameters of the system, so the system will be re-scanned and re-measured.
- Page 43 User’s Manual UTS5000A Series Signal Analyzer Trace Press the [Trace] key to select and control the trace and detection menu. Each trace consists of a series of data points with amplitude information, and with each scan, the signal analyzer refreshes its information for any valid trace.
- Page 44 User’s Manual UTS5000A Series Signal Analyzer refreshed with scanning. Display (ON/OFF): set ON/OFF for the selected trace Trace operation: the trace operation function performs mathematical operations between traces or between traces and the specified offsets. Off: turn off the operation function 2.
- Page 45 User’s Manual UTS5000A Series Signal Analyzer Figure 4-1 Mark Cursor Reading Ten markers can be used on the screen at the same time, and only one or a pair of markers can be controlled at one time. Select marker: select one of the ten cursors. The default is signed as marker 1. After selecting the cursor, it can set parameters such as the cursor type, the marked trace, and the reading mode.
- Page 46 User’s Manual UTS5000A Series Signal Analyzer Marker->: use the value of the current cursor to set other system parameters of the signal analyzer (such as the center frequency, reference level, etc.). If no cursor is available at the current, press the Marker menu to activate a cursor automatically.
- Page 47 User’s Manual UTS5000A Series Signal Analyzer Figure 4-2 Marker List Attribute: it contains X-axis scale selection, X-axis scale (manual/automatic) and marker line switch. X-axis scale: frequency, period, time, reverse time and marker will change the reading unit by X-axis scale.
- Page 48 User’s Manual UTS5000A Series Signal Analyzer automatically turn on, and then measuring the averaged noise level at the frequency point of the measurement cursor and normalized to a 1 Hz bandwidth. At the same time, some compensation is made for different detection methods and trace types. The noisy cursor measurement is more accurate when the "RMS average"...
- Page 49 User’s Manual UTS5000A Series Signal Analyzer Figure 4-3 Peak List Search standard: threshold line, peak threshold and peak offset Threshold line (ON/OFF): set whether to display the indicator line of peak threshold and peak offset the threshold line displays the peak offset value, the default setting is OFF.
- Page 50 User’s Manual UTS5000A Series Signal Analyzer Display line (ON/OFF): set to change the display position of display line level. The display line is a reference horizontal line with an amplitude value equal to the set value, and the corresponding amplitude unit is the same as the Y-axis unit.
-
Page 51: Default Setting
User’s Manual UTS5000A Series Signal Analyzer chapter 4. Default Setting Press the [Default] key to provide an easy environment for measurement. Press [Default]> Factory Setting, reset as the following steps. Rest the signal analyzer to signal analyzer mode (SA) Enter the frequency menu... -
Page 52: System Setup
User’s Manual UTS5000A Series Signal Analyzer System Setup Press the [System] key to enter the setup menu, it can access the system information, basic setting and network setting of the signal analyzer. System information: enter the system information panel menu to check basic and option information. - Page 53 User’s Manual UTS5000A Series Signal Analyzer Web login password: the password for logging in the browser. After successful login, you can control the instrument, execute SCPI commands, network settings, etc. on the browser. After the Web login user name and password are set, the device can be remotely controlled using a Web browser on a PC or mobile terminal, which mimics the touch screen/mouse clickable display function, just like a physical instrument, and operates as follows.
- Page 54 User’s Manual UTS5000A Series Signal Analyzer The operations that can be performed on the touch screen of the physical instrument, such as selecting menu panels, clicking on function keys, entering numbers and characters, dragging marks, etc., can also be performed on this Web page, as well as printing the screen.
-
Page 55: File System
User’s Manual UTS5000A Series Signal Analyzer Figure 4-7 Web Password Setting (6) SCPI Execute the SCPI command, as shown in the following Figure 4-8, enter the command in the SCPI command edit box, click the "Send Command" button, and the execution result will be printed in the report column as below. - Page 56 User’s Manual UTS5000A Series Signal Analyzer Create: in the file system, under any directory, press the blank space on the touch screen, and select "New" -> "Folder" in the pop-up menu to create a new folder Delete: in the file system, under any directory, select the file or file folders to be deleted, long press the touch screen to pop out the menu, select “Delete”...
- Page 57 User’s Manual UTS5000A Series Signal Analyzer Press the Export key, the instrument will save the current corrected data by the default file name or the filename entered by the user. After this file is selected, press the Import key to read the current correction file.
-
Page 58: Frequency Sweep
User’s Manual UTS5000A Series Signal Analyzer 5. One-key Measurement Frequency Sweep Channel Power Time-domain Power Occupied Bandwidth Third-order Intermodulation Adjacent Channel Power Frequency Monitoring Carrier-to-noise Ratio Harmonic Wave This chapter describes how to make one-key measurement by using the [Meas] key on the front panel (spectrum analysis mode). - Page 59 User’s Manual UTS5000A Series Signal Analyzer Press [Meas] > to enter the following panel menu. Channel Power Measurement Setup Average/Hold time (ON/OFF): press the average number (ON) to specify the average number of scans used to calculate the measurement results, the scan number range is from 1 to 10,000. The user can change the average time by using the numeric key, rotary knob and arrow key or touch the panel menu.
-
Page 60: Time-Domain Power
User’s Manual UTS5000A Series Signal Analyzer Time-domain Power Figure 5-2 Time-domain Power Press [Meas] > Time-domain Power, the system enters the zero sweep bandwidth mode and calculate the power in the time-domain. Measurement Setup Average/Hold time (ON/OFF): press the average number (ON) to specify the average number of scans used to calculate the measurement results, the scan number range is from 1 to 10,000. -
Page 61: Occupied Bandwidth
User’s Manual UTS5000A Series Signal Analyzer calculation range for time domain power measurements is from the start line to the end line. The default value is10 ms. The user can change the right boundary by using the numeric key, rotary knob and arrow key or touch the panel menu. - Page 62 User’s Manual UTS5000A Series Signal Analyzer When the exponential mode is selected, after the specified average number of scans is reached, each channel trace data is exponentially weighted, added to the previous average and averaged. When the repeat mode is selected, the weights of the new data are larger than the weights of the old data, which facilitates the tracking of slowly changing signals, and this averaging result will be displayed at the end of each scan.
-
Page 63: Third-Order Intermodulation
User’s Manual UTS5000A Series Signal Analyzer Third-order Intermodulation Figure 5-4 Third-order Intermodulation Third-order Intermodulation (TOI) is used to calculate and display the output cut-off point (IP3) and placed on the trace to indicate the direction of the signal under test and its third order products. -
Page 64: Adjacent Channel Power Ratio
User’s Manual UTS5000A Series Signal Analyzer Adjacent Channel Power Ratio Figure 5-5 Adjacent Channel Power Ratio To measure the main channel power, the previous channel and the next channel power. To respectively give an adjacent channel to the main channel and the left and right channels, the main channel is centered on the center frequency point, and the left and right adjacent channels are symmetric with respect to the main channel. -
Page 65: Frequency Monitoring
User’s Manual UTS5000A Series Signal Analyzer signal collection unit. The average detection turns to voltage detection. Noise bandwidth: set the bandwidth of the main channel, the power of which is an integral of this bandwidth (default value: 2 MHz). The user can change the bandwidth of the main channel by using the numeric key, rotary knob and arrow key or touch the panel menu. -
Page 66: Carrier To Noise Ratio
User’s Manual UTS5000A Series Signal Analyzer Average mode (exponential/repeat): switching between the exponential and repeat mode, this averaging mode is used to determine the average mode of operation of the signal analyzer when the specified number of averaging scans has been reached. - Page 67 User’s Manual UTS5000A Series Signal Analyzer the measurements will be displayed after each scan. Select (OFF) to turn off this function. Average mode (exponential/repeat): switching between the exponential and repeat mode, this averaging mode is used to determine the average mode of operation of the signal analyzer when the specified number of averaging scans has been reached.
- Page 68 User’s Manual UTS5000A Series Signal Analyzer Harmonic Wave Figure 5-8 Harmonic Wave Measurement Harmonic wave measurement: the amplitude of each harmonic and the total harmonic distortion of the carrier signal can be measured up to 10 harmonics. THD is the total harmonic distortion The harmonic analysis waveform is displayed as the concatenation of the zero sweep bandwidth waveforms of the individual harmonics.
- Page 69 User’s Manual UTS5000A Series Signal Analyzer taken at multiples of the specified fundamental frequency. The user can change the basic harmonic by using the numeric key, rotary knob and arrow key or touch the panel menu. Harmonic wave: set the harmonic time of measured carrier wave for calculating the total harmonic. The user can change the harmonic time by using the numeric key, rotary knob and arrow key or touch the panel menu.
-
Page 70: System Prompt
User’s Manual UTS5000A Series Signal Analyzer 6. System Prompt and Troubleshooting System Prompt The system prompts that the parameter settings of all working mode are invalid and use default values. Name Minimum Maximum Center frequency -79.999995 Hz 26.699999995 GHz Sweep bandwidth zero sweep bandwidth 26.780000000 GHz... -
Page 71: Troubleshooting
This chapter lists the possible faults and troubleshooting methods of the signal analyzer. Please follow the corresponding steps to handle it, if these methods is not work, please contact UNI-T and provide your machine device information (acquisition method: [System] >System Information). -
Page 72: Maintenance And Cleaning
For product support outside mainland China, please contact your local UNI-T distributor or sales center. Many UNI-T products have the option of extending the warranty and calibration period, please contact your local UNI-T dealer or sales center. To obtain the address list of our service centers, please visit our website at URL: http://www.uni-trend.com...
Need help?
Do you have a question about the UTS5000A Series and is the answer not in the manual?
Questions and answers