
Related Manuals for Pyxis DW-739 Series


Summary of Contents for Pyxis DW-739 Series
- Page 1 V1.8 Pyxis Lab® Inc. 21242 Spell Circle Tomball TX, 77375 + 1 (866) 203-8397 www.pyxis-lab.com...
- Page 2 DW-739 Series Ultra-Low Turbidity Inline Analyzers for Drinking Water User Manual Pyxis Lab Inc. October 2021...
-
Page 4: Table Of Contents
Pyxis Catalog 1. Specifications ................................. -1- 2. Un packaging ................................-2 - 3. System Layout and Features ..........................-2 - 4. Dimension and Mounting ............................. - 4 - S. Installation ................................- 6 - 5.1. Installation Requirements ..........................- 6 - 5.2. -
Page 5: Specifications
™ Protocols IP /TCP /UDP /HTTP /HTTPS/Modbus *NOTE* Pyxis Lab is consistently updating technologies, as such, specifications may change without notice. Technical specifications on the LT-739/8 can also be found in its respective Operation Manual. Contact info@pyxis-lab.com for details or www.pyxis-lab.com... -
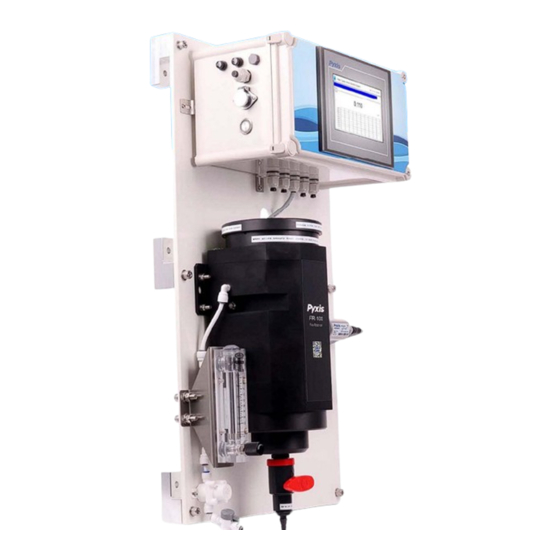
Page 6: Unpackaging
EPA-180.1 and ISO-7027 compliant formats, coupled with a Pyxis touch screen display and data logging terminal. The DW-739 series is offered in a convenient and easy to integrate panel mounted format for rapid installation and simple maintenance. - Page 7 7-inch touch screen display/data logger interface with sensor calibration integrated. Display/data logger offers 2x 4-20mA I/O as well as RS-485 for signal passthrough to any PLC or DCS network. Pyxis CloudLink 4G Gateway version available. For NSF Certified Applications the DW-739 discharge flow of approximately 200-400mL/minute may be sent to sanitary drain or returned to the inlet of the pretreatment system.
-
Page 8: Dimension And Mounting
Dimension and Mounting DW-739 Series Panel Dimensions (mm) DW-739 Series UC-100A Controller Dimensions (mm) - 4 -... - Page 9 DW-739 Series FR-100 Flow Reservoir Dimensions (mm) DW739 Series Sensor Dimensions (mm) LT-739 / LT-739B Turbidity Sensor - 5 -...
-
Page 10: Installation
Installation 5.1. Installation Requirements Power Supply: 100~240VAC 50/60Hz Water Supply:Inlet water pressure should be from 7.25 30 psi (0.05-0.2MPa) with an inlet feedwater line diameter of ¼-inch O.D. Tubing. The DW-739 is provided with an inlet Rotameter and PRV for sample water inlet flow control and limited pressure regulation. - Page 11 Figure. 2- FR-100 Connections - 7 -...
-
Page 12: Terminal Wiring
5.3. Terminal Wiring The DW-739 analyzer has universal AC power supply equipment allowing users simply to plug the power supply into a 100~240V AC 50/60Hz power outlet for normal operation. Figure. 3 - Terminal Wiring Diagram - 8 -... -
Page 14: Touch Screen Operation
After powering on the system, log in with the username and password to be able to change system settings. Click the "User Login" button, select the user "pyxis", enter the password: "888888" in the user password field. A new user can be added via "User Management" in interface of the menu. -
Page 16: Menu Bar
Press and hold the curve area for 2 seconds and then let go, the Y-axis curve range setting dialog box will appear. Users may change the display value range of Y-axis for each measurement index curve. Click the outter area of the screen to save and exit the setting screen after modifications are made. Figure. -
Page 17: Configurable Parameters
6.5. Configurable Parameters Click the "Parameter" button in the menu bar. Here you can select to enter "Alarm Parameters" and "4- 20mA Output" setting interface etc Figure. 10 - Parameter Settings 6.5.1. 4-20mA Output Parameters Setting Click "4-20mA Output " to enter the 4-20mA output parameter setting interface. The 4mA and 20mA output values should corresponds to the lower and upper limits of the sensor range. -
Page 18: Sensor Settings
6.5.2. Sensor Settings The sensor setting can configure the sensor model. The sensor has been configured before the device leaves the factory, and the customer does not need to configure it during normal use. Figure. 12- Sensor Settings 6.5.3. Communication Setting DCS communication parameters generally do not need to be changed. - Page 19 Figure. 14 - Modbus RTU Setting Figure. 15 Modbus TCP Setting - 15 -...
-
Page 20: Calibration
Turbidity Calibration The LT-739 Series Ultra Low Turbidity Sensor is rigorously calibrated at the Pyxis Lab factory. If the sensor is kept clean, the user will not need to calibrate the sensor for one year of operation. However, the user may calibrate the sensor as desired. - Page 21 Figure. 17 Turbidity Calibration Screen When calibrating, click the corresponding "Low Cal""Mid Cal""High Cal", the standard solution value input box will pop up below, enter the standard solution value in the input box to start calibration Figure. 18 - Enter the standard solution value - 17 -...
- Page 22 Click "OK", if the calibration is successful, the dialog box will show "Calibration successful". *NOTE* Because there is no global standard for zero turbidity in the industry, Pyxis recommends 0.05 NTU as a target for Low-Point Calibration while using Bubble-Free DI Water.
- Page 23 High-Range Calibration using the FR-100 Flow Reservoir: If a high-range calibration is not required, the user does not need to perform a high-range calibration of the LT-739 series sensor. If a high calibration is required, proceed by rinsing the L-CAL vessel with deionized water and refill with known turbidity standard solution between 20NTU and 40NTU for high-range calibration (see page 21).
- Page 25 - 21 -...
-
Page 26: Recovering Data
6.7. Recovering Data Click the restore button in the calibration interface of each sensor to restore the data of the turbidity sensor. If a user error is made during calibration and other operations, you may restore the factory settings of the sensor through the restore function. -
Page 27: Alarm View
6.8. Alarm View Click the "Alarm View" button on the main screen to enter the alarm view screen. Figure. 21- Alarm View In this screen users can browse all logged alarms. Drag the right scroll bar up and down to view the history of alarms. -
Page 28: Historical Data
6.9. Historical Data Click the "Historical Data" button in the menu bar to enter the data report interface. Figure. 23 - Historical Data Screen In the data report, the user can view the stored data of all parameters. The system records sensor readings every 4 seconds by default but this can be edited by the user if desired. - Page 29 Click Delete in the lower left corner. After entering the retention time, click the Delete button to clear all historical data within the retention time range. Figure. 25 - History Data Deletion Screen Click the Query button in the lower right corner, enter the start time and end time and then click the Query button.
-
Page 30: Historical Data Curves
6.10. Historical Data Curves Click the "Historical Curve" button in the menu bar to enter the trend curve interface. You can click the buttons below the X-axis to browse and view the values in a different time range. Click on Y-axis Range to change the minimum and maximum Y-axis values for a proper range. - Page 31 Figure 29 - Button Function Review Figure 30 - Time Setting Screen - 27 -...
-
Page 32: User Management
6.11. User Management Click the button on the menu bar and then you can select Figure 31 - User Management Logout enables the user to log out of the logged-in state and only view the real-time readings, but cannot perform operations such as parameter settings. Click to enter the user management interface, where you can add users, change passwords and other operations. - Page 33 Modify Password: Select the user you want to change, then click Modify User button, enter the user's own password in the User Password column and Confirm Password column, and click Confirm to modify successfully. *NOTE* If you do not want to set the password, you can delete the password and save it. Figure 33 - Modifying the User Screen - 29 -...
-
Page 34: Maintenance
Pyxis 7. Maintenance 7 .1. Correspondence Address Serial Number Definition Address Format Mode Unit Note Data format Channel 1 display float Read Only ABCD Data Channel 2 display float Read Only format ABCD Data Channel 3 display float Read Only... -
Page 35: Operation And Maintenance
Pyxis 7.2.0peration and Maintenance After the analyzer is installed by a qualified technician, it can begin to monitor water quality. The DW-739 inline detection system is designed to be simple to operate, but still requires some regular maintenance. Actual system maintenance may vary depending on the installation conditions and usage. Please refer to the table below as a general recommended maintenance schedule guidelin. -
Page 36: Instrument Alarms And Descriptions
Abnormalities Communication Turbidity Sensor Check the connection between the sensor and the circuit Turbidity Sensor without No Turbidity Communication board. If the problem persists, contact Pyxis. Communication Measurements Abnormality Turbidity Upper Turbidity above the Alarm Information Only Compare with manual measurement readings. Check and... -
Page 37: Setting Time And Date
Pyxis UC-80 & UC-100 Series 8. Setting Date, Date and Updating Firmware Procedure 8.1 Setting the Date and Time 1) When the device is powered on again, when the following screen appears on the screen, tap the screen immediately Starting Hold the touch screen to enter the system settings. - Page 38 3) Enter the setting interface, select the time parameters, as shown in the figure below, and modify the time. After the modification is completed, click the "OK" button to confirm. After closing the setting interface, click "Run project" to enter the program running interface. - 34 -...
-
Page 39: Firmware Update Procedure
Pyxis 8.2 Firmware Update Procedure Decompress the program update package, copy the "tpcbackup" file and save it to a flash drive in You need to copy the entire folder to the root directory of the USB flash drive. "FAT32" format. *NOTE*... - Page 40 5) In the new pop-up box, select the program name on the left and click "Download". The touch screen 6) When the rewind is over, the touch screen will restart, and the screen will turn black during the restart. At this time, you can pull out the USB disk, as shown in Figure 4 - 36 -...
- Page 41 7) If the update screen appears again after restart, please click "NO" and pull out the USB disk, as shown in Figure 5 - 37 -...
-
Page 42: Order Information
(Drinking Water Turbidity Analyzer for EPA-180. 1 Compliant Markets) DW-7398 42144 (Drinking Water Turbidity Analyzer for ISO-702 7 Compliant Markets) DW-739-G 42145 (DW-739 with optional Pyxis Cloudlink™ 4G Gateway) DW-7398- G 42146 {DW-739B with optional Pyxis Cloudlink™ 4G Gateway) Optional / Replacement Accessories Information UC-100A Display/Data Logging Terminal...
Need help?
Do you have a question about the DW-739 Series and is the answer not in the manual?
Questions and answers