Table of Contents
Advertisement
Quick Links
Advertisement
Table of Contents

Related Manuals for EXFO MaxTester 700


Summary of Contents for EXFO MaxTester 700
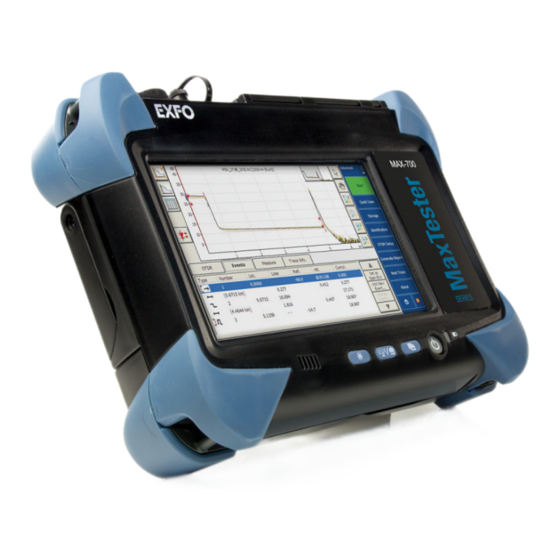
- Page 1 User Guide MAX-700...
- Page 2 Copyright © 2012 EXFO Inc. All rights reserved. No part of this publication may be reproduced, stored in a retrieval system or transmitted in any form, be it electronically, mechanically, or by any other means such as photocopying, recording or otherwise, without the prior written permission of EXFO Inc.
- Page 3 End-User License Agreement You have acquired a device ("DEVICE") that includes software licensed by EXFO Inc. (EXFO) from an affiliate of Microsoft Corporation ("MS"). Those installed software products of MS origin, as well as associated media, printed materials, and "online" or electronic documentation ("SOFTWARE") are protected by international intellectual property laws and treaties.
- Page 4 SOFTWARE. To be valid, the label must be affixed to the DEVICE, or appear on [COMPANY's] software packaging. If you receive the label separately other than from EXFO, it is invalid. You should keep the label on the DEVICE or packaging to prove that you are licensed to use the SOFTWARE.
-
Page 5: Table Of Contents
Starting Instrument Applications ..................38 Timer ............................39 4 Preparing Your MAX-700 for a Test ............41 Installing the EXFO Universal Interface (EUI) .................41 Cleaning and Connecting Optical Fibers ................42 Naming Trace Files Automatically ..................44 Enabling or Disabling the First Connector Check ..............48 Setting Macrobend Parameters .....................49... - Page 6 Contents 6 Testing Fibers in Advanced Mode ..............55 Setting the Autorange Acquisition Time ................60 Setting the IOR, RBS Coefficient, and Helix Factor ..............61 Setting Distance Range, Pulse Width, and Acquisition Time ..........63 Enabling the High-Resolution Feature ...................66 Enabling or Disabling Analysis After Acquisition ..............68 Setting Pass/Fail Thresholds ....................70 Setting a Default Span Start and Span End ................75 7 Testing Fibers in Fault Finder Mode ............77...
- Page 7 Contents 9 Analyzing Traces and Events ..............107 Graph View .........................108 Linear View .........................110 Summary Table ........................112 Events Tab ...........................114 Measure Tab ........................118 Trace Info. Tab ........................118 Displaying the Graph in Full Screen ..................119 Selecting the Default View ....................121 Automatically Displaying the Event Table after Acquisitions ..........123 Automatically Zooming in on the Fiber Span ..............124 Using Zoom Controls ......................125 Setting Trace Display Parameters ..................128...
- Page 8 Contents 12 Creating and Generating Reports ............185 Adding Information to the Test Results ................185 Generating a Report ......................187 13 Using the OTDR as a Light Source ............193 14 Setting Up Your Unit .................197 Adjusting Brightness ......................197 Adjusting Microphone and Headphones Volume ..............198 Recalibrating the Touchscreen ....................202 Enabling or Disabling the Touchscreen Right-Click Feature ..........205 Customizing the On-Screen Keyboard ................208...
- Page 9 Restoring Your Unit to Normal Operation ................324 Contacting the Technical Support Group ................333 Transportation ........................334 22 Warranty ....................335 General Information ......................335 Liability ..........................336 Exclusions ...........................336 Certification ........................336 Service and Repairs ......................337 EXFO Service Centers Worldwide ..................338 A Technical Specifications ................339 MAX-700...
- Page 10 Contents B Description of Event Types ..............341 Span Start ..........................342 Span End ...........................342 Short Fibers ........................342 Continuous Fiber .......................343 End of Analysis ........................344 Non-Reflective Event ......................345 Reflective Event .........................346 Positive Event ........................347 Launch Level ........................348 Fiber Section ........................349 Merged Event ........................350 Echo ..........................356 Reflective Event (Possible Echo) ..................357 Index .......................359...
-
Page 11: Certification Information
Electronic test and measurement equipment is exempt from FCC part 15, subpart B compliance in the United States of America and from ICES-003 compliance in Canada. However, EXFO Inc. makes reasonable efforts to ensure compliance to the applicable standards. The limits set by these standards are designed to provide reasonable protection against harmful interference when the equipment is operated in a commercial environment. - Page 12 The Low Voltage Directive 2004/108/EC The EMC Directive 93/68/EEC CE Marking And their amendments Manufacturer’s Name and Address: EXFO Inc. EXFO Europe 400 Godin Avenue Omega Enterprise Park, Electron Way Quebec City, Quebec Chandlers Ford, Hampshire G1M 2K2 CANADA SO53 4SE ENGLAND Tel.: +1 418 683-0211...
-
Page 13: Introducing The Max-700
Introducing the MAX-700 The MAX-700 allows you to characterize a fiber-optic span, usually optical fiber sections joined by splices and connectors. The optical time domain reflectometer (OTDR) provides an inside view of the fiber, and can calculate fiber length, attenuation, breaks, total return loss, and splice, connector and total losses. - Page 14 Introducing the MAX-700 Main Features Possible to perform quick acquisitions with low noise levels to enable accurate low-loss splice location. Possible to acquire OTDR traces made of up to 256 000 points that provide a sampling resolution as fine as 4 cm. Possible to use the OTDR port as a light source.
- Page 15 Introducing the MAX-700 Main Features Back Support Support Battery compartment MAX-700...
- Page 16 Introducing the MAX-700 Main Features Internal Wi-Fi/Bluetooth devices USB host ports (optional; sticker indicates that devices are present) RJ-45 port Headset/microphone port Stylus VFL (optional) Fiber inspection probe port Built-in power meter AC adapter/charger (optional) connector OTDR instrument (see hereafter for details) MAX-700...
- Page 17 Introducing the MAX-700 Main Features OTDR Instrument MAX-710 Active LED (on when laser is emitting) OTDR port (singlemode) MAX-730 OTDR port (singlemode live) Active LED (on when laser is emitting) OTDR port (singlemode) MAX-700...
-
Page 18: Led Indicators Description
Introducing the MAX-700 LED Indicators Description LED Indicators Description There are two LED indicators located on the front panel of your unit, providing you with information about the power and battery statuses. Status Meaning Green Unit is on. Green, blinking Unit is in Standby mode. -
Page 19: Function Buttons Description
Introducing the MAX-700 Function Buttons Description Function Buttons Description Your unit is equipped with function buttons which give you access to various tools at all times. The table below shows an overview of their purpose. Button Meaning Adjusts screen brightness (5 levels). Displays the on-screen keyboard ... -
Page 20: Optional Software Package
Introducing the MAX-700 Optional Software Package Optional Software Package An optional software package is offered with the application. With the optional Auto Diagnostic (AD) software package you can: Have access to the “linear view”, which displays the events sequentially, from left to right. Find macrobends and view the related information. -
Page 21: Otdr Basic Principles
Introducing the MAX-700 OTDR Basic Principles OTDR Basic Principles An OTDR sends short pulses of light into a fiber. Light scattering occurs in the fiber due to discontinuities such as connectors, splices, bends, and faults. An OTDR then detects and analyzes the backscattered signals. The signal strength is measured for specific intervals of time and is used to characterize events. - Page 22 Introducing the MAX-700 OTDR Basic Principles An OTDR uses the effects of Rayleigh scattering and Fresnel reflection to measure the fiber’s condition, but the Fresnel reflection is tens of thousands of times greater in power level than the backscatter. Rayleigh scattering occurs when a pulse travels down the fiber and ...
-
Page 23: Power Sources
Introducing the MAX-700 Power Sources Power Sources Your unit operates with the following power sources: AC adapter/charger (connected to standard power outlet—indoor use only). Compatible car outlet adapter available upon request. One lithium-ion rechargeable battery (automatically takes over if you ... -
Page 24: Conventions
Introducing the MAX-700 Conventions Conventions Before using the product described in this guide, you should understand the following conventions: ARNING Indicates a potentially hazardous situation which, if not avoided, could result in death or serious injury. Do not proceed unless you understand and meet the required conditions. -
Page 25: Safety Information
Safety Information ARNING Do not install or terminate fibers while a light source is active. Never look directly into a live fiber and ensure that your eyes are protected at all times. ARNING The use of controls, adjustments and procedures other than those specified herein may result in exposure to hazardous situations or impair the protection provided by this unit. -
Page 26: Laser Safety Information
Safety Information Laser Safety Information Laser Safety Information Units with Built-In VFL Your instrument is a Class 3R laser product in compliance with standards IEC 60825-1 and 21 CFR 1040.10. It is potentially harmful in direct intrabeam viewing. The following label(s) indicate that the product contains a Class 3R source: Affixed to bottom panel of unit Units without VFL Your instrument is a Class 1M laser product in compliance with standards... -
Page 27: Electrical Safety Information
Capacitors inside the unit may be charged even if the unit has been disconnected from its electrical supply. Use only the AC adapter/charger provided by EXFO with your unit. MAX-700... - Page 28 Safety Information Electrical Safety Information Equipment Ratings Temperature Operation 0 °C to 50 °C (32 °F to 122 °F) Storage -40 °C to 70 °C (-40 °F to 158 °F) Relative humidity 95 % non-condensing unit ...
-
Page 29: Getting Started With Your Max-700
Getting Started with Your MAX-700 Using the Supports Your unit has been designed to stand either vertically (with the screen facing you), or at an angle, using the two supports. Note: The supports ensure optimum stability to the unit during your tests. To change the orientation of the unit using the supports: Pull out the two supports. -
Page 30: Securing Your Unit Using A Kensington Lock
Getting Started with Your MAX-700 Securing Your Unit Using a Kensington Lock Securing Your Unit Using a Kensington Lock Your unit is equipped with a security slot to which you can connect an optional Kensington lock (security cable). You can secure your unit with this lock to help prevent theft. -
Page 31: Installing A Keyboard, Mouse Or Other Usb Devices
Getting Started with Your MAX-700 Installing a Keyboard, Mouse or Other USB Devices Installing a Keyboard, Mouse or Other USB Devices Your unit supports many USB devices. The table below lists the supported USB devices. Device Details Memory key For data transfer between your unit and a computer when you do not have access to a network. - Page 32 RS-232 (serial) ports. For (purchased from more information, see Using the USB to RS-232 EXFO) Adapter on page 271. You can connect several devices at the same time. MPORTANT Your unit does not support USB printers. If you want to print...
- Page 33 Getting Started with Your MAX-700 Installing a Keyboard, Mouse or Other USB Devices To install a USB device on your unit: Connect the USB device to any of the USB ports (located on top of the unit). Note: It is not necessary to turn off the unit before connecting the USB device. The software will automatically detect its presence.
-
Page 34: Using The On-Screen (Virtual) Keyboard
Getting Started with Your MAX-700 Using the On-Screen (Virtual) Keyboard Using the On-Screen (Virtual) Keyboard Your unit is equipped with an on-screen keyboard that supports multilingual features. This keyboard functions according to the keyboard settings of Windows. To use the on-screen keyboard: 1. -
Page 35: Right-Clicking With The Touchscreen
Getting Started with Your MAX-700 Right-Clicking with the Touchscreen Right-Clicking with the Touchscreen If you are used to work with a mouse, you may find it useful to be able to perform a right-click on your touchscreen. To right-click with the touchscreen: From the location where you want to right-click, using the stylus or any blunt pointing device, press the screen for a few seconds until the shortcut menu appears. -
Page 36: Turning On Or Off The Unit
Getting Started with Your MAX-700 Turning On or Off the Unit Turning On or Off the Unit There are several ways to turn off the unit, including the following: Standby: keeps the unit’s status information in memory (RAM). The next time you turn your unit on, you will quickly return to your work environment (running applications will still be running).This mode will take more battery power while the unit is off. - Page 37 Getting Started with Your MAX-700 Turning On or Off the Unit To turn on the unit: Press the On/Off button. To turn off the unit: 1. Press the On/Off button. On the Windows taskbar, tap Start. This will display the standard shutdown window, from which you have a choice of actions or shutdown modes.
- Page 38 Getting Started with Your MAX-700 Turning On or Off the Unit 3. From the When I press the power button on my computer list, select the desired behavior (Ask me what to do option is selected by default). 4. Tap Apply to confirm the changes, and then OK to return to Control Panel.
- Page 39 Getting Started with Your MAX-700 Turning On or Off the Unit To configure your unit to automatically restart after AC power comes back: 1. From the Main Menu, tap System Settings. 2. From the System Settings window, tap Startup Applications. 3.
-
Page 40: Installing Or Upgrading The Applications
Getting Started with Your MAX-700 Installing or Upgrading the Applications Installing or Upgrading the Applications All the necessary applications have been preinstalled and configured at the factory. However, you may have to upgrade some applications when new versions become available or to reinstall them. From the DVD that came with your unit, you can create an installation USB key in case you ever need to reinstall the MAX-700 software (the software that comes with your unit) and the instrument applications as well as... - Page 41 Getting Started with Your MAX-700 Installing or Upgrading the Applications For the creation of an installation USB key, you will need: the installation DVD a computer equipped with a USB port; Windows must be installed on the computer a USB memory key ...
- Page 42 Getting Started with Your MAX-700 Installing or Upgrading the Applications To update or reinstall Update Manager: 1. If necessary, retrieve the desired installation files from the Internet. If you do not intend to download files directly on your unit, connect a USB memory key to one of the USB ports of the computer and copy the installation files to this USB key.
- Page 43 Getting Started with Your MAX-700 Installing or Upgrading the Applications To install or upgrade the applications: 1. If necessary, retrieve the desired installation files from the Internet. If you do not intend to download files directly on your unit, connect a USB memory key to one of the USB ports of the computer and copy the installation files to this USB key.
- Page 44 Getting Started with Your MAX-700 Installing or Upgrading the Applications To create an installation USB key: 1. Turn on the computer and insert the installation DVD in the CD/DVD drive. 2. Connect a USB memory key to one of the USB ports of the computer. 3.
-
Page 45: Activating Software Options
However, if you purchase options afterwards, you will have to activate them yourself. Before being able to activate options, you need to contact EXFO with the following information: Purchase order number of the newly purchased options ... - Page 46 Getting Started with Your MAX-700 Activating Software Options To activate the options for your unit: 1. Connect a USB memory key to one of the USB ports of your computer. 2. Copy the key file to the USB memory key. 3.
- Page 47 Getting Started with Your MAX-700 Activating Software Options 5. In the Platform Options tab, use the Browse button to locate the key file that you want to use. 6. Press Activate. The option indicator will turn into a green check mark to confirm that the option is now active.
- Page 48 Getting Started with Your MAX-700 Activating Software Options To activate software options for your module: 1. Connect a USB memory key to one of the USB ports of your computer. 2. Copy the key file to the USB memory key. 3.
- Page 49 Getting Started with Your MAX-700 Activating Software Options 5. In the Module Options tab, use the Browse button to locate the key file that you want to use. 6. Press Activate. The option indicator will turn into a green check mark to confirm that the option is now active.
-
Page 50: Starting Instrument Applications
Getting Started with Your MAX-700 Starting Instrument Applications Starting Instrument Applications Your OTDR can be configured and controlled from its dedicated application in the MAX-700 software. To start an application: At the bottom of the main window, press the button corresponding to the desired application. -
Page 51: Timer
Getting Started with Your MAX-700 Timer To start the Power Meter or Probe application: From Main Menu, press Power Meter or Probe. The main window (shown below) contains all the commands required to control the OTDR instrument: Data display Button bar Function Tabs Note: Due to screen resolution, the appearance of your OTDR application may... -
Page 53: Preparing Your Max-700 For A Test
Preparing Your MAX-700 for a Test Installing the EXFO Universal Interface (EUI) The EUI fixed baseplate is available for connectors with angled (APC) or non-angled (UPC) polishing. A green border around the baseplate indicates that it is for APC-type connectors. -
Page 54: Cleaning And Connecting Optical Fibers
To ensure maximum power and to avoid erroneous readings: Always inspect fiber ends and make sure that they are clean as explained below before inserting them into the port. EXFO is not responsible for damage or errors caused by bad fiber cleaning or handling. - Page 55 EXFO uses good quality connectors in compliance with EIA-455-21A standards. To keep connectors clean and in good condition, EXFO strongly recommends inspecting them with a fiber inspection probe before connecting them. Failure to do so will result in permanent damage to the connectors and degradation in measurements.
-
Page 56: Naming Trace Files Automatically
Preparing Your MAX-700 for a Test Naming Trace Files Automatically Naming Trace Files Automatically Each time you start an acquisition, the application suggests a file name based on autonaming settings. This file name appears on the upper part of the graph and the linear view. The file name is made of a static part (alphanumeric) and a variable part (numeric) that will be incremented or decremented, according to your selection, as follows:... - Page 57 Preparing Your MAX-700 for a Test Naming Trace Files Automatically To configure the automatic file naming: 1. From the button bar, press OTDR Setup. 2. Select the Acquisition tab. 3. Press Default Trace Information. MAX-700...
- Page 58 Preparing Your MAX-700 for a Test Naming Trace Files Automatically 4. Fill out the required information in the corresponding boxes and select the direction for your trace files. 5. Press the button appearing next to the Fiber ID box to change the contents of the fiber identification.
- Page 59 Preparing Your MAX-700 for a Test Naming Trace Files Automatically 7. Press File Autonaming to set up the trace file name options. 8. In the File Name window, select the desired components to include in the file name. You can change the order of apparition with the up and down arrow buttons.
-
Page 60: Enabling Or Disabling The First Connector Check
Preparing Your MAX-700 for a Test Enabling or Disabling the First Connector Check Enabling or Disabling the First Connector Check Note: This function is available in all OTDR modes. However, the first connector check parameter used in Fault Finder mode is independent from the one used in the other OTDR modes (Auto and Advanced). -
Page 61: Setting Macrobend Parameters
Preparing Your MAX-700 for a Test Setting Macrobend Parameters Setting Macrobend Parameters Note: This function is available with the Auto Diagnostic (AD) optional software package only. Note: This function is available both in Advanced and Auto modes. Your unit can locate macrobends by comparing the loss values measured at a certain location, for a certain wavelength (for example, 1310 nm) with the loss values measured at the corresponding location, but for a greater wavelength (for example, 1550 nm). - Page 62 Only the combinations of wavelengths your module can support will be available. For more significant results, EXFO recommends to always select the combination of wavelengths including the smallest possible wavelength and the greatest wavelength (for example, if your module supports 1310 nm, 1550 nm, and 1625 nm, you would select the 1310 nm/1625 nm combination).
-
Page 63: Testing Fibers In Auto Mode
Testing Fibers in Auto Mode Auto mode automatically evaluates fiber length, sets acquisition parameters, acquires traces, and displays event tables and acquired traces. In Auto mode, you can set the following parameters directly: Test wavelengths (all selected by default) Fiber type (singlemode, singlemode live, or multimode) for models ... - Page 64 Testing Fibers in Auto Mode Once the acquisition is complete or interrupted, the analysis starts for acquisitions of 5 seconds or more. After analysis, the trace is displayed and events appear in the events table. Trace display Event pane The application will also display status messages if you have selected to display pass/fail messages (see Setting Pass/Fail Thresholds on page 70).
- Page 65 Testing Fibers in Auto Mode To acquire traces in Auto mode: 1. Clean the connectors properly. 2. Connect a fiber to the OTDR port. If your unit is equipped with two OTDR ports, ensure that you connect the fiber to the appropriate port (singlemode, singlemode live, or multimode), depending on the wavelength you intend to use.
- Page 66 Testing Fibers in Auto Mode 6. Select the boxes corresponding to the desired test wavelengths. You must select at least one wavelength. 7. If you want to clear the settings the OTDR has determined to start with a new set of OTDR settings, press Reset. 8.
-
Page 67: Testing Fibers In Advanced Mode
Testing Fibers in Advanced Mode Advanced mode offers all the tools you need to perform complete OTDR tests and measurements manually and gives you control over all test parameters. Note: Most parameters can only be set if you select Advanced mode first. Once you have finished selecting your settings, you can simply return to the test mode you prefer. - Page 68 Testing Fibers in Advanced Mode Although the application sets the acquisition parameters, you can modify these values as needed, even while the acquisition is in progress. The OTDR simply restarts the averaging each time a modification is made. Note: You can interrupt the acquisition at any time. The application will display the information acquired to that point.
- Page 69 Testing Fibers in Advanced Mode To acquire traces: 1. Clean the connectors properly (see Cleaning and Connecting Optical Fibers on page 42). 2. Connect a fiber to the OTDR port. If your unit is equipped with two OTDR ports, ensure that you connect the fiber to the appropriate port (singlemode, singlemode live, or multimode), depending on the wavelength you intend to use.
- Page 70 Testing Fibers in Advanced Mode 7. If your OTDR supports singlemode, singlemode live, or multimode wavelengths, under Wavelengths, from the list, select the desired fiber type (for live-fiber testing, select SM Live; for C fiber, select 50 μm and for D fiber, select 62.5 μm). 8.
- Page 71 Testing Fibers in Advanced Mode 11. Once the analysis is complete, save the trace by pressing Quick Save in the button bar. The application will use a file name based on the autonaming parameters you defined (see Naming Trace Files Automatically on page 44).
-
Page 72: Setting The Autorange Acquisition Time
Testing Fibers in Advanced Mode Setting the Autorange Acquisition Time Setting the Autorange Acquisition Time Note: This function is available both in Advanced and Auto modes. When performing automatic acquisitions in Advanced mode (see Testing Fibers in Advanced Mode on page 55) or before activating Auto mode (see Testing Fibers in Auto Mode on page 51), you can set an autorange acquisition time for the OTDR to average acquisitions over a set time period. -
Page 73: Setting The Ior, Rbs Coefficient, And Helix Factor
Testing Fibers in Advanced Mode Setting the IOR, RBS Coefficient, and Helix Factor Setting the IOR, RBS Coefficient, and Helix Factor Note: This function is available both in Advanced and Auto modes. You should set the IOR (group index), RBS coefficient and helix factor before performing tests in order to apply them to all newly acquired traces. - Page 74 Testing Fibers in Advanced Mode Setting the IOR, RBS Coefficient, and Helix Factor To set the IOR, RBS, and helix factor parameters: 1. From the button bar, press OTDR Setup. 2. From the OTDR Setup window, go to the Acquisition tab. 3.
-
Page 75: Setting Distance Range, Pulse Width, And Acquisition Time
Testing Fibers in Advanced Mode Setting Distance Range, Pulse Width, and Acquisition Time Setting Distance Range, Pulse Width, and Acquisition Time The distance range, pulse width and acquisition time are set with the controls in the Advanced main window. Distance: corresponds to the distance range of the fiber span to be ... - Page 76 Testing Fibers in Advanced Mode Setting Distance Range, Pulse Width, and Acquisition Time Time: corresponds to the acquisition duration (period during which results will be averaged). Generally, longer acquisition times generate cleaner traces (this is especially true with long-distance traces) because as the acquisition time increases, more of the noise is averaged out.
- Page 77 Testing Fibers in Advanced Mode Setting Distance Range, Pulse Width, and Acquisition Time To set the parameters: From the OTDR tab: Press the dial corresponding to the parameter you wish to set (the selection marker will move clockwise). Press directly the value to select it. The selection marker will go to that ...
-
Page 78: Enabling The High-Resolution Feature
Testing Fibers in Advanced Mode Enabling the High-Resolution Feature To use the same pulse and acquisition time for all wavelengths: 1. From the button bar, press OTDR Setup, then go to the Acquisition tab. 2. Select the Apply settings to all wavelengths box. The modifications you make to pulse, time, and range settings will now be applied to all wavelengths. - Page 79 Testing Fibers in Advanced Mode Enabling the High-Resolution Feature To enable the high-resolution feature: 1. From the button bar, press OTDR Setup. 2. Go to the Acquisition tab. 3. Select the High-resolution acquisition box. Note: If your OTDR supports singlemode, singlemode live, or multimode wavelengths, the high-resolution feature will be activated either for the singlemode, singlemode live, or multimode wavelengths, depending on the selected fiber type.
-
Page 80: Enabling Or Disabling Analysis After Acquisition
Testing Fibers in Advanced Mode Enabling or Disabling Analysis After Acquisition Enabling or Disabling Analysis After Acquisition The OTDR trace acquisition procedure will be completed by the analysis. You can either choose to automatically analyze each trace immediately after the acquisition, or perform the analysis whenever it suits you best. When the analysis process is disabled, the Event table of a newly acquired trace will be empty. - Page 81 Testing Fibers in Advanced Mode Enabling or Disabling Analysis After Acquisition To enable or disable the analysis after trace acquisition: 1. From the button bar, press OTDR Setup. 2. Go to the Analysis tab. 3. If you want the OTDR to automatically analyze an acquired trace, select the Automatically analyze data after acquisition box.
-
Page 82: Setting Pass/Fail Thresholds
Testing Fibers in Advanced Mode Setting Pass/Fail Thresholds Setting Pass/Fail Thresholds You can activate and set Pass/Fail threshold parameters for your tests. You can set thresholds for splice loss, connector loss, reflectance, fiber section attenuation, span loss, span length, and span ORL. You can apply the same pass/fail thresholds to all test wavelengths or apply them separately to each one. - Page 83 Testing Fibers in Advanced Mode Setting Pass/Fail Thresholds The following table provides the default, minimum and maximum thresholds. Test Default Minimum Maximum Splice loss (dB) 1.000 0.015 5.000 Connector loss (dB) 1.000 0.015 5.000 Fiber section attenuation (dB/km) 0.400 0.000 5.000 Once the thresholds are set, the application will be able to perform Pass/Fail tests to determine the status of the various events (pass or fail).
- Page 84 Testing Fibers in Advanced Mode Setting Pass/Fail Thresholds To set pass/fail thresholds: 1. From the button bar, select OTDR Setup, then select the Event Table tab. 2. From the Wavelength list, select the wavelength for which you want to set thresholds. Value associated Threshold to set with the...
- Page 85 Testing Fibers in Advanced Mode Setting Pass/Fail Thresholds 5. If you want to apply the thresholds you have just defined to one or several other wavelengths, proceed as follows: 5a. Press the Copy to Other Wavelengths button. 5b. Select the boxes corresponding to the wavelengths for which you want to use the same thresholds.
- Page 86 Testing Fibers in Advanced Mode Setting Pass/Fail Thresholds To revert to default threshold values and to delete custom wavelengths: 1. From the button bar, select OTDR Setup, then select the Event Table tab. 2. Press the Revert to Factory Settings button. 3.
-
Page 87: Setting A Default Span Start And Span End
Testing Fibers in Advanced Mode Setting a Default Span Start and Span End Setting a Default Span Start and Span End By default, the span start and span end of a fiber are assigned, respectively, to the first event (the launch level event) and the last event (often a non-reflective or reflective end event) of a trace. - Page 88 Testing Fibers in Advanced Mode Setting a Default Span Start and Span End To change the default span start and span end for traces: 1. From the button bar, press OTDR Setup. 2. From the OTDR Setup window, go to the Analysis tab. 3.
-
Page 89: Testing Fibers In Fault Finder Mode
Testing Fibers in Fault Finder Mode The application offers you a special testing feature to rapidly locate fiber ends. It also displays the length of the fiber under test. This could be useful if you want to perform a quick test without having to set all the acquisition parameters. - Page 90 Testing Fibers in Fault Finder Mode Acquiring Traces in Fault Finder Mode 3. From the Port list, specify to which port you connected your fiber. 4. Press Start. If the first connector check feature is enabled, a message will appear if there is a problem with the injection level (see Enabling or Disabling the First Connector Check for Fault Finder on page 87).
- Page 91 Testing Fibers in Fault Finder Mode Acquiring Traces in Fault Finder Mode 5. Once the analysis is complete, save the trace by pressing Quick Save in the button bar. The application will use a file name based on the autonaming parameters you defined (see Naming Fault Finder Files Automatically on page 80).
-
Page 92: Naming Fault Finder Files Automatically
Testing Fibers in Fault Finder Mode Naming Fault Finder Files Automatically Naming Fault Finder Files Automatically Each time you start an acquisition, the Fault Finder application suggests a file name based on autonaming settings. This file name appears on the upper part of the graph. - Page 93 Testing Fibers in Fault Finder Mode Naming Fault Finder Files Automatically To configure the automatic file naming: 1. From the button bar, press Setup. 2. From the Setup window, select the General tab then press the File Autonaming button. 3. From the Autonaming Setup dialog box, set the parameters. Static part Variable part (incremented) The value appearing in this box will be used in...
-
Page 94: Selecting The Default File Format For The Fault Finder Traces
Testing Fibers in Fault Finder Mode Selecting the Default File Format for the Fault Finder Traces Selecting the Default File Format for the Fault Finder Traces You can define the default file format the Fault Finder application will use when you save your traces. Note: The default file format used in Fault Finder mode are independent from the file format used in Auto or Advanced modes. - Page 95 Testing Fibers in Fault Finder Mode Selecting the Default File Format for the Fault Finder Traces To select the default file format: 1. From the button bar, press Quick Save. 2. From the Save File dialog box, select the desired format. 3.
-
Page 96: Enabling Or Disabling The Confirmation Of Fault Finder File Name
Testing Fibers in Fault Finder Mode Enabling or Disabling the Confirmation of Fault Finder File Name Enabling or Disabling the Confirmation of Fault Finder File Name By default, each time you save a file, the application prompts you to confirm the file name. Note: The file name confirmation parameter used in Fault Finder mode is independent from the one used in the other OTDR modes (Auto and Advanced). - Page 97 Testing Fibers in Fault Finder Mode Enabling or Disabling the Confirmation of Fault Finder File Name To enable or disable file name confirmation: 1. From the button bar, press Setup, then go to the General tab. 2. If you want to confirm file name each time you press Quick Save, select the Always show confirmation window on save check box.
-
Page 98: Enabling Or Disabling The Storage Feature
Testing Fibers in Fault Finder Mode Enabling or Disabling the Storage Feature Enabling or Disabling the Storage Feature By default, the Quick Save button is displayed in the button bar. However, if you only want to perform quick tests without having to save the results, you may prefer to hide the Quick Save button. -
Page 99: Enabling Or Disabling The First Connector Check For Fault Finder
Testing Fibers in Fault Finder Mode Enabling or Disabling the First Connector Check for Fault Finder Enabling or Disabling the First Connector Check for Fault Finder The first connector check feature is used to verify that the fibers are properly connected to the OTDR. It verifies the injection level and displays a message when a unusually high loss occurs at the first connection, which could indicate that no fiber is connected to the OTDR port. - Page 100 Testing Fibers in Fault Finder Mode Enabling or Disabling the First Connector Check for Fault Finder To enable or disable the first connector check: 1. From the button bar, press Setup then select the General tab. 2. To enable the first connector check, select the First connector check check box.
-
Page 101: Enabling Or Disabling The Touchscreen Keyboard
Testing Fibers in Fault Finder Mode Enabling or Disabling the Touchscreen Keyboard Enabling or Disabling the Touchscreen Keyboard With the touchscreen keyboard, you can enter data without having to use an external keyboard. By default, this feature is enabled. When you select a text or number box, the touchscreen keyboard or keypad appears automatically. -
Page 102: Setting Trace Display Parameters
Testing Fibers in Fault Finder Mode Setting Trace Display Parameters Setting Trace Display Parameters You can change several trace display parameters: the grid: You can display or hide the grid appearing on the graph’s background. By default, the grid is displayed. the file name in the trace display: The file name appears at the top of ... - Page 103 Testing Fibers in Fault Finder Mode Setting Trace Display Parameters To set the trace display parameters: 1. From the button bar, press the Setup button, then select the General tab. 2. Select the check boxes corresponding to the item you want to display on the graph.
-
Page 104: Selecting The Distance Units
Testing Fibers in Fault Finder Mode Selecting the Distance Units Selecting the Distance Units You can select the distance units that will be used in the application. The default distance units are the kilometers. Units used Note: The distance units used in Fault Finder mode are independent from the ones used in the other OTDR modes (Auto and Advanced). - Page 105 Testing Fibers in Fault Finder Mode Selecting the Distance Units To select the distance units for your display: 1. From the button bar, select Setup. 2. From the Setup window, select the General tab. 3. From the Distance units list, select the item corresponding to the desired units.
-
Page 107: Customizing The Otdr Application
Customizing the OTDR Application You can customize the appearance and behavior of your OTDR application. Selecting the Default File Format You can define the default file format the application will use when you save your traces. By default, traces are saved in native (.trc) format, but you can configure your unit to save them in Bellcore (.sor) format. - Page 108 Customizing the OTDR Application Selecting the Default File Format To select the default file format: 1. From the Main Menu window, press Quick Save. 2. From the Save File dialog box, select the desired format. 3. Press OK to save your file in the new format. The next files will be saved in the new format.
-
Page 109: Enabling Or Disabling File Name Confirmation
Customizing the OTDR Application Enabling or Disabling File Name Confirmation Enabling or Disabling File Name Confirmation By default, each time you save a file, the application prompts you to confirm the file name. The application will use a file name based on autonaming settings (see Naming Trace Files Automatically on page 44). - Page 110 Customizing the OTDR Application Enabling or Disabling File Name Confirmation To enable or disable file name confirmation: 1. From the Main Menu window, press OTDR Setup, then select the General tab. 2. If you want to confirm file name each time you press Quick Save, select the Always show confirmation window on save check box.
-
Page 111: Selecting The Distance Units
Customizing the OTDR Application Selecting the Distance Units Selecting the Distance Units You can select the measurement units that will be used throughout the application, except for certain values such as the pulse and the wavelength. Pulse values are expressed in seconds and wavelength in meters (nanometers). - Page 112 Customizing the OTDR Application Selecting the Distance Units To select the distance units for your display: 1. From the button bar, press OTDR Setup. 2. From the OTDR Setup window, select the General tab. 3. From the Distance units list, select the item corresponding to the desired distance units.
-
Page 113: Customizing The Acquisition Distance Range Values
Customizing the OTDR Application Customizing the Acquisition Distance Range Values Customizing the Acquisition Distance Range Values Note: This function is available in Advanced mode only. You can customize the values associated with the Distance dial. Once the customization is complete, you are ready to set the distance range value for your test. - Page 114 Customizing the OTDR Application Customizing the Acquisition Distance Range Values To customize the distance range values: 1. From the button bar, select OTDR Setup, then the Acquisition tab. 2. Press the Custom Acquisition Parameters button. 3. If your OTDR supports singlemode or filtered wavelengths, specify the desired fiber type.
-
Page 115: Customizing The Acquisition Time Values
Customizing the OTDR Application Customizing the Acquisition Time Values Customizing the Acquisition Time Values Note: This function is available in Advanced mode only. You can customize the values associated with the Time dial. The acquisition time values represent the time during which the OTDR will average acquisitions. - Page 116 Customizing the OTDR Application Customizing the Acquisition Time Values To customize the acquisition time values: 1. From the button bar, select OTDR Setup, then the Acquisition tab. 2. Press the Custom Acquisition Parameters button. 3. From the Time list, select the value you want to modify (the value will become highlighted), then press the Edit button.
-
Page 117: Enabling Or Disabling The Touchscreen Keyboard
Customizing the OTDR Application Enabling or Disabling the Touchscreen Keyboard Enabling or Disabling the Touchscreen Keyboard With the touchscreen keyboard, you can enter data without having to use an external keyboard. By default, this feature is enabled. When you select a text or number box, the touchscreen keyboard or keypad appears automatically. -
Page 118: Displaying Or Hiding The Optional Features
Customizing the OTDR Application Displaying or Hiding the Optional Features Displaying or Hiding the Optional Features If you have not purchased the optional software package, since you cannot use the optional features, you may prefer to hide them (macrobend detection, linear view). Note: You cannot hide the optional features if you purchased the software package. -
Page 119: Analyzing Traces And Events
Analyzing Traces and Events Once the acquired trace is analyzed, it appears in the trace display and the events are displayed in the events table at the bottom of the screen.The trace display and events table are explained in the following sections. You can also reanalyze existing traces. -
Page 120: Graph View
Analyzing Traces and Events Graph View Graph View The events, that are detailed in the events table (see Events Tab on page 114), are marked by numbers along the displayed trace. Default injection level Event no. 4 Distance units Events table Some items in the trace display are always visible, while others will appear only if you choose to display them. - Page 121 Analyzing Traces and Events Graph View You can change trace display parameters (such as the grid and zoom window display). For more information, see Setting Trace Display Parameters on page 128. You can view all of the traces, in turn, in both the Trace Info pane and the trace display with the navigation buttons.
-
Page 122: Linear View
Analyzing Traces and Events Linear View Linear View Note: This function is available with the optional Auto Diagnostic (AD) software package only. In the linear view, the events are displayed sequentially, from left to right. Event Fiber section Each bubble represents an event. Each horizontal line that “links” two ... - Page 123 Analyzing Traces and Events Linear View You can view, in turn, the reference trace and the main trace using the Next Trace button. If you press a bubble or an horizontal line and hold for a few seconds, the application will display a tooltip identifying the item (for example, Reflective fault).
-
Page 124: Summary Table
Analyzing Traces and Events Summary Table Summary Table Note: This function is available both in Advanced and Auto modes. The summary table gives, for each wavelength, the global status of the results (pass: no results exceed the thresholds or fail: at least one result exceeds the thresholds), the span loss and span ORL values. - Page 125 Analyzing Traces and Events Summary Table Since the summary table shows the information for all the wavelengths of the main trace only, the Next Trace button is not available. The summary table cannot be displayed when the events table is ...
-
Page 126: Events Tab
Analyzing Traces and Events Events Tab To display the summary table: From the main window, press the button. Note: To display the summary table as the default view after the acquisitions are all performed (at all the selected wavelengths) and the analysis of the last wavelength is complete, see Selecting the Default View on page 121. - Page 127 Analyzing Traces and Events Events Tab The events table lists all the events detected on the fiber. An event can be defined as the point at which change in the transmission properties of light can be measured. Events can consist of losses due to transmission, splices, connectors or breaks.
- Page 128 Analyzing Traces and Events Events Tab For each item listed in the events table, information is displayed: Type: Various symbols are used to describe different event types. For a more detailed description of symbols, see Description of Event Types on page 341.
- Page 129 Analyzing Traces and Events Events Tab To quickly locate an event in the events table: 1. Ensure that the button is selected in the zoom button bar. 2. Select the event on the trace. The list scrolls automatically to the event you selected. Event no.
-
Page 130: Measure Tab
Analyzing Traces and Events Measure Tab Measure Tab The application shows two, three or four markers: a, A, B, and b, depending on the button you pressed under Results. These markers can be repositioned along the trace to calculate loss, attenuation, reflectance, and optical return loss (ORL). -
Page 131: Displaying The Graph In Full Screen
Analyzing Traces and Events Displaying the Graph in Full Screen Displaying the Graph in Full Screen You can display the graph in full screen at any time, even when an acquisition is underway. The graph will keep the same display options as in normal view (grid, file name, zoom window, inverted colors). - Page 132 Analyzing Traces and Events Displaying the Graph in Full Screen If you want to view a table of events once the acquisitions are complete, you must select the Events tab or activate the option to display the event table (from OTDR Setup) before switching to full-screen mode. Once all acquisitions are complete, the application will automatically switch to the defined default view (see Selecting the Default View on page 121).
-
Page 133: Selecting The Default View
Analyzing Traces and Events Selecting the Default View Selecting the Default View You can select which view will be displayed by default once all the acquisitions are performed (at all the selected wavelengths) and the analysis of the last wavelength is complete. The table below indicates in which OTDR modes (Auto and Advanced) a particular view can be displayed. - Page 134 Analyzing Traces and Events Selecting the Default View OTDR modes View for which view Remarks is available Summary table Auto This table gives, for each wavelength, the pass/fail status of Advanced the results, the span loss and span ORL values.
-
Page 135: Automatically Displaying The Event Table After Acquisitions
Analyzing Traces and Events Automatically Displaying the Event Table after Acquisitions Automatically Displaying the Event Table after Acquisitions You may want the application to automatically switch to the event table once all acquisitions are complete. This could be particularly useful when you work in full-screen mode (see Displaying the Graph in Full Screen on page 119) if you want to view the event table without having to go back in normal view mode. -
Page 136: Automatically Zooming In On The Fiber Span
Analyzing Traces and Events Automatically Zooming in on the Fiber Span Automatically Zooming in on the Fiber Span Note: This function is available in Advanced mode only. You can set the trace display to show only the span start to the span end of the trace in full-trace view. -
Page 137: Using Zoom Controls
Analyzing Traces and Events Using Zoom Controls Using Zoom Controls Use the zoom controls to change the scale of the trace display. You can zoom in on or out of the graph using the corresponding buttons or let the application automatically adjust the zoom on the currently selected event from the events table (only available when the events window is displayed). - Page 138 Analyzing Traces and Events Using Zoom Controls When you manually zoom in or out on a trace, the application will apply the new zoom factor and marker positions to the other traces (wavelengths) of a same file and on the reference file, if applicable. Both the zoom factor and marker positions will be saved along with the trace (same settings for all wavelengths).
- Page 139 Analyzing Traces and Events Using Zoom Controls You can zoom in or out on the graph by first using, respectively, or the button, and then by pressing the location where you want to zoom on the graph with the stylus or your finger. The application automatically adjusts the zoom by a factor 2 around the point that was pressed.
-
Page 140: Setting Trace Display Parameters
Analyzing Traces and Events Setting Trace Display Parameters Setting Trace Display Parameters Once you have started the desired trace acquisition mode (Automatic or Advanced), you can change several trace display parameters: the grid: You can display or hide the grid appearing on the graph’s ... - Page 141 Analyzing Traces and Events Setting Trace Display Parameters To set the trace display parameters: 1. From the button bar, press the OTDR Setup button, then select the General tab. 2. Select the boxes corresponding to the item you want to display on the graph.
-
Page 142: Customizing The Event Table
Analyzing Traces and Events Customizing the Event Table Customizing the Event Table Note: This function is available both in Advanced and Auto modes. You can include or exclude items from the events table to better suit your needs. Note: Hiding the fiber sections will not delete these items. Fiber sections: You can display or hide fiber sections in the events table ... - Page 143 Analyzing Traces and Events Customizing the Event Table To customize the events table appearance: 1. From the OTDR Setup window, select the Event Table tab. 2. Select the boxes corresponding to the item you want to display or include in the table. To hide them, clear the boxes.
-
Page 144: Displaying Or Hiding A Trace
Analyzing Traces and Events Displaying or Hiding a Trace Displaying or Hiding a Trace There are two ways of displaying or hiding traces in the OTDR test application. You can view, in turn, all the trace files you have opened, including ... - Page 145 Analyzing Traces and Events Displaying or Hiding a Trace To specify which traces to display or hide: 1. From the button bar, press Storage. 2. Select the boxes corresponding to the traces to display. Clear the boxes to hide them. Note: A hidden trace cannot be displayed with the navigation button.
-
Page 146: Clearing Traces From The Display
Analyzing Traces and Events Clearing Traces from the Display Clearing Traces from the Display Note: This function is available in Advanced mode only. Note: Clearing traces from the display does not delete them from the disk. If a trace you acquired (main or reference) does not meet your requirements, you can clear that trace and start over. -
Page 147: Viewing And Modifying Current Trace Settings
Analyzing Traces and Events Viewing and Modifying Current Trace Settings Viewing and Modifying Current Trace Settings You can view the trace parameters and modify them at your convenience. Note: Parameter modification is only possible in Advanced mode. You can modify the index of refraction (IOR) also known as group index, Rayleigh backscatter (RBS) coefficient and helix factor for the displayed trace. - Page 148 Analyzing Traces and Events Viewing and Modifying Current Trace Settings To view trace settings: Go to the Trace Info. tab. Note: Even if more than one trace is available, the Trace Info. tab only shows one at a time. To display the traces in turn, press Next Trace in the toolbar. The active trace appears in black in the trace display.
- Page 149 Analyzing Traces and Events Viewing and Modifying Current Trace Settings Span ORL: ORL calculated either between the span start and the span end, or on the total fiber span, depending on the option you have selected in the Setup window. High resolution: High-resolution feature was selected to perform the ...
- Page 150 Analyzing Traces and Events Viewing and Modifying Current Trace Settings To modify the IOR, RBS coefficient, and helix factor parameters: 1. From the main window, go to the Trace Info. tab. 2. Press the Fiber Settings button. 3. Enter the desired values for the current trace in the appropriate boxes. If you want to revert a particular item to its default value, press the Default button appearing next to this item.
- Page 151 Analyzing Traces and Events Viewing and Modifying Current Trace Settings If you already know the IOR value, you can enter it in the corresponding box. However, if you prefer to let the application calculate the IOR value as a function of the distance between span start and span end, press Set IOR by Distance, then enter the distance value.
-
Page 152: Modifying Events
Analyzing Traces and Events Modifying Events Modifying Events Note: This function is available in Advanced mode only. You can change the loss and reflectance of almost any existing event except: continuous fiber end of analysis launch level merged events ... - Page 153 Analyzing Traces and Events Modifying Events To modify an event: 1. Select the event you want to modify. 2. Press the Change Event button. Markers a, A, B, and b appear on the graph. With these markers, you can define a new location for the selected event. You can reposition all markers directly by dragging them, or by pressing where you want to relocate them on the graph.
- Page 154 Analyzing Traces and Events Modifying Events 3. Position marker A on the event, and submarker a (to the left of marker A) as far as possible from marker A , without including the preceding event. The area between markers A and a must not include any significant variation.
- Page 155 Analyzing Traces and Events Modifying Events 5. If you selected a reflective event, you can modify the echo status using the up/down arrows of the Echo status list. Note: Select “- - -” if you want to indicate that the event is not an echo. 6.
-
Page 156: Inserting Events
Analyzing Traces and Events Inserting Events Inserting Events You can insert events in the event table manually. This could be useful, for example, if you know that there is a splice at a given location, but the analysis does not detect it because it is hidden in the noise or because the splice loss is lower than the minimum detection threshold (see Setting Pass/Fail Thresholds on page 70). - Page 157 Analyzing Traces and Events Inserting Events Four markers are available to measure the inserted event, but only marker A identifies where the event will be inserted. Use the marker arrows to move marker A on the trace display. 3. Once you have determined the location, under Event, use the up/down arrows next to the box to select the desired event type.
-
Page 158: Deleting Events
Analyzing Traces and Events Deleting Events Deleting Events Note: This function is available in Advanced mode only. Almost any event can be deleted from the events table, except: end of analysis fiber section launch level end of fiber ... - Page 159 Analyzing Traces and Events Deleting Events To delete an event: 1. Select the event you want to delete. 2. Press Delete. 3. When the application prompts you, press Yes to confirm the deletion, or No to keep the event. MAX-700...
-
Page 160: Managing Comments
Analyzing Traces and Events Managing Comments Managing Comments Note: This function is available in Advanced mode only. You can insert comments manually on a specific event and you can also delete them. A red triangle on the event indicates that a comment has been added. - Page 161 Analyzing Traces and Events Managing Comments To delete a comment: 1. Select the event on which you want to delete a comment. 2. From the Events tab, press Edit Comments. 3. From the Edit Comments dialog box, delete the text. 4.
-
Page 162: Changing The Attenuation Of Fiber Sections
Analyzing Traces and Events Changing the Attenuation of Fiber Sections Changing the Attenuation of Fiber Sections Note: This function is available in Advanced mode only. You can change the attenuation value of fiber sections. MPORTANT If you reanalyze a trace, all of the modifications made to the fiber sections will be lost and the events table will be re-created. - Page 163 Analyzing Traces and Events Changing the Attenuation of Fiber Sections 3. Position markers as desired to modify the attenuation value. For more information on positioning markers, see Using Markers on page 169. Note: The markers serve only to set the new attenuation value. Their actual locations will not be modified.
-
Page 164: Setting The Analysis Detection Thresholds
Analyzing Traces and Events Setting the Analysis Detection Thresholds Setting the Analysis Detection Thresholds Note: This function is available in Advanced mode only. To optimize event detection, you can set the following analysis detection thresholds: Splice loss threshold: To display or hide small non-reflective events. ... - Page 165 Analyzing Traces and Events Setting the Analysis Detection Thresholds The following examples show how different splice-loss threshold levels can affect the number of displayed events, especially small non-reflective events such as those caused by two splices. Three traces are shown, corresponding to three threshold level settings.
- Page 166 Analyzing Traces and Events Setting the Analysis Detection Thresholds To set the analysis detection thresholds: 1. From the button bar, press OTDR Setup. 2. From the OTDR Setup dialog box, select the Analysis tab. 3. Under Analysis parameters, set the parameters. Enter the desired values in the appropriate boxes.
-
Page 167: Analyzing Or Reanalyzing A Trace
Analyzing Traces and Events Analyzing or Reanalyzing a Trace Analyzing or Reanalyzing a Trace Note: This function is available in Advanced mode only. You can analyze a displayed trace at any time. Analyzing or reanalyzing a trace will: produce an events table for a trace, if there was none (for example, the ... - Page 168 Analyzing Traces and Events Analyzing or Reanalyzing a Trace To analyze or reanalyze a trace: 1. From the main window, go to the Events tab. 2. Press the Analyze button. 3. From the Reanalyze Trace dialog box, select an item for setting the span start and end markers on the trace.
-
Page 169: Analyzing The Fiber On A Specific Fiber Span
Analyzing Traces and Events Analyzing the Fiber on a Specific Fiber Span Analyzing the Fiber on a Specific Fiber Span Note: This function is available in Advanced mode only. If you want to focus your fiber analysis on a specific fiber span, you can define events (new or existing) as a span start and/or span end. -
Page 170: Enabling Or Disabling The Detection Of Reflective Ends Of Fiber
Analyzing Traces and Events Enabling or Disabling the Detection of Reflective Ends of Fiber Enabling or Disabling the Detection of Reflective Ends of Fiber By default, the application stops the analysis as soon as there is too much noise on a trace to ensure accurate measurements. However, you can configure the application to search the “noisy”... - Page 171 Analyzing Traces and Events Enabling or Disabling the Detection of Reflective Ends of Fiber The table below shows the differences you will notice in the event table depending on if you enable the detection of reflective ends of fiber or not. Option not selected Option selected (conventional analysis)
- Page 172 Analyzing Traces and Events Enabling or Disabling the Detection of Reflective Ends of Fiber MPORTANT The analysis will stop as soon as the loss of an event crosses the end-of-fiber (EoF) threshold. The application will mark the event as an end-of-fiber event. In this case, even if you selected the option, the application will not search the “noisy”...
-
Page 173: Swapping Traces
Analyzing Traces and Events Swapping Traces Swapping Traces Note: This function is available in Advanced mode only. Since the events table and the trace information are based on the main trace, you may want to interchange main and reference traces. When you swap traces, the application will provide a new set of events corresponding to the new main trace. -
Page 174: Opening Trace Files
Analyzing Traces and Events Opening Trace Files Opening Trace Files In Advanced mode, you can open a trace file as the main trace or the reference trace. You can open both the main and reference trace files at the same time. You can open two multiple wavelength trace files simultaneously, each containing several traces. - Page 175 Analyzing Traces and Events Opening Trace Files The table below presents the possible behavior of the zoom and markers when you open traces (main or reference). If you open old OTDR traces, see the corresponding row for more information. File Type Zoom Marker Trace that has been saved with an...
- Page 176 As soon as a reference trace is open, the application will apply the zoom and marker settings of the reference file to all traces (main and reference). For detailed information on compatibility between EXFO’s file formats and software versions, see OTDR Trace File Compatibility on page 182.
- Page 177 Analyzing Traces and Events Opening Trace Files To open a trace file: 1. From the button bar, press Storage, then Open File. Available in Advanced mode 2. If necessary, change the location to retrieve the file that was stored. 3. Scroll through the list of files and select a trace file to open. 4.
-
Page 179: Analyzing The Results Manually
10 Analyzing the Results Manually Once a trace has been acquired or opened, you can use markers and zoom in on or out of any event or trace segment to measure splice loss, fiber section attenuation, reflectance, and optical return loss. Selecting the Attenuation and Loss Values that Will Be Displayed By default, in the Measure tab, the application only displays the values... - Page 180 Analyzing the Results Manually Selecting the Attenuation and Loss Values that Will Be Displayed To select the attenuation and loss values that will be displayed: 1. From the button bar, press OTDR Setup then go to the General tab. 2. Press the Measurement Method button. 3.
-
Page 181: Using Markers
Analyzing the Results Manually Using Markers Using Markers You can use markers to view the position and relative power of an event. Markers are available from the Events tab (when you modify or add an event) or the Measure tab in the main window. To move a marker: 1. -
Page 182: Getting Event Distances And Relative Powers
Analyzing the Results Manually Getting Event Distances and Relative Powers Getting Event Distances and Relative Powers The OTDR test application automatically calculates the position of an event and displays this distance in the events table. You can retrieve the position of an event as well as the distance between events manually. -
Page 183: Getting Event Loss (Four-Point And Least-Square Approximation)
Analyzing the Results Manually Getting Event Loss (Four-Point and Least-Square Approximation) Getting Event Loss (Four-Point and Least-Square Approximation) Event loss (expressed in dB) is calculated by measuring the signal level reduction in Rayleigh backscatter (RBS) caused by this event. Event loss can result from both reflective and non-reflective events. - Page 184 Analyzing the Results Manually Getting Event Loss (Four-Point and Least-Square Approximation) Four-point event loss: the LSA method is used to fit a straight line to the backscatter data within the two regions defined by markers a, A and b, B, that is over the regions to the left and to the right of the event bordered by markers A and B, respectively.
- Page 185 Analyzing the Results Manually Getting Event Loss (Four-Point and Least-Square Approximation) A-B LSA loss: the loss of the event bordered by the markers A and B is obtained by fitting a straight line to the backscatter data between these two markers.
- Page 186 Analyzing the Results Manually Getting Event Loss (Four-Point and Least-Square Approximation) To get event loss: 1. From the main window, select the Measure tab. 2. In the Results section, press Loss. Markers a, A, B and b appear on the graph.
- Page 187 Analyzing the Results Manually Getting Event Loss (Four-Point and Least-Square Approximation) 5. Position marker B at the beginning of the linear area following the event to be measured. 6. Position submarker b at the end of the linear area following the event to be measured (must not include any significant events).
-
Page 188: Getting Attenuation (Two-Point And Least-Square Approximation)
Analyzing the Results Manually Getting Attenuation (Two-Point and Least-Square Approximation) Getting Attenuation (Two-Point and Least-Square Approximation) A two-point attenuation measurement gives the reduction in Rayleigh backscatter level as a function of distance (always expressed in dB/km to follow the standards of the fiber-optic industry) between two selected points. - Page 189 Analyzing the Results Manually Getting Attenuation (Two-Point and Least-Square Approximation) To get attenuation: From the main window, select the Measure tab. 2. In the Results section, press the Att. button. Markers A and B appear on the graph. 3. Place markers A and B at any two points on the trace. For more information, see Using Markers on page 169.
-
Page 190: Getting Reflectance
Analyzing the Results Manually Getting Reflectance Getting Reflectance Reflectance is the ratio of reflected light to input light. Note: If you are testing in Real time, the reflectance value you will get is not necessarily accurate. To get reflectance: 1. From the main window, select the Measure tab. 2. -
Page 191: Getting Optical Return Loss (Orl)
Analyzing the Results Manually Getting Optical Return Loss (ORL) Getting Optical Return Loss (ORL) Note: You must use a singlemode OTDR for ORL calculations. The ORL calculation will provide the following information: the ORL between markers A and B the total ORL is calculated either between the span start and the span ... -
Page 193: Managing Trace Files From The Otdr Test Application
(.trc) format. For information on how to define the default file format, see Selecting the Default File Format on page 95). To save an OTDR trace file in another format: Use a computer onto which EXFO FastReporter is already installed. MAX-700... -
Page 194: Otdr Trace File Compatibility
Managing Trace Files from the OTDR Test Application OTDR Trace File Compatibility OTDR Trace File Compatibility The table presented hereafter shows the compatibility between the format of a specific trace and the software that you may use to open that trace. Symbols used in the table Meaning Fully compatible... - Page 195 Managing Trace Files from the OTDR Test Application OTDR Trace File Compatibility Software used to open the file... ToolBox ToolBox ToolBox ToolBox FTB-100 FTB-100 FTB-100 6.5 or 6.7 to 6.21 or 2.5 or 2.6 or 2.7 2.8 or later/ earlier 6.20 later earlier...
-
Page 196: Copying, Moving, Renaming, Or Deleting Trace Files
Managing Trace Files from the OTDR Test Application Copying, Moving, Renaming, or Deleting Trace Files Copying, Moving, Renaming, or Deleting Trace Files If you want to copy, move, rename or delete trace files, you will have to process the files manually via File Manager available from MAX-700 software. -
Page 197: Creating And Generating Reports
12 Creating and Generating Reports For future reference, you can add notes on the location of the tested fiber, type of job performed and general comments related to a trace in trace reports. Adding Information to the Test Results After acquiring a trace, you might want to include or update information about the tested fiber and job or add comments. - Page 198 Creating and Generating Reports Adding Information to the Test Results To add information to the test results: 1. From the button bar, once a trace has been acquired or reopened, press Identification. 2. Enter the desired information. Note: The information in the Date, Time, Unit and Serial no. boxes is provided by the application and cannot be edited.
-
Page 199: Generating A Report
Creating and Generating Reports Generating a Report Generating a Report You can generate trace reports directly from your unit in HTML format. By default, only the information related to the active trace is generated in a report, but you can also generate all the traces the current file contains (available in Advanced and Auto modes only). - Page 200 Creating and Generating Reports Generating a Report Auto Advanced Item appearing on the report mode mode Macrobend table: a single table containing the location and the delta loss of all the detected macrobends. This table is followed by another table which contains the macrobend thresholds.
- Page 201 Creating and Generating Reports Generating a Report Auto Advanced Item appearing on the report mode mode Test and Cable Setup for main and reference traces: file name, OTDR model, software version, wavelength, distance, IOR, RBS, acquisition time, pulse width, file type, serial number, splice loss detection, reflectance detection, end-of-fiber detection, and helix factor.
- Page 202 Creating and Generating Reports Generating a Report Auto Advanced Item appearing on the report mode mode Graph: You can select the Zoom item if you want the traces to be generated with the zoom factor you selected: Manual zoom: Graphs will be generated exactly as ...
- Page 203 Creating and Generating Reports Generating a Report To generate reports: 1. From the button bar, press Generate Report. 2. From the Report dialog box, select the report characteristics, including whether you want to include the graphs or not. Select the Include all traces item to generate a report for all traces (wavelengths) from the current file (available in Auto and Advanced modes only).
- Page 204 Creating and Generating Reports Generating a Report 5. From the Save As dialog box, select a folder or create one to save your file. 6. If desired, modify the file name. MPORTANT If you specify the name of an existing trace, the original file will be overwritten and only the new file will be available.
-
Page 205: Using The Otdr As A Light Source
13 Using the OTDR as a Light Source If you want to perform measurements with a power meter and your OTDR as a source, the OTDR port can transmit a special tone. This port can be used only to transmit—not detect that tone. AUTION Never connect a live fiber to the OTDR port without a proper setup. - Page 206 Using the OTDR as a Light Source To use your MAX-700 as a source: 1. Clean the connectors properly (see Cleaning and Connecting Optical Fibers on page 42). 2. Connect one end of the fiber under test to the OTDR port. If your unit is equipped with two OTDR ports, ensure that you connect the fiber to the appropriate port (singlemode, singlemode live, or multimode), depending on the wavelength you intend to use.
- Page 207 6. Under Source, press Turn ON. You can stop light emission at any time by pressing Turn OFF. Using an EXFO power meter with tone-detection features, such as the FOT-930 or FPM-300, an operator at the other end will be able to quickly locate the correct fiber or perform loss measurements.
-
Page 209: 14 Setting Up Your Unit
14 Setting Up Your Unit Adjusting Brightness To fit your work environment, you may adjust the LCD brightness. Values are kept in memory even when you turn the unit off. Note: These settings do not apply to a fiber inspection probe display. To adjust the display brightness: Press the key repeatedly to switch between brightness levels. -
Page 210: Adjusting Microphone And Headphones Volume
Setting Up Your Unit Adjusting Microphone and Headphones Volume Adjusting Microphone and Headphones Volume To fit your work environment, you may adjust the volume of your headset’s microphone and headphones. Values are kept in memory even when you turn the unit off. To adjust the microphone volume: 1. - Page 211 Setting Up Your Unit Adjusting Microphone and Headphones Volume 5. Under Voice recording, tap Volume. 6. Ensure that the microphone boost option is selected: 6a. From the Options menu, select Advanced Controls. 6b. Tap the Advanced button. MAX-700...
- Page 212 Setting Up Your Unit Adjusting Microphone and Headphones Volume 6c. Under Other Controls, select the 1 Microphone Boost check box. 6d. Tap Close. Note: Normally, you only have to select this option the first time that you adjust the microphone volume. Once it is done, you can control the volume with the slider as explained at the next step.
- Page 213 Setting Up Your Unit Adjusting Microphone and Headphones Volume To adjust the headphones volume: 1. From the Main Menu, tap System Settings. 2. If necessary, from System Settings, tap Display & Sound. 3. Under Volume, use the slider to adjust the sound of your speaker. Note: You can also select the Mute check box if you want to quickly turn off the sound.
-
Page 214: Recalibrating The Touchscreen
Setting Up Your Unit Recalibrating the Touchscreen Recalibrating the Touchscreen If you notice the touchscreen does not behave in the way it used to (for example, it is now difficult to select items) it probably needs a recalibration. The default calibration method is performed using nine points, but you can also perform a 4-point, or even a 25-point calibration (linearization) if you need more accuracy. - Page 215 Setting Up Your Unit Recalibrating the Touchscreen 3. From the Calibration points list, select the desired number of points for the calibration. 4. Tap Calibrate. MAX-700...
- Page 216 Setting Up Your Unit Recalibrating the Touchscreen 5. Using the stylus (or any blunt pointing device), simply press the center of the different targets that appear on the screen. Keep pressing until the application displays OK to indicate that the new parameters have been taken into account.
-
Page 217: Enabling Or Disabling The Touchscreen Right-Click Feature
Setting Up Your Unit Enabling or Disabling the Touchscreen Right-Click Feature Enabling or Disabling the Touchscreen Right-Click Feature By default, you can right-click with your touchscreen (see Right-Clicking with the Touchscreen on page 23). However, you can disable this feature if you prefer. - Page 218 Setting Up Your Unit Enabling or Disabling the Touchscreen Right-Click Feature 4. Select the Setting tab. 5. Tap the Option button. MAX-700...
- Page 219 Setting Up Your Unit Enabling or Disabling the Touchscreen Right-Click Feature 6. From the Option tab, select the Enable Auto Right Click check box to enable the option. Clear the check box if you prefer to disable the right-click. 7. Tap OK to confirm the changes. 8.
-
Page 220: Customizing The On-Screen Keyboard
Setting Up Your Unit Customizing the On-Screen Keyboard Customizing the On-Screen Keyboard You can customize the appearance and behavior of the on-screen keyboard. For more information on the various parameters that you can set, refer to the on-screen keyboard online help. For information on how switch from one of the available languages to another, see Selecting the Language of Operation on page 215. - Page 221 Setting Up Your Unit Customizing the On-Screen Keyboard 4. Configure the keyboard according to your needs. Note: You can access the online help related to the keyboard options by tapping the Help button. 5. When you have finished, tap Close. 6.
-
Page 222: Selecting The Startup Application
Setting Up Your Unit Selecting the Startup Application Selecting the Startup Application The first time you start your unit, the MAX-700 software is displayed. However, you can configure your unit to automatically start in any of the available applications. The selected application or applications will start automatically the next time you turn on your unit after a shutdown (not in standby mode). - Page 223 Setting Up Your Unit Selecting the Startup Application 3. Under Module application or Utility applications, select the application you want to start automatically when you turn on your unit. To browse through the list Note: You can select several utility applications, but only one module application at a time.
-
Page 224: Configuring Network Printers
Setting Up Your Unit Configuring Network Printers Configuring Network Printers To print documents and images on a network printer, you must configure the printer first. You must know the IP address of the network printer that you want to configure (see with your network administrator). MPORTANT Your unit does not support USB printers. - Page 225 Setting Up Your Unit Configuring Network Printers 3. Select the HP Universal Printing PCL 6 item. 4. From the menu, select File > Printing Preferences. 5. Under Find a Printer, select Enter a Printer Address. 6. Enter the IP address of the printer that you want to configure, and then tap OK.
- Page 226 Setting Up Your Unit Configuring Network Printers 7. Select the Add this printer to my Printers and Faxes folder check box. 8. Tap OK to confirm. The operation can take several minutes to complete. 9. When the application prompts you, click OK to acknowledge the message.
-
Page 227: Selecting The Language Of Operation
Setting Up Your Unit Selecting the Language of Operation Selecting the Language of Operation You may display the user interface in one of the available languages (default is English). When you change the interface language, the corresponding keyboard is not automatically added to the list of available keyboards. You must add the desired keyboard separately if you want to enter text in a specific language (both on-screen or “real”... - Page 228 Setting Up Your Unit Selecting the Language of Operation To select a new interface language: 1. From the Main Menu, tap Setup 2. Double-tap Regional and Language Options. 3. Select the Languages tab. 4. From the Language used in menus and dialogs list, select the desired language.
- Page 229 Setting Up Your Unit Selecting the Language of Operation To add new input languages: 1. From the Main Menu, tap Setup. 2. Double-tap Regional and Language Options. 3. Select the Languages tab. MAX-700...
- Page 230 Setting Up Your Unit Selecting the Language of Operation 4. Under Text services and input languages, tap Details. 5. Under Installed services, tap Add. 6. From the Input language list, select the desired language. MAX-700...
- Page 231 Setting Up Your Unit Selecting the Language of Operation 7. If necessary, from the Keyboard layout/IME list, select the desired option. 8. Tap OK to confirm. 9. Repeat steps 5 to 8 for all the languages that you want to add. 10.
- Page 232 Setting Up Your Unit Selecting the Language of Operation To modify the language of the VLC media player: 1. Close the MAX-700 software window. 2. On the Windows taskbar, tap Start, then select All Programs > VideoLAN > VLC media player. 3.
-
Page 233: Setting Date And Time Formats
Setting Up Your Unit Setting Date and Time Formats Setting Date and Time Formats The current date and time are displayed at the bottom of the Main Menu. You can modify the format in which the date and time are displayed. For information on how to adjust the date, the time, and the time zone, see Adjusting the Date, Time and Time Zone on page 224. - Page 234 Setting Up Your Unit Setting Date and Time Formats To set date and time formats: 1. From the Main Menu, tap Setup. 2. Double-tap Regional and Language Options. 3. Select the Regional Options tab. 4. Under Standards and formats, select the desired language. This will determine the date formats available for the time as well as the short and long dates.
- Page 235 Setting Up Your Unit Setting Date and Time Formats 5. If necessary, refine the settings as follows: 5a. Tap Customize to display the detailed settings. 5b. Select either the Time or Date tab, depending on the settings that you want to modify. 6.
-
Page 236: Adjusting The Date, Time And Time Zone
Setting Up Your Unit Adjusting the Date, Time and Time Zone Adjusting the Date, Time and Time Zone The current date and time are displayed at the bottom of the main window. When saving results, the unit also saves the corresponding date and time. Note: A dedicated clock battery keeps the date and time accurate. - Page 237 Setting Up Your Unit Adjusting the Date, Time and Time Zone To adjust the date and time: 1. From the Main Menu, tap Setup. 2. Double-tap Date and Time. 3. Select the Date & Time tab. 4. Modify the settings according to your needs. 5.
- Page 238 Setting Up Your Unit Adjusting the Date, Time and Time Zone To change the time zone: 1. From the Main Menu, tap Setup. 2. Double-tap Date and Time. 3. Select the Time Zone tab. 4. Modify the settings according to your needs. 5.
-
Page 239: Configuring The Power Management Options
Setting Up Your Unit Configuring the Power Management Options Configuring the Power Management Options To get the optimum performance out of your MAX-700, your unit comes with predefined sets of parameters (schemes) to manage power. When you do not use the unit for a while, the display may be turned off to save power. - Page 240 Setting Up Your Unit Configuring the Power Management Options The table below indicates the default values that are included in each of the predefined power schemes. When AC is Running on Power Scheme Action connected batteries Standard Turn off monitor Never After 5 minutes (selected by...
- Page 241 Setting Up Your Unit Configuring the Power Management Options To select a power scheme: 1. From the Main Menu, tap Setup. 2. Double-tap Power Options. 3. From the Power Schemes list, select the desired predefined set of parameters. 4. Tap Apply to confirm the changes, and then OK to return to the Control Panel window.
- Page 242 Setting Up Your Unit Configuring the Power Management Options To modify a power scheme: 1. From the Main Menu, tap Setup. 2. Double-tap Power Options. 3. From the Power Schemes list, select the predefined set of parameters that you want to modify or on which you want to base your new scheme.
-
Page 243: Configuring The Internet Options
Setting Up Your Unit Configuring the Internet Options Configuring the Internet Options You can browse the Web directly from your unit, provided that you have access to an Internet connection and that the Internet options are configured properly. If you are not sure about how you should configure your Internet access, see with your network administrator. -
Page 245: 15 Working With Your Unit
If you need more flexibility and a greater choice of report types, you can also transfer result files to a computer onto which applications such as EXFO FastReporter are installed. Note: Some applications may not offer print functions. MAX-700... - Page 246 Working with Your Unit Printing Documents To print documents: 1. Open a Web browser as follows: 1a. From the MAX-700 software, select the Utilities tab. 1b. Tap the Internet Explorer icon to open the browser. 2. Select the document that you want to print as follows: 2a.
- Page 247 Working with Your Unit Printing Documents 4. From the General tab, select the desired printer (PDFCreator by default). 5. If necessary, tap Preferences to adjust the parameters to your needs. Note: If you selected a network printer, you can save the whole set of preferences for future use with the Save As button.
-
Page 248: Viewing Pdf Files
Working with Your Unit Viewing PDF Files Viewing PDF Files You can view PDF files directly from your unit using the SumatraPDF reader. For more information on the available features for this reader, refer to the SumatraPDF online help. To view PDF files: 1. -
Page 249: Taking Screen Captures
Working with Your Unit Taking Screen Captures Taking Screen Captures You can take captures of what is displayed on your screen, directly from your unit. This could be useful for troubleshooting when you need another person to have a look at a specific configuration or problem. You could also use this tool for training purposes. - Page 250 Working with Your Unit Taking Screen Captures By default, the application generates file names as follows: IMG_[YEAR]_[MONTH]_[DAY]_[HOUR]_[MINUTE]_ [SEQUENTIAL NUMBER].bmp Example: For a screen capture taken on August 20, 2010, the file name could be: IMG_2010_08_20_13_23_01.bmp. Note: The HOUR value will appear in a 24-hour format, regardless of your unit's time settings.
- Page 251 Working with Your Unit Taking Screen Captures To take only one screen capture: From the unit's keypad, press the button and hold it down for about 3 seconds. The screen capture is automatically taken as soon as you release the button (a sound and visual effect typical of a camera taking a picture indicate that the capture is complete).
-
Page 252: Setting Storage Parameters For Screen Captures
Working with Your Unit Setting Storage Parameters for Screen Captures Setting Storage Parameters for Screen Captures You can modify the file format of the screen captures as well as the destination folder, that is the folder to which the captures will be sent. By default, images are saved in .bmp format, but you can configure the ... - Page 253 Working with Your Unit Setting Storage Parameters for Screen Captures To set the default image format: 1. From the Main Menu, tap System Settings. 2. If necessary, from System Settings, tap Display & Sound. 3. Under Screen snapshot, tap the Screen Snapshot Options button. 4.
- Page 254 Working with Your Unit Setting Storage Parameters for Screen Captures To modify the destination folder: 1. From the Main Menu, tap System Settings. 2. If necessary, from System Settings, tap Display & Sound. 3. Under Screen snapshot, tap the Screen Snapshot Options button. 4.
- Page 255 Working with Your Unit Setting Storage Parameters for Screen Captures 5. From the Browse for Folder window, select the folder that you want to use to store the screen captures. If necessary, you can create a folder. 6. When your selection is made, tap OK. 7.
-
Page 256: Reading Audio And Video Files
Working with Your Unit Reading Audio and Video Files Reading Audio and Video Files Your unit is equipped with the VLC media player which enables you to read audio files and to view video files (such as .avi and .divx). This could be especially useful if your company wants to use multimedia files for training. - Page 257 Working with Your Unit Reading Audio and Video Files To read video or audio files: 1. From the MAX-700 software, select File Manager. 2. Locate the video or audio file that you want to read. 3. Double-tap the file. The media player starts reading automatically if the file format is recognized.
-
Page 258: Installing Adobe Flash Player On Your Unit
Flash format. MPORTANT EXFO does not provide licenses for Adobe Flash Player. Contact Adobe to purchase a license that will entitle you to install Flash Player on your unit. - Page 259 Working with Your Unit Installing Adobe Flash Player on Your Unit MPORTANT Ensure to download the latest installation package for the 32-bit version of Flash Player for Windows (operating system), and Internet Explorer (browser). You should retrieve the EXE installer component.
-
Page 260: Browsing The Web
Working with Your Unit Browsing the Web Browsing the Web You can browse the Web directly from your unit, provided that you have access to an Internet connection. If you need to modify the Internet options, see Configuring the Internet Options on page 231. -
Page 261: Accessing Other Tools
Working with Your Unit Accessing Other Tools 2. Enter the desired Web address in the address bar and tap the button (located at the right of the address bar) to start browsing. 3. Close the window to return to the Utilities tab. Accessing Other Tools Your unit comes with free tools such as Wireshark to help you troubleshoot networks. -
Page 263: Using The Optional Built-In Power Meter And Vfl
16 Using the Optional Built-In Power Meter and VFL The MAX-700 can be equipped with an optical power meter to measure absolute power (dBm or W) or insertion loss (dB). The power meter can detect modulated signals (1 kHz, 2 kHz, and 270 Hz). The MAX-700 can also include a visual fault locator (VFL) to inspect or identify fibers. -
Page 265: 17 Inspecting Fibers With A Probe
17 Inspecting Fibers with a Probe The fiber inspection probe (FIP) is used to find dirty or damaged connectors by displaying an enlarged view of the connector surface. You can connect an FIP to your unit to view fiber ends. Fiber inspections are made using the ConnectorMax application. -
Page 267: 18 Managing Data
18 Managing Data You can copy, move, rename, delete files and folders directly on your unit. You can transfer files from your unit to a USB memory key or a computer. You can also transfer data from a storage device or a computer to your unit. Your unit is equipped with the following ports and devices for data transfer: Two USB 2.0 ports to connect a memory key or a USB to RS-232 ... - Page 268 Managing Data To view the free disk space on your unit: 1. From Main Menu, tap System Info. 2. Select Platform. The free disk space is displayed next to the Available Flash on “D:\ (APP)” item. 3. When you have finished, tap OK to close System Information. To manage files or folders on your unit only: From Main Menu, select File Manager.
- Page 269 Managing Data To transfer files or folders between your unit and a USB memory key: 1. Connect the USB memory key to the USB port. 2. From Main Menu, select File Manager. The list of available drives and folders should include the memory key (Removable Disk).
-
Page 270: Transferring Data Via Bluetooth
Managing Data Transferring Data via Bluetooth Transferring Data via Bluetooth If your unit is equipped with the optional Bluetooth device (internal), you can transfer data between your unit and a computer using the Bluetooth technology. By default, both the Bluetooth and Wi-Fi devices are enabled, but not connected to a network. - Page 271 Managing Data Transferring Data via Bluetooth MPORTANT Depending on the operating system that your computer is running, it is possible that only data transfer secured with a passkey be allowed. Since your unit cannot receive data secured with passkeys, in such a case, data transfer would only be possible from your unit to the computer.
- Page 272 Managing Data Transferring Data via Bluetooth To transfer data via Bluetooth: 1. Configure your unit as follows: 1a. From the Main Menu, tap Setup. 1b. Double-tap Bluetooth Devices. 1c. From the Options tab, under Discovery, select the Turn discovery on check box. 1d.
- Page 273 Managing Data Transferring Data via Bluetooth 2. Configure the computer as follows: 2a. On the computer, from Control Panel, double-click Bluetooth Devices. 2b. From the Options tab, under Discovery, select the Turn discovery on check box. 2c. Ensure that the Allow Bluetooth devices to connect to this computer check box is selected.
- Page 274 Managing Data Transferring Data via Bluetooth 5. Tap Bluetooth File Transfer Wizard. 6. From the Welcome window, tap Next. 7. Select Send a file and tap Next. MAX-700...
- Page 275 Managing Data Transferring Data via Bluetooth 8. Select the computer to which you want to transfer data as follows: 8a. Tap Browse. 8b. Select the desired computer, and then tap OK to confirm. MAX-700...
- Page 276 Managing Data Transferring Data via Bluetooth 9. If you want to use a passkey, select the corresponding check box and enter the passkey. When you have finished, tap Next. 10. Tap Browse to select the file that you want to send to the computer. 11.
- Page 277 Managing Data Transferring Data via Bluetooth 12. On the computer, when the application prompts you, allow the connection and enter the passkey if necessary. Note: Once you have established a secured connection using a passkey, this passkey is kept in memory both on your unit and on the computer until you remove this connection (Setup >...
-
Page 278: Connecting To A Wireless Network
Managing Data Connecting to a Wireless Network Connecting to a Wireless Network If your unit is equipped with the optional Wi-Fi device (internal), you can connect to a wireless network and benefit from all resources that are available on this network. You can transfer data exactly as you would do from an Ethernet network. - Page 279 Managing Data Connecting to a Wireless Network 2d. Ensure that the File and Printer Sharing item is selected. 2e. Tap OK to confirm. 3. On your unit, from the MAX-700 software, select the Utilities tab. 4. Tap WiFi Connect. 5. Tap OK to acknowledge the message on how to display the list of wireless networks.
- Page 280 Managing Data Connecting to a Wireless Network 6. Double-tap Wireless Network Connection. 7. If your unit is already connected to a wireless network, tap View Wireless Networks to display the list of wireless networks. MAX-700...
- Page 281 Managing Data Connecting to a Wireless Network 8. From the Wireless Network Connection window, select the wireless network to which you want to connect. 9. Tap Connect. MAX-700...
- Page 282 Managing Data Connecting to a Wireless Network 10. If the network is protected by a network key (password) enter it in the corresponding boxes and tap Connect. Note: Since all networks are different, you may also need to configure other parameters before being able to transfer data via Wi-Fi.
-
Page 283: Using The Usb To Rs-232 Adapter
RS-232 (serial) ports, you have to use a USB/RS-232 adapter. MPORTANT Only the USB/RS-232 adapters sold by EXFO are supported. Once the adapter has been detected, the unit assigns it a COM port number (values begin at COM 3). This COM port number is kept in memory even when you turn the unit off. - Page 284 Managing Data Using the USB to RS-232 Adapter To use the USB/RS-232 adapter: 1. Turn on both the unit and the serial device. 2. Connect as shown. You can connect the USB end of the adapter to any of the USB ports. USB end Serial end Serial...
- Page 285 Managing Data Using the USB to RS-232 Adapter 3. From your unit, retrieve the COM port of the adapter as follows: 3a. On your unit, from the Main Menu, select Setup. 3b. Double-tap Device Manager. 3c. Expand the Ports (COM & LPT) list to retrieve the COM port number that has been assigned to the adapter and write it down.
- Page 286 Managing Data Using the USB to RS-232 Adapter 4. From your unit, configure the communication parameters as follows: 4a. From the MAX-700 software, select the Utilities tab, then tap PuTTY. 4b. Configure the parameters. Tree view From the tree view, select Connection > Serial and set the ...
- Page 287 Managing Data Using the USB to RS-232 Adapter 5. From the device, set the communications parameters. IMPORTANT To be able to establish a communication between the unit and the device, you must set the following parameters to the same values as those defined on your unit: Speed ...
-
Page 288: Enabling Or Disabling The Bluetooth And Wi-Fi Devices
Managing Data Enabling or Disabling the Bluetooth and Wi-Fi Devices Enabling or Disabling the Bluetooth and Wi-Fi Devices By default, both the Wi-Fi and Bluetooth devices are enabled on units that are equipped with the corresponding options. If you do not intend to transfer files via Bluetooth or to work with a wireless network for a certain period of time, you may wish to disable the devices to extend battery life. - Page 289 Managing Data Enabling or Disabling the Bluetooth and Wi-Fi Devices 3. Select Wireless Network Connection. 4. From the File menu, select Enable or Disable, according to your needs. MAX-700...
-
Page 290: Transferring Files With The Usb Data Mover Application
Managing Data Transferring Files with the USB Data Mover Application Transferring Files with the USB Data Mover Application With the USB Data Mover application, you can copy folders and files from your unit to a USB storage device quickly. You can retrieve files from the predefined source folders or specify your own folders. - Page 291 Managing Data Transferring Files with the USB Data Mover Application Each time you copy data, the application creates a folder on the storage device. This folder will contain the copied files and subfolders (original folder structure as well as folder and file names are kept). The application generates folder names as follows: [YEAR]-[MONTH]-[DAY]_[HOUR]-[MINUTE]-[SECOND] Example:...
- Page 292 Managing Data Transferring Files with the USB Data Mover Application 4. Select or clear the check boxes to adjust the folder selection to your needs. 5. If necessary, under Destination media, select the desired USB storage device. 6. Tap Copy. The files will remain on your unit after the transfer. 7.
- Page 293 Managing Data Transferring Files with the USB Data Mover Application To manage the list of source folders: 1. From the MAX-700 software, select the Utilities tab. 2. Tap USB Data Mover. 3. Tap User Preferences. MAX-700...
- Page 294 Managing Data Transferring Files with the USB Data Mover Application 4. If you want to add your own folders to the list of source folders, proceed as follows: 4a. Tap Add a Folder. 4b. Select the desired folder, and then tap OK. MAX-700...
- Page 295 Managing Data Transferring Files with the USB Data Mover Application 5. If you want to remove folders from the list of source folders, proceed as follows: 5a. Select the folder that you want to remove. 5b. Tap Remove Folder. Note: The application will not prompt you to confirm the removal of the folder from the list.
-
Page 296: Using Your Unit As An Ftp Server
Managing Data Using Your Unit as an FTP Server Using Your Unit as an FTP Server The use of your unit as an FTP server requires the installation of an FTP server (FileZilla Server) on your unit and the installation of the corresponding FTP client (FileZilla Client) on your computer. - Page 297 Managing Data Using Your Unit as an FTP Server 9. On your unit, create a folder on the Windows desktop. 10. Copy the installation files (from the USB key) to the newly created folder. 11. From the newly created folder, tap the .exe file to start the installation. 12.
-
Page 299: 19 Accessing Your Unit Remotely
19 Accessing Your Unit Remotely You can access your unit remotely from a computer using the TightVNC Client application. The table below presents the characteristics of this application. Characteristic TightVNC Client Type of connection Not exclusive; several users can be connected to the unit at the same time (sharing the same session). -
Page 300: Working With Tightvnc
Accessing Your Unit Remotely Working With TightVNC Working With TightVNC The control of your unit with TightVNC requires the TightVNC Server (already installed on your unit) and the TightVNC Client Viewer (that you must install on your computer). The first time you start the TightVNC Server on your unit, the application will prompt you to define passwords. - Page 301 Accessing Your Unit Remotely Working With TightVNC AUTION Be very careful if you use TightVNC to transfer files between a computer and your unit (TightVNC Server). Transfer from a computer to your unit: If the transfer is interrupted, all files on your unit having the same name as those on the computer WILL BE DELETED.
- Page 302 Accessing Your Unit Remotely Working With TightVNC Configuring the TightVNC Server The TightVNC Server is already installed on your unit. You must configure passwords before establishing a connection between a computer and your unit. To configure the TightVNC Server: 1. If you have configured TightVNC Server to start automatically when you turn on your unit, go directly to step 2.
- Page 303 Accessing Your Unit Remotely Working With TightVNC 3. In the Primary password and View-only password boxes, type the desired passwords. Note: The two passwords are independent of each other. They do not have to be identical. 4. Tap Apply, and then OK. MAX-700...
- Page 304 Accessing Your Unit Remotely Working With TightVNC Installing the TightVNC Viewer on a Client Computer If the TightVNC Viewer is not already installed on your computer, you can install it with the DVD that came with your MAX-700. To install the TightVNC Viewer on your computer: 1.
- Page 305 Accessing Your Unit Remotely Working With TightVNC 4. Write down the IP address, and then close the window. Note: It may take a few seconds before you see the IP address on the list. 5. If you have configured TightVNC Server to start automatically when you turn on your unit, go directly to step 6.
-
Page 306: Configuring Tightvnc Server To Start Automatically
Accessing Your Unit Remotely Configuring TightVNC Server to Start Automatically Configuring TightVNC Server to Start Automatically By default, the TightVNC Server is not started automatically when you turn on your unit. However, you can modify this setting. This is especially useful if you need to remotely connect to your unit without having the unit close at hand. - Page 307 Accessing Your Unit Remotely Configuring TightVNC Server to Start Automatically To configure TightVNC server to start automatically: 1. On your unit, from the Main Menu, select System Settings. 2. Tap Remote Session. 3. Select the Start TightVNC Server automatically at unit startup check box.
-
Page 308: Adding Exceptions To The Firewall
Accessing Your Unit Remotely Adding Exceptions to the Firewall Adding Exceptions to the Firewall Your unit is protected by the Microsoft firewall to prevent unauthorized access when it is connected to a network or to the Internet. The firewall has been preconfigured so that all the applications that come with your unit work properly. - Page 309 Accessing Your Unit Remotely Adding Exceptions to the Firewall 3. Select the Exceptions tab. 4. Tap Add Program to add any application that you need. 5. When you have finished, tap OK (located at the bottom of the dialog box) to confirm the changes and return to the Control Panel window. MAX-700...
-
Page 311: 20 Maintenance
20 Maintenance To help ensure long, trouble-free operation: Always inspect fiber-optic connectors before using them and clean them if necessary. Keep the unit free of dust. Clean the unit casing and front panel with a cloth slightly dampened ... -
Page 312: Cleaning Eui Connectors
Maintenance Cleaning EUI Connectors Cleaning EUI Connectors Regular cleaning of EUI connectors will help maintain optimum performance. There is no need to disassemble the unit. MPORTANT If any damage occurs to internal connectors, the module casing will have to be opened and a new calibration will be required. To clean EUI connectors: 1. - Page 313 6c. With a dry lint-free wiping cloth, gently wipe the same surfaces to ensure that the connector and ferrule are perfectly dry. 6d. Verify connector surface with a portable fiber-optic microscope (for example, EXFO’s FOMS) or fiber inspection probe (for example, EXFO’s FIP). ARNING Verifying the surface of the connector WHILE THE UNIT IS ACTIVE WILL result in permanent eye damage.
-
Page 314: Cleaning Detector Ports
Maintenance Cleaning Detector Ports Cleaning Detector Ports Regular cleaning of detectors will help maintain measurement accuracy. MPORTANT Always cover detectors with protective caps when unit is not in use. To clean detector ports: 1. Remove the protective cap and adapter (FOA) from the detector. 2. -
Page 315: Cleaning The Touchscreen Of Your Max-700 Unit
Maintenance Cleaning the Touchscreen of Your MAX-700 Unit Cleaning the Touchscreen of Your MAX-700 Unit Clean the touchscreen with a soft, non-abrasive cloth, such as one used for cleaning reading glasses, dampened with water. AUTION Using anything else than water can damage the special coating of the touchscreen. - Page 316 Maintenance Recharging the Main Battery MPORTANT Batteries are not charged at the factory. Install the battery compartment on your unit (see Replacing Batteries on page 305), and then fully charge the battery before using the unit for the first time. The battery is fully charged after a few hours or when the battery LED indicator stops flashing.
-
Page 317: Replacing Batteries
Replacing Batteries Your unit uses a four-cell battery that has been especially designed for EXFO. For this reason, you can only replace the main battery with a battery designed for your MAX-700. You can purchase new batteries and empty battery compartments (also known as “battery covers”) from EXFO. - Page 318 Maintenance Replacing Batteries 2b. Lift the mobile part of the battery compartment screws and turn the screws counterclockwise until the compartment is loose. Since they are captive screws, you cannot remove them completely. Turn screws counterclockwise Battery compartment AUTION Shocks and drops may have loosened the battery inside its compartment.
- Page 319 You are now ready to replace the battery. To replace (or install) the main battery: 1. If you do not have a replacement battery, contact EXFO to purchase a new one. 2. Position the battery compartment so that you can view its hollow part.
- Page 320 Maintenance Replacing Batteries 3. Install the battery as follows: 3a. Insert the new battery, respecting the polarity. You can use the image appearing inside the compartment as a guide. Battery poles Note: When the battery is correctly positioned, its poles should be facing upwards and be placed on the same side as shown on the illustration in the battery compartment.
-
Page 321: Verifying Your Max-700
Deviation is measured to determine if the OTDR needs recalibration. Setting your OTDR to zero can only be done at EXFO. However, you can test your OTDR to verify the accuracy of its measurement origin. To measure the deviation: 1. - Page 322 If the situation persists, you will observe a degradation in dynamic range. Return the OTDR to EXFO. Note: This does not affect the precision of distance or loss measurements. MAX-700...
- Page 323 The position of the marker should be equal to the length of the jumper (± 2 m). For example, 8 to 12 m if the jumper is 10 m long. If the distance error is beyond this limit, return the OTDR to EXFO. MAX-700...
- Page 324 If this is the case, carefully clean the connector. If the problem persists, change the output connector. If the problem remains even after changing the output connector, return the OTDR to EXFO. Note: This does not affect the precision of the distance or loss measurements.
- Page 325 Maintenance Verifying Your MAX-700 To measure the dynamic range: 1. Connect the OTDR as indicated below. Other configurations are possible, such as the one explained in the section on how to determine measurement range, if you use the shortest fiber length from that setup.
- Page 326 If this is the case, clean the connector. If the problem persists, change the output connector. If the problem remains even after changing the output connector, return the OTDR to EXFO. Note: This does not affect the precision of the distance or loss measurements.
- Page 327 Maintenance Verifying Your MAX-700 To determine the measurement range (singlemode models only): 1. Connect the OTDR as indicated below. Other configurations are possible, but the fiber should have several sections longer than 2 km, with no loss greater than 8 dB and with the average attenuation not exceeding 1 dB/km.
- Page 328 Maintenance Verifying Your MAX-700 2. Set the distance range to 80 km (singlemode fiber), the pulse width to the longest value available and the acquisition time to 180 seconds. The measurement range using the non-reflective event method represents the amount of attenuation (dB) between the launch level and a 0.5 dB splice (which can be detected and measured to an accuracy of ±...
-
Page 329: Recalibrating The Unit
You should determine the adequate calibration interval for your unit according to your accuracy requirements. Under normal use, EXFO recommends calibrating your unit every year. Recycling and Disposal (Applies to European Union Only) For complete recycling/disposal information as per European Directive WEEE 2002/96/EC, visit the EXFO Web site at www.exfo.com/recycle. -
Page 331: 21 Troubleshooting
21 Troubleshooting Solving Common Problems Unit-Related Problems Problem Cause Solution Unit does not turn on. Battery is discharged. Charge the battery. Replace the battery with a fully charged one. Connect the unit to an external power supply using the AC adapter/charger. - Page 332 Troubleshooting Solving Common Problems Problem Cause Solution One of the applications Press and hold it down until the is not responding. shutdown menu appears, then select Turn off. Turn the unit on again to reset it. Impossible to calibrate Screen calibration is Press and hold it down until ...
- Page 333 Troubleshooting Solving Common Problems Problem Cause Solution Unit switches to standby Power schemes are Select one of the predefined power mode unexpectedly. not defined correctly. schemes. For more information, see the Configuring the Power Management Options section. Unit is not responding. Restore your unit.
- Page 334 “normal”. If you still see the message about live fiber error even if no fiber is connected to the OTDR, contact EXFO. Never connect a live fiber to the OTDR port without a proper setup. Any incoming optical power ranging from –65 dBm to –40 dBm will affect...
- Page 335 If you still see the message about live wavelength. fiber error even if no fiber is connected to the OTDR, contact EXFO. Singlemode live-fiber testing requires that the integrated power in the test channel (corresponding to the filter bandwidth of the SM Live port) be as low as possible.
-
Page 336: Restoring Your Unit To Normal Operation
(as it was when you purchased it) or restore it with a specific Windows image (WIM) that could have been provided to you by EXFO customer service, for example. MPORTANT The restoration of the system partition cannot be undone or stopped once it is started. - Page 337 Troubleshooting Restoring Your Unit to Normal Operation To navigate in the various windows using a keyboard (connected to your unit): Use up/down and left/right arrow keys. You can also use the TAB key to go to the next group of features. ...
- Page 338 Troubleshooting Restoring Your Unit to Normal Operation 4. From the main window, select Restore system partition from an image, then tap Next. 5. If you want to revert your unit to its initial state (most cases), select Factory recovery image. If you prefer to use an image file (provided by customer service, for example), select .wim file and use the Browse button to locate the file.
- Page 339 Troubleshooting Restoring Your Unit to Normal Operation 6. Tap Next to proceed to the next step. 7. Tap Next to start the restoration process. The unit will restart upon completion of the process. MAX-700...
- Page 340 Troubleshooting Restoring Your Unit to Normal Operation To retrieve data from the D drive: 1. Turn on the MAX-700. 2. While the system is displaying the boot menu (3 seconds), press the ARROW DOWN key on your keyboard to select the Maintenance and recovery mode.
- Page 341 Troubleshooting Restoring Your Unit to Normal Operation 5. Select the files to back up. A check mark indicates a selection of the entire folder (subfolders and files). A shaded check box indicates that not all of the files of subfolders are selected. 6.
- Page 342 Troubleshooting Restoring Your Unit to Normal Operation 7. Select the USB device onto which you want to save the data from the list of available devices. Note: If you have forgotten to connect the USB device at this point and that it does not show up in the list, tap Back, connect the device, then tap Next to return to this window.
- Page 343 Troubleshooting Restoring Your Unit to Normal Operation To verify disk integrity: 1. Turn on the MAX-700. 2. While the system is displaying the boot menu (3 seconds), press the ARROW DOWN key on your keyboard to select the Maintenance and recovery mode. 3.
- Page 344 Troubleshooting Restoring Your Unit to Normal Operation 5. Tap Next to start the disk analysis. Once the analysis is complete, you can view a report on each drive by tapping Details. 6. Tap OK once you have finished. 7. To exit the integrity analysis tool, tap Cancel to return to the main window.
-
Page 345: Contacting The Technical Support Group
Contacting the Technical Support Group To obtain after-sales service or technical support for this product, contact EXFO at one of the following numbers. The Technical Support Group is available to take your calls from Monday to Friday, 8:00 a.m. to 7:00 p.m. -
Page 346: Transportation
Troubleshooting Transportation Transportation Maintain a temperature range within specifications when transporting the unit. Transportation damage can occur from improper handling. The following steps are recommended to minimize the possibility of damage: Pack the unit in its original packing material when shipping. ... -
Page 347: 22 Warranty
22 Warranty General Information EXFO Inc. (EXFO) warrants this equipment against defects in material and workmanship for a period of one year from the date of original shipment. EXFO also warrants that this equipment will meet applicable specifications under normal use. -
Page 348: Liability
Liability Liability EXFO shall not be liable for damages resulting from the use of the product, nor shall be responsible for any failure in the performance of other items to which the product is connected or the operation of any system of which the product may be a part. -
Page 349: Service And Repairs
5. Return the equipment, prepaid, to the address given to you by support personnel. Be sure to write the RMA number on the shipping slip. EXFO will refuse and return any package that does not bear an RMA number. -
Page 350: Exfo Service Centers Worldwide
Warranty EXFO Service Centers Worldwide EXFO Service Centers Worldwide If your product requires servicing, contact your nearest authorized service center. EXFO Headquarters Service Center 400 Godin Avenue 1 866 683-0155 (USA and Canada) Quebec (Quebec) G1M 2K2 Tel.: 1 418 683-5498... -
Page 351: A Technical Specifications
MPORTANT The following technical specifications can change without notice. The information presented in this section is provided as a reference only. To obtain this product’s most recent technical specifications, visit the EXFO Web site at www.exfo.com. SPECIFICATIONS TECHNICAL SPECIFICATIONS ESTER... - Page 352 Technical Specifications GENERAL SPECIFICATIONS 190 mm x 252 mm x 66 mm (7 in x 9 in x 2 Size (H x W x D) Weight (with battery) 2.2 kg (4.7 lb) Temperature Operating 0 °C to 50 °C (32 °F to 122 °F) Storage –40 °C to 70 °C (–40 °F to 158 °F) Relative humidity...
-
Page 353: B Description Of Event Types
Description of Event Types This section describes all types of events that may appear in the events table generated by the application. Here is a guide to the descriptions: Each type of event has its own symbol. Each type of event is represented by a graph of a fiber trace, which ... -
Page 354: Span Start
Description of Event Types Span Start Span Start The Span Start of a trace is the event that marks the beginning of the fiber span. By default, the Span Start is placed on the first event of a tested fiber (typically the first connector of the OTDR itself). -
Page 355: Continuous Fiber
Description of Event Types Continuous Fiber Continuous Fiber Reflected power (dB) Continuous fiber Distance (km) This event indicates that the selected acquisition range was shorter than the fiber length. The fiber end was not detected because the analysis process ended ... -
Page 356: End Of Analysis
Description of Event Types End of Analysis End of Analysis Reflected power (dB) Distance (km) This event indicates that the pulse width used did not provide enough dynamic range to get to the end of the fiber. The analysis ended before reaching the end of the fiber because the ... -
Page 357: Non-Reflective Event
Description of Event Types Non-Reflective Event Non-Reflective Event Reflected power (dB) Non-reflective event Linear downward slope due to Rayleigh backscatter Distance (km) This event is characterized by a sudden decrease in the Rayleigh backscatter signal level. It appears as a discontinuity in the downward slope of the trace signal. -
Page 358: Reflective Event
Description of Event Types Reflective Event Reflective Event Reflected Clipped level power (dB) Reflective events Distance (km) Reflective events appear as spikes in the fiber trace. They are caused by an abrupt discontinuity in the index of refraction. Reflective events cause a significant portion of the energy initially ... -
Page 359: Positive Event
Description of Event Types Positive Event Positive Event Reflected power (dB) Positive event Distance (km) This event indicates a splice with an apparent gain, due to the junction of two fiber sections having different fiber backscatter characteristics (backscatter and backscatter capture coefficients). A loss value is specified for positive events. -
Page 360: Launch Level
Description of Event Types Launch Level Launch Level Reflected power (dB) Launch level event position Second event Launch level Linear area Distance (km) This event indicates the level of the signal launched into the fiber. The figure above shows how the launch level is measured. ... -
Page 361: Fiber Section
Description of Event Types Fiber Section Fiber Section Reflected power (dB) Fiber Fiber section section Distance (km) This symbol denotes a fiber section with no event. The sum of all fiber sections contained in an entire fiber trace equals the total fiber length. -
Page 362: Merged Event
Description of Event Types Merged Event Merged Event Reflected power (dB) Reflective events Point A Total loss ( Point B Merged Reflective event position Distance (km) This symbol denotes an event combined with one or more other events. It also indicates the total loss produced by the merged events following it in the events table. - Page 363 Description of Event Types Merged Event The total loss ( dB) produced by the events is measured by plotting two straight lines. The first line is plotted by fitting, through least-square approximation, trace points in the linear area preceding the first event.
- Page 364 Description of Event Types Merged Event Pass/Fail Tests As an example about pass/fail tests, let us consider the situation below: Merged event Merged sub-events: 2 reflective losses 1 non-reflective loss Thresholds: Reflective loss: 0.5 dB Event loss Non-reflective Loss: 0.2 dB For a merged event, it is possible to determine the global event loss, but not the contribution of each sub-event.
- Page 365 Description of Event Types Merged Event All Event Types Are Tested In the first case, where all event types are tested, the pass/fail conditions are as follows: If the event loss is less than or equal to the smallest threshold value, ...
- Page 366 Description of Event Types Merged Event Not All Event Types Are Tested In this situation, the only thing that we can clearly know is when the loss has a Pass status. If the global event loss is less than or equal to the smallest threshold value (a value that is tested, of course), we are sure that the merged event status is Pass.
- Page 367 Description of Event Types Merged Event Effect of Event Status in the Global Trace Status A trace status is, by default, set to Unknown. If a trace is set to Fail once, it remains with that status (it cannot be set ...
-
Page 368: Echo
Description of Event Types Echo Echo Reflected power (dB) OTDR connector Second connector End connector Echo Lightwave travel Distance (km) This symbol indicates that a reflective event has been detected after the end of the fiber. In the example above, the launched pulse travels up to the end ... -
Page 369: Reflective Event (Possible Echo)
Description of Event Types Reflective Event (Possible Echo) Reflective Event (Possible Echo) Reflected power (dB) OTDR connector Second connector Third connector Reflective event (possible echo) Distance (km) This symbol indicates a reflective event that can be a real reflection or an echo produced by another stronger reflection located closer to the source. -
Page 371: Index
Index Index application, starting ........38 Att. column in events table......116 ***** indication ........178 attenuation fiber section ........... 70 fiber-section threshold ......70 LSA measurement method....176 AC requirements ......... 16 measurement........176 accessing power meter......251 reflectance ........... 178 accuracy, trace .......... - Page 372 Index calibrating the touchscreen....... 202 data calibration integrity ..........331 certificate..........317 points ............ 66 interval ..........317 retrieving ..........328 capacitors............ 15 date of trace acquisition......186 capturing images ........237 decrementation, file name ....44, 80 car outlet, charging battery with....304 default trace name ........
- Page 373 EUI connectors, cleaning ......300 locating event ........117 event trace editing buttons ......117 deleting ..........146 EXFO universal interface. see EUI description of types ......341 Explorer, Internet........248 difference with fault ........ 9 external power supply ......... 15 distance measurement......
- Page 374 Index length in Trace Info. tab ....75, 136 setting ........... 75 in Trace Info. tab........137 span loss in Trace Info. tab ....136 modification ........135 zooming (automatic) ......124 obtaining ..........61 file name, in trace display ....90, 128 setting ...........
- Page 375 Index macrobends, viewing ........ 113 opening trace file ........162 maintenance optical return loss. see ORL battery..........303 options detector ports........302 software..........33 EUI connectors........300 used at startup........210 front panel........... 299 general information......299 module required for calculations ..179 touchscreen .........
- Page 376 75 attenuation.......... 178 pass/fail thresholds ........ 70 detection threshold ..... 137, 152 shipping to EXFO........337 modification ........140 signal-to-noise ratio ........64 of event ..........116 software of non-reflective events ....... 178 options ..........33 source of inaccurate measurements ..
- Page 377 Index span start reflectance ..........70 description........... 342 reflectance detection ....137, 152 effect of setting on events table ..75, 157 setting pass/fail ........ 70–71 specifications, product ......339 span length..........70 splice loss span loss ..........70 average, in Trace Info. tab ....136 splice loss..........
- Page 378 Index storage, in different formats....181 swapping..........161 unchangeable events......... 140 trace display undeletable events ........146 behavior on zoom ....... 125 unit clearing traces ........134 repairing ..........15 displaying file name....... 90, 128 restoring ..........325 parameters ........90, 128 unit recalibration ........
- Page 379 CHINESE REGULATION ON RESTRICTION OF HAZARDOUS SUBSTANCES NAMES AND CONTENTS OF THE TOXIC OR HAZARDOUS SUBSTANCES OR ELEMENTS CONTAINED IN THIS EXFO PRODUCT EXFO Indicates that this toxic or hazardous substance contained in all of the homogeneous materials for this part is below the limit requirement in SJ/T11363-2006...
- Page 380 MARKING REQUIREMENTS Product Environmental protection use period (years) Logo This Exfo product EXFO Battery If applicable.
- Page 381 Tel.: 1 978 367-5600 · Fax: 1 978 367-5700 EXFO NETHAWK Elektroniikkatie 2 FI-90590 Oulu, FINLAND Tel.: +358 (0) 403 010 300 · Fax: +358 (0) 8 564 5203 TOLL-FREE (USA and Canada) 1 800 663-3936 © 2012 EXFO Inc. All rights reserved. Printed in Canada (2012-05) ...
Need help?
Do you have a question about the MaxTester 700 and is the answer not in the manual?
Questions and answers