Table of Contents
Advertisement
Quick Links
Advertisement
Table of Contents

Related Manuals for EXFO FTV-700 series


Summary of Contents for EXFO FTV-700 series
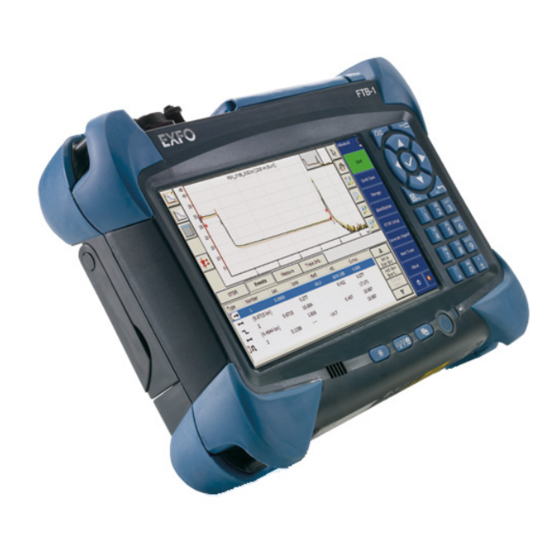
- Page 1 User Guide FTB-700 Series OTDR for FTB-1...
-
Page 2: Units Of Measurement
EXFO Inc. (EXFO). Information provided by EXFO is believed to be accurate and reliable. However, no responsibility is assumed by EXFO for its use nor for any infringements of patents or other rights of third parties that may result from its use. -
Page 3: Table Of Contents
Starting Module Applications ....................15 Timer ............................16 4 Preparing Your OTDR for a Test ..............17 Installing the EXFO Universal Interface (EUI) .................17 Cleaning and Connecting Optical Fibers ................18 Naming Trace Files Automatically ..................20 Enabling or Disabling the First Connector Check ..............24 Setting Macrobend Parameters .....................25... - Page 4 Contents 7 Testing Fibers in Template Mode (optional) ..........55 Template Principle .........................55 Restrictions of Template Mode ....................56 Acquiring the Reference Trace ....................58 Acquiring Traces in Template Mode ..................60 Selecting a Reference Trace ....................68 8 Testing Fibers in Fault Finder Mode ............69 Acquiring Traces in Fault Finder Mode ..................69 Naming Fault Finder Files Automatically ................72 Selecting the Default File Format for the Fault Finder Traces ..........74...
- Page 5 Contents 10 Analyzing Traces and Events ..............99 Graph View .........................100 Linear View .........................102 Summary Table ........................104 Events Tab ...........................106 Measure Tab ........................110 Trace Info. Tab ........................110 Displaying the Graph in Full Screen ..................111 Selecting the Default View ....................113 Automatically Displaying the Event Table after Acquisitions ..........115 Automatically Zooming in on the Fiber Span ..............116 Using Zoom Controls ......................117 Setting Trace Display Parameters ..................120...
- Page 6 Contents 13 Creating and Generating Reports ............177 Adding Information to the Test Results ................177 Generating a Report ......................179 14 Using the OTDR as a Light Source ............185 15 Analyzing Traces with the Bidirectional Analysis Application (Optional) .........189 Starting and Exiting the Bidirectional Analysis Application ..........191 Creating Bidirectional Measurement Files ................193 Opening Existing Bidirectional Measurement Files ..............197 Displaying Traces and Bidirectional Measurement ..............198...
- Page 7 18 Warranty ....................283 General Information ......................283 Liability ..........................284 Exclusions ...........................284 Certification ........................284 Service and Repairs ......................285 EXFO Service Centers Worldwide ..................286 A Technical Specifications ................287 B Description of Event Types ..............289 Span Start ..........................290 Span End ...........................290 Short Fibers ........................290 Continuous Fiber .......................291...
-
Page 8: Certification Information
FCC Information Electronic test equipment is exempt from Part 15 compliance (FCC) in the United States. However, compliance verification tests are systematically performed on most EXFO equipment. Information Electronic test equipment is subject to the EMC Directive in the European Union. -
Page 9: Declaration Of Conformity
2006/95/EC - The Low Voltage Directive 2004/108/EC - The EMC Directive 2006/66/EC - The Battery Directive 93/68/EEC - CE Marking And their amendments Manufacturer’s Name: EXFO Inc. Manufacturer’s Address: 400 Godin Avenue Quebec, Quebec Canada, G1M 2K2 (418) 683-0211 Equipment Type/Environment: Test &... -
Page 11: Introducing The Ftb-700 Otdr
Introducing the FTB-700 OTDR The FTB-700 OTDR allows you to characterize a fiber-optic span, usually optical fiber sections joined by splices and connectors. The optical time domain reflectometer (OTDR) provides an inside view of the fiber, and can calculate fiber length, attenuation, breaks, total return loss, and splice, connector and total losses. -
Page 12: Main Features
Introducing the FTB-700 OTDR Main Features Main Features The OTDR: Offers impressive dynamic range with short dead zones. Performs quick acquisitions with low noise levels to enable accurate low-loss splice location. Acquires OTDR traces made of up to 256 000 points that provide a sampling resolution as fine as 4 cm. -
Page 13: Trace Acquisition Modes
Introducing the FTB-700 OTDR Trace Acquisition Modes Trace Acquisition Modes The OTDR application provides the following trace acquisition modes: Auto: Automatically calculates fiber length, sets acquisition parameters, acquires traces, and displays event tables and acquired traces. Advanced: Offers all the tools needed to perform integral OTDR tests and measurements and gives you control over all test parameters. -
Page 14: Data Post-Processing
Introducing the FTB-700 OTDR Data Post-Processing With the optional Event Characterization (EC) software package you can: Have access to the OTDR Bidirectional application and perform a bidirectional analysis on two unidirectional OTDR traces. Test in Template Mode, test fibers and compare the results to a reference trace. -
Page 15: Otdr Basic Principles
Introducing the FTB-700 OTDR OTDR Basic Principles OTDR Basic Principles An OTDR sends short pulses of light into a fiber. Light scattering occurs in the fiber due to discontinuities such as connectors, splices, bends, and faults. An OTDR then detects and analyzes the backscattered signals. The signal strength is measured for specific intervals of time and is used to characterize events. - Page 16 Introducing the FTB-700 OTDR OTDR Basic Principles An OTDR uses the effects of Rayleigh scattering and Fresnel reflection to measure the fiber’s condition, but the Fresnel reflection is tens of thousands of times greater in power level than the backscatter. Rayleigh scattering occurs when a pulse travels down the fiber and small variations in the material, such as variations and discontinuities in the index of refraction, cause light to be scattered in all directions.
-
Page 17: Conventions
Introducing the FTB-700 OTDR Conventions Conventions Before using the product described in this manual, you should understand the following conventions: ARNING Indicates a potentially hazardous situation which, if not avoided, could result in death or serious injury. Do not proceed unless you understand and meet the required conditions. -
Page 19: Safety Information
Safety Information General Safety Information ARNING Do not install or terminate fibers while a light source is active. Never look directly into a live fiber and ensure that your eyes are protected at all times. ARNING Use of controls, adjustments and procedures for operation and maintenance other than those specified herein may result in hazardous radiation exposure or impair the protection provided by this unit. -
Page 21: Getting Started With Your Otdr
Getting Started with Your OTDR Inserting and Removing Test Modules AUTION Never insert or remove a module while the FTB-1 is turned on. This will result in immediate and irreparable damage to both the module and unit. To insert a module into the FTB-1: 1. - Page 22 Getting Started with Your OTDR Inserting and Removing Test Modules 4. Using a flat screwdriver, turn the screws (4) clockwise until they are tightened. This will secure the module into its “seated” position. Turn screws clockwise Back panel When you turn on the unit, the startup sequence will automatically detect the module.
- Page 23 Getting Started with Your OTDR Inserting and Removing Test Modules To remove a module from the FTB-1: 1. Exit Mini ToolBox and turn off your unit. 2. Position the unit so that its front panel rests on a flat surface such as a table.
- Page 24 Getting Started with Your OTDR Inserting and Removing Test Modules 4. Hold the module by its sides (NOT by the connectors) and pull it up. AUTION Pulling a module by its connectors could seriously damage both the module and connector. Always pull a module by its casing. FTB-700 Series...
-
Page 25: Starting Module Applications
Starting Module Applications Starting Module Applications Your modules can be configured and controlled from their dedicated applications in Mini ToolBox. To start a module application: From Mini ToolBox, at the bottom of the window, press the button corresponding to the desired application. To start the Power Meter or Probe application: From Main Menu, press Power Meter or Probe. -
Page 26: Timer
Timer The main window (shown below) contains all the commands required to control the OTDR: Data display Button bar Function Tabs Note: Due to screen resolution, the appearance of your OTDR application may vary slightly from the illustrations presented in this user guide. Timer Once the acquisition has begun, a timer is displayed on the right-hand side of the screen, indicating the remaining time until the next acquisition. -
Page 27: Preparing Your Otdr For A Test
Preparing Your OTDR for a Test Installing the EXFO Universal Interface (EUI) The EUI fixed baseplate is available for connectors with angled (APC) or non-angled (UPC) polishing. A green border around the baseplate indicates that it is for APC-type connectors. -
Page 28: Cleaning And Connecting Optical Fibers
To ensure maximum power and to avoid erroneous readings: Always inspect fiber ends and make sure that they are clean as explained below before inserting them into the port. EXFO is not responsible for damage or errors caused by bad fiber cleaning or handling. - Page 29 Preparing Your OTDR for a Test Cleaning and Connecting Optical Fibers 3. Carefully align the connector and port to prevent the fiber end from touching the outside of the port or rubbing against other surfaces. If your connector features a key, ensure that it is fully fitted into the port’s corresponding notch.
-
Page 30: Naming Trace Files Automatically
Preparing Your OTDR for a Test Naming Trace Files Automatically Naming Trace Files Automatically Each time you start an acquisition, the application suggests a file name based on autonaming settings. This file name appears on the upper part of the graph and the linear view. The file name is made of a static part (alphanumeric) and a variable part (numeric) that will be incremented or decremented, according to your selection, as follows:... - Page 31 Preparing Your OTDR for a Test Naming Trace Files Automatically Note: If you select the Bellcore (.sor) format, the unit will create one file per wavelength (for example, TRACE001_1310.sor and TRACE001_1550.sor, if you included both 1310 nm and 1550 nm in your test). The native format contains all wavelengths in a single file.
- Page 32 Preparing Your OTDR for a Test Naming Trace Files Automatically 4. Fill out the required information in the corresponding boxes and select the direction for your trace files. 5. Press the button appearing next to the Fiber ID box to change the contents of the fiber identification.
- Page 33 Preparing Your OTDR for a Test Naming Trace Files Automatically 7. Press File Autonaming to set up the trace file name options. 8. In the File Name window, select the desired components to include in the file name. You can change the order of apparition with the up and down arrow buttons.
-
Page 34: Enabling Or Disabling The First Connector Check
Preparing Your OTDR for a Test Enabling or Disabling the First Connector Check Enabling or Disabling the First Connector Check Note: This function is available in all OTDR modes. However, the first connector check parameter used in Fault Finder mode is independent from the one used in the other OTDR modes (Auto, Advanced and Template). -
Page 35: Setting Macrobend Parameters
Preparing Your OTDR for a Test Setting Macrobend Parameters Setting Macrobend Parameters Note: This function is available with the Auto Diagnostic (AD) optional software package only. Note: This function is available both in Advanced and Auto modes. Your unit can locate macrobends by comparing the loss values measured at a certain location, for a certain wavelength (for example, 1310 nm) with the loss values measured at the corresponding location, but for a greater wavelength (for example, 1550 nm). - Page 36 Only the combinations of wavelengths your module can support will be available. For more significant results, EXFO recommends to always select the combination of wavelengths including the smallest possible wavelength and the greatest wavelength (for example, if your module supports 1310 nm, 1550 nm, and 1625 nm, you would select the 1310 nm/1625 nm combination).
-
Page 37: Testing Fibers In Auto Mode
Testing Fibers in Auto Mode Auto mode automatically evaluates fiber length, sets acquisition parameters, acquires traces, and displays event tables and acquired traces. In Auto mode, you can set the following parameters directly: Test wavelengths (all selected by default) Fiber type (singlemode, singlemode live, or multimode) for models supporting these fiber types Autorange acquisition time IOR (group index), RBS coefficient and helix factor... - Page 38 Testing Fibers in Auto Mode Once the acquisition is complete or interrupted, the analysis starts for acquisitions of 5 seconds or more. After analysis, the trace is displayed and events appear in the events table. Trace display Event pane The application will also display status messages if you have selected to display pass/fail messages (see Setting Pass/Fail Thresholds on page 47).
- Page 39 Testing Fibers in Auto Mode To acquire traces in Auto mode: 1. Clean the connectors properly. 2. Connect a fiber to the OTDR port. If your unit is equipped with two OTDR ports, ensure that you connect the fiber to the appropriate port (singlemode, singlemode live, or multimode), depending on the wavelength you intend to use.
- Page 40 Testing Fibers in Auto Mode 6. Select the boxes corresponding to the desired test wavelengths. You must select at least one wavelength. 7. If you want to clear the settings the OTDR has determined to start with a new set of OTDR settings, press Reset. 8.
-
Page 41: Testing Fibers In Advanced Mode
Testing Fibers in Advanced Mode Advanced mode offers all the tools you need to perform complete OTDR tests and measurements manually and gives you control over all test parameters. Note: Most parameters can only be set if you select Advanced mode first. Once you have finished selecting your settings, you can simply return to the test mode you prefer. - Page 42 Testing Fibers in Advanced Mode Although the application sets the acquisition parameters, you can modify these values as needed, even while the acquisition is in progress. The OTDR simply restarts the averaging each time a modification is made. Note: You can interrupt the acquisition at any time. The application will display the information acquired to that point.
- Page 43 Testing Fibers in Advanced Mode To acquire traces: 1. Clean the connectors properly (see Cleaning and Connecting Optical Fibers on page 18). 2. Connect a fiber to the OTDR port. If your unit is equipped with two OTDR ports, ensure that you connect the fiber to the appropriate port (singlemode, singlemode live, or multimode), depending on the wavelength you intend to use.
- Page 44 Testing Fibers in Advanced Mode 7. If your OTDR supports singlemode, singlemode live, or multimode wavelengths, under Wavelengths, from the list, select the desired fiber type (for live-fiber testing, select SM Live; for C fiber, select 50 μm and for D fiber, select 62.5 μm). 8.
- Page 45 Testing Fibers in Advanced Mode Note: The application will only display the Save File dialog box if you have activated the feature to always be prompted when you save a file. From this dialog box, you can change the location, the file name and the file format.
-
Page 46: Setting The Autorange Acquisition Time
Testing Fibers in Advanced Mode Setting the Autorange Acquisition Time Setting the Autorange Acquisition Time Note: This function is available both in Advanced and Auto modes. When performing automatic acquisitions in Advanced mode (see Testing Fibers in Advanced Mode on page 31) or before activating Auto mode (see Testing Fibers in Auto Mode on page 27), you can set an autorange acquisition time for the OTDR to average acquisitions over a set time period. -
Page 47: Setting The Ior, Rbs Coefficient, And Helix Factor
Testing Fibers in Advanced Mode Setting the IOR, RBS Coefficient, and Helix Factor Setting the IOR, RBS Coefficient, and Helix Factor Note: This function is available both in Advanced and Auto modes. You should set the IOR (group index), RBS coefficient and helix factor before performing tests in order to apply them to all newly acquired traces. - Page 48 Testing Fibers in Advanced Mode Setting the IOR, RBS Coefficient, and Helix Factor 2. From the OTDR Setup window, go to the Acquisition tab. 3. Use the up or down arrow located on the side of the wavelength box to select the desired wavelength.
-
Page 49: Setting Distance Range, Pulse Width, And Acquisition Time
Testing Fibers in Advanced Mode Setting Distance Range, Pulse Width, and Acquisition Time Setting Distance Range, Pulse Width, and Acquisition Time The distance range, pulse width and acquisition time are set with the controls in the Advanced main window. Distance: corresponds to the distance range of the fiber span to be tested according to the selected measurement units (see Selecting the Distance Units on page 90). - Page 50 Testing Fibers in Advanced Mode Setting Distance Range, Pulse Width, and Acquisition Time Time: corresponds to the acquisition duration (period during which results will be averaged). Generally, longer acquisition times generate cleaner traces (this is especially true with long-distance traces) because as the acquisition time increases, more of the noise is averaged out.
- Page 51 Testing Fibers in Advanced Mode Setting Distance Range, Pulse Width, and Acquisition Time To set the parameters: From the OTDR tab: Press the dial corresponding to the parameter you wish to set (the selection marker will move clockwise). Press directly the value to select it. The selection marker will go to that value immediately.
- Page 52 Testing Fibers in Advanced Mode Setting Distance Range, Pulse Width, and Acquisition Time To use the same pulse and acquisition time for all wavelengths: 1. From the button bar, press OTDR Setup, then go to the Acquisition tab. 2. Select the Apply settings to all wavelengths box. The modifications you make to pulse, time, and range settings will now be applied to all wavelengths.
-
Page 53: Enabling The High-Resolution Feature
Testing Fibers in Advanced Mode Enabling the High-Resolution Feature Enabling the High-Resolution Feature You can select the high-resolution feature to obtain more data points per acquisition. This way, the data points will be closer to each other, which will result in a greater distance resolution for the trace. Note: When you test with the high-resolution feature, you should use a longer averaging time to maintain a signal-to-noise ratio (SNR) that will be equivalent to the one you would have got with the standard resolution. - Page 54 Testing Fibers in Advanced Mode Enabling the High-Resolution Feature To enable the high-resolution feature: 1. From the button bar, press OTDR Setup. 2. Go to the Acquisition tab. 3. Select the High-resolution acquisition box. Note: If your OTDR supports singlemode, singlemode live, or multimode wavelengths, the high-resolution feature will be activated either for the singlemode, singlemode live, or multimode wavelengths, depending on the selected fiber type.
-
Page 55: Enabling Or Disabling Analysis After Acquisition
Testing Fibers in Advanced Mode Enabling or Disabling Analysis After Acquisition Enabling or Disabling Analysis After Acquisition The OTDR trace acquisition procedure will be completed by the analysis. You can either choose to automatically analyze each trace immediately after the acquisition, or perform the analysis whenever it suits you best. When the analysis process is disabled, the Event table of a newly acquired trace will be empty. - Page 56 Testing Fibers in Advanced Mode Enabling or Disabling Analysis After Acquisition To enable or disable the analysis after trace acquisition: 1. From the button bar, press OTDR Setup. 2. Go to the Analysis tab. 3. If you want the OTDR to automatically analyze an acquired trace, select the Automatically analyze data after acquisition box.
-
Page 57: Setting Pass/Fail Thresholds
Testing Fibers in Advanced Mode Setting Pass/Fail Thresholds Setting Pass/Fail Thresholds You can activate and set Pass/Fail threshold parameters for your tests. You can set thresholds for splice loss, connector loss, reflectance, fiber section attenuation, span loss, span length, and span ORL. You can apply the same pass/fail thresholds to all test wavelengths or apply them separately to each one. - Page 58 Testing Fibers in Advanced Mode Setting Pass/Fail Thresholds The following table provides the default, minimum and maximum thresholds. Test Default Minimum Maximum Splice loss (dB) 1.000 0.015 5.000 Connector loss (dB) 1.000 0.015 5.000 Fiber section attenuation (dB/km) 0.400 0.000 5.000 Once the thresholds are set, the application will be able to perform Pass/Fail tests to determine the status of the various events (pass or fail).
- Page 59 Testing Fibers in Advanced Mode Setting Pass/Fail Thresholds To set pass/fail thresholds: 1. From the button bar, select OTDR Setup, then select the Event Table tab. 2. From the Wavelength list, select the wavelength for which you want to set thresholds. Value associated Threshold to set with the...
- Page 60 Testing Fibers in Advanced Mode Setting Pass/Fail Thresholds 5. If you want to apply the thresholds you have just defined to one or several other wavelengths, proceed as follows: 5a. Press the Copy to Other Wavelengths button. 5b. Select the boxes corresponding to the wavelengths for which you want to use the same thresholds.
- Page 61 Testing Fibers in Advanced Mode Setting Pass/Fail Thresholds To revert to default threshold values and to delete custom wavelengths: 1. From the button bar, select OTDR Setup, then select the Event Table tab. 2. Press the Revert to Factory Settings button. 3.
-
Page 62: Setting A Default Span Start And Span End
Testing Fibers in Advanced Mode Setting a Default Span Start and Span End Setting a Default Span Start and Span End By default, the span start and span end of a fiber are assigned, respectively, to the first event (the launch level event) and the last event (often a non-reflective or reflective end event) of a trace. - Page 63 Testing Fibers in Advanced Mode Setting a Default Span Start and Span End To change the default span start and span end for traces: 1. From the button bar, press OTDR Setup. 2. From the OTDR Setup window, go to the Analysis tab. 3.
-
Page 65: Testing Fibers In Template Mode (Optional)
Testing Fibers in Template Mode (optional) Note: This function is available with the optional Event Characterization (EC) software package only. Template mode allows you to test fibers and compare them to a reference trace that was previously acquired and analyzed. Template Principle Cables contain numerous fibers. -
Page 66: Restrictions Of Template Mode
Testing Fibers in Template Mode (optional) Restrictions of Template Mode You can save the trace after analysis. If former results have not been saved yet, the application prompts you to save them before starting a new acquisition. Template mode can be used on an unlimited number of traces, as long as you have at least one reference trace. - Page 67 Testing Fibers in Template Mode (optional) Restrictions of Template Mode Item To be valid... Pulse width Must be: Reference trace pulse Reference trace pulse ⎛ ⎞ ≤ -------------------------------------------------- - Current trace pulse Current trace pulse ⎝ ⎠ ≤ × Current trace pulse Reference trace pulse Current trace pulse Reference trace pulse...
-
Page 68: Acquiring The Reference Trace
Testing Fibers in Template Mode (optional) Acquiring the Reference Trace Acquiring the Reference Trace You must acquire a reference trace before you start the Template mode. The acquisition parameters you define for this reference trace will be used to acquire subsequent traces. To acquire the reference trace: 1. - Page 69 Testing Fibers in Template Mode (optional) Acquiring the Reference Trace The application will use a file name based on the autonaming parameters you defined (see Naming Trace Files Automatically on page 20). This file name appears at the top of the graph and at the top of the linear view table.
-
Page 70: Acquiring Traces In Template Mode
Testing Fibers in Template Mode (optional) Acquiring Traces in Template Mode Acquiring Traces in Template Mode To acquire traces in Template mode, you must first open your reference trace in the application. If you want your reference trace to be more accurate, you can update it with the new events that might be found. - Page 71 Testing Fibers in Template Mode (optional) Acquiring Traces in Template Mode 3. Set test parameters. 3a. From the button bar, press OTDR Setup. 3b. Select the Create Ref./Template tab. If necessary, select Create reference trace to update your reference trace for the next acquisitions. This mode will use the first 15 traces (or less, if you stop the process manually) to continue compiling events.
- Page 72 Testing Fibers in Template Mode (optional) Acquiring Traces in Template Mode MPORTANT Once the first 15 acquisitions have been performed, or if you stop the reference update manually, the only way to reactivate it will be to close the application and start a new acquisition in Template mode.
- Page 73 Testing Fibers in Template Mode (optional) Acquiring Traces in Template Mode 4. If applicable, the application will display the number of new events detected for each wavelength. 4a. Press OK to close the dialog box. Note: You can only add events to the reference trace during reference update. Note: If you chose the Keep all events feature for the acquisitions that will be performed after the update, you may find it useful to add newly detected events to obtain a more accurate reference trace.
- Page 74 Testing Fibers in Template Mode (optional) Acquiring Traces in Template Mode 5. Question marks will appear in the Event table to identify new events not found on the reference trace. If you want to add these marked events to the reference trace, press Add to Ref. You can also delete unwanted events with the Delete button.
- Page 75 Testing Fibers in Template Mode (optional) Acquiring Traces in Template Mode 5a. Once the analysis is complete, save the trace by pressing Quick Save in the button bar. The application will use a file name based on the autonaming parameters you defined (see Naming Trace Files Automatically on page 20).
- Page 76 Testing Fibers in Template Mode (optional) Acquiring Traces in Template Mode 6. Once the reference update is complete (or if you did not select the reference update), the application automatically switches to Template mode. New events will be managed according to the option you selected at step 3c.
- Page 77 Testing Fibers in Template Mode (optional) Acquiring Traces in Template Mode 6c. Once the analysis is complete, save the trace by pressing Quick Save in the button bar. The application will use a file name based on the autonaming parameters you defined (see Naming Trace Files Automatically on page 20).
-
Page 78: Selecting A Reference Trace
Testing Fibers in Template Mode (optional) Selecting a Reference Trace Selecting a Reference Trace In Template OTDR mode, you can only select a file as a reference trace. This operation is closely related to opening a trace file. All the traces, will be displayed using the zoom and markers settings saved along with the reference trace file (see Opening Trace Files on page 155). -
Page 79: Testing Fibers In Fault Finder Mode
Testing Fibers in Fault Finder Mode The application offers you a special testing feature to rapidly locate fiber ends. It also displays the length of the fiber under test. This could be useful if you want to perform a quick test without having to set all the acquisition parameters. - Page 80 Testing Fibers in Fault Finder Mode Acquiring Traces in Fault Finder Mode 3. From the Port list, specify to which port you connected your fiber . 4. Press Start or from the keypad. If the first connector check feature is enabled, a message will appear if there is a problem with the injection level (see Enabling or Disabling the First Connector Check for Fault Finder on page 79).
- Page 81 Testing Fibers in Fault Finder Mode Acquiring Traces in Fault Finder Mode 5. Once the analysis is complete, save the trace by pressing Quick Save in the button bar. The application will use a file name based on the autonaming parameters you defined (see Naming Fault Finder Files Automatically on page 72).
-
Page 82: Naming Fault Finder Files Automatically
Testing Fibers in Fault Finder Mode Naming Fault Finder Files Automatically Naming Fault Finder Files Automatically Each time you start an acquisition, the Fault Finder application suggests a file name based on autonaming settings. This file name appears on the upper part of the graph. - Page 83 Testing Fibers in Fault Finder Mode Naming Fault Finder Files Automatically To configure the automatic file naming: 1. From the button bar, press Setup. 2. From the Setup window, select the General tab then press the File Autonaming button. 3. From the Autonaming Setup dialog box, set the parameters. Static part Variable part (incremented) The value appearing in this box will be used in...
-
Page 84: Selecting The Default File Format For The Fault Finder Traces
Testing Fibers in Fault Finder Mode Selecting the Default File Format for the Fault Finder Traces Selecting the Default File Format for the Fault Finder Traces You can define the default file format the Fault Finder application will use when you save your traces. Note: The default file format used in Fault Finder mode are independent from the file format used in Auto, Advanced or Template modes. - Page 85 Testing Fibers in Fault Finder Mode Selecting the Default File Format for the Fault Finder Traces To select the default file format: 1. From the button bar, press Quick Save. 2. From the Save File dialog box, select the desired format. 3.
-
Page 86: Enabling Or Disabling The Confirmation Of Fault Finder File Name
Testing Fibers in Fault Finder Mode Enabling or Disabling the Confirmation of Fault Finder File Name Enabling or Disabling the Confirmation of Fault Finder File Name By default, each time you save a file, the application prompts you to confirm the file name. Note: The file name confirmation parameter used in Fault Finder mode is independent from the one used in the other OTDR modes (Auto, Advanced and Template). - Page 87 Testing Fibers in Fault Finder Mode Enabling or Disabling the Confirmation of Fault Finder File Name To enable or disable file name confirmation: 1. From the button bar, press Setup, then go to the General tab. 2. If you want to confirm file name each time you press Quick Save, select the Always show confirmation window on save check box.
-
Page 88: Enabling Or Disabling The Storage Feature
Testing Fibers in Fault Finder Mode Enabling or Disabling the Storage Feature Enabling or Disabling the Storage Feature By default, the Quick Save button is displayed in the button bar. However, if you only want to perform quick tests without having to save the results, you may prefer to hide the Quick Save button. -
Page 89: Enabling Or Disabling The First Connector Check For Fault Finder
Testing Fibers in Fault Finder Mode Enabling or Disabling the First Connector Check for Fault Finder Enabling or Disabling the First Connector Check for Fault Finder The first connector check feature is used to verify that the fibers are properly connected to the OTDR. It verifies the injection level and displays a message when a unusually high loss occurs at the first connection, which could indicate that no fiber is connected to the OTDR port. - Page 90 Testing Fibers in Fault Finder Mode Enabling or Disabling the First Connector Check for Fault Finder To enable or disable the first connector check: 1. From the button bar, press Setup then select the General tab. 2. To enable the first connector check, select the First connector check check box.
-
Page 91: Enabling Or Disabling The Touchscreen Keyboard
Testing Fibers in Fault Finder Mode Enabling or Disabling the Touchscreen Keyboard Enabling or Disabling the Touchscreen Keyboard With the touchscreen keyboard, you can enter data without having to use an external keyboard. By default, this feature is enabled. When you select a text or number box, the touchscreen keyboard or keypad appears automatically. -
Page 92: Setting Trace Display Parameters
Testing Fibers in Fault Finder Mode Setting Trace Display Parameters Setting Trace Display Parameters You can change several trace display parameters: the grid: You can display or hide the grid appearing on the graph’s background. By default, the grid is displayed. the file name in the trace display: The file name appears at the top of the trace display. - Page 93 Testing Fibers in Fault Finder Mode Setting Trace Display Parameters To set the trace display parameters: 1. From the button bar, press the Setup button, then select the General tab. 2. Select the check boxes corresponding to the item you want to display on the graph.
-
Page 94: Selecting The Distance Units
Testing Fibers in Fault Finder Mode Selecting the Distance Units Selecting the Distance Units You can select the distance units that will be used in the application. The default distance units are the kilometers. Units used Note: The distance units used in Fault Finder mode are independent from the ones used in the other OTDR modes (Auto, Advanced and Template). - Page 95 Testing Fibers in Fault Finder Mode Selecting the Distance Units To select the distance units for your display: 1. From the button bar, select Setup. 2. From the Setup window, select the General tab. 3. From the Distance units list, select the item corresponding to the desired units.
-
Page 97: Customizing Your Otdr
Customizing Your OTDR You can customize the appearance and behavior of your OTDR application. Selecting the Default File Format You can define the default file format the application will use when you save your traces. By default, traces are saved in native (.trc) format, but you can configure your unit to save them in Bellcore (.sor) format. -
Page 98: Enabling Or Disabling File Name Confirmation
Customizing Your OTDR Enabling or Disabling File Name Confirmation To select the default file format: 1. From the Main Menu window, press Quick Save. 2. From the Save File dialog box, select the desired format. 3. Press OK to save your file in the new format. The next files will be saved in the new format. - Page 99 Customizing Your OTDR Enabling or Disabling File Name Confirmation To enable or disable file name confirmation: 1. From the Main Menu window, press OTDR Setup, then select the General tab. 2. If you want to confirm file name each time you press Quick Save, select the Always show confirmation window on save check box.
-
Page 100: Selecting The Distance Units
Customizing Your OTDR Selecting the Distance Units Selecting the Distance Units You can select the measurement units that will be used throughout the application, except for certain values such as the pulse and the wavelength. Pulse values are expressed in seconds and wavelength in meters (nanometers). - Page 101 Customizing Your OTDR Selecting the Distance Units To select the distance units for your display: 1. From the button bar, press OTDR Setup. 2. From the OTDR Setup window, select the General tab. 3. From the Distance units list, select the item corresponding to the desired distance units.
-
Page 102: Customizing The Acquisition Distance Range Values
Customizing Your OTDR Customizing the Acquisition Distance Range Values Customizing the Acquisition Distance Range Values Note: This function is available in Advanced mode only. You can customize the values associated with the Distance dial. Once the customization is complete, you are ready to set the distance range value for your test. - Page 103 Customizing Your OTDR Customizing the Acquisition Distance Range Values To customize the distance range values: 1. From the button bar, select OTDR Setup, then the Acquisition tab. 2. Press the Custom Acquisition Parameters button. 3. If your OTDR supports singlemode or filtered wavelengths, specify the desired fiber type.
-
Page 104: Customizing The Acquisition Time Values
Customizing Your OTDR Customizing the Acquisition Time Values Customizing the Acquisition Time Values Note: This function is available in Advanced mode only. You can customize the values associated with the Time dial. The acquisition time values represent the time during which the OTDR will average acquisitions. - Page 105 Customizing Your OTDR Customizing the Acquisition Time Values To customize the acquisition time values: 1. From the button bar, select OTDR Setup, then the Acquisition tab. 2. Press the Custom Acquisition Parameters button. 3. From the Time list, select the value you want to modify (the value will become highlighted), then press the Edit button.
-
Page 106: Enabling Or Disabling The Touchscreen Keyboard
Customizing Your OTDR Enabling or Disabling the Touchscreen Keyboard Enabling or Disabling the Touchscreen Keyboard With the touchscreen keyboard, you can enter data without having to use an external keyboard. By default, this feature is enabled. When you select a text or number box, the touchscreen keyboard or keypad appears automatically. -
Page 107: Displaying Or Hiding The Optional Features
Customizing Your OTDR Displaying or Hiding the Optional Features Displaying or Hiding the Optional Features If you have not purchased the optional software package, since you cannot use the optional features, you may prefer to hide them (macrobend detection, linear view). Note: You cannot hide the optional features if you purchased the software package. -
Page 109: 10 Analyzing Traces And Events
10 Analyzing Traces and Events Once the acquired trace is analyzed, it appears in the trace display and the events are displayed in the events table at the bottom of the screen.The trace display and events table are explained in the following sections. You can also reanalyze existing traces. -
Page 110: Graph View
Analyzing Traces and Events Graph View Graph View The events, that are detailed in the events table (see Events Tab on page 106), are marked by numbers along the displayed trace. Default injection level Event no. 4 Distance units Events table Some items in the trace display are always visible, while others will appear only if you choose to display them. - Page 111 Analyzing Traces and Events Graph View You can change trace display parameters (such as the grid and zoom window display). For more information, see Setting Trace Display Parameters on page 120. You can view all of the traces, in turn, in both the Trace Info pane and the trace display with the navigation buttons.
-
Page 112: Linear View
Analyzing Traces and Events Linear View Linear View Note: This function is available with the optional Auto Diagnostic (AD) software package only. In the linear view, the events are displayed sequentially, from left to right. Event Fiber section Each bubble represents an event. Each horizontal line that “links” two bubbles represents a fiber section. - Page 113 Analyzing Traces and Events Linear View You can view, in turn, the reference trace and the main trace using the Next Trace button. If you press a bubble or an horizontal line and hold for a few seconds, the application will display a tooltip identifying the item (for example, Reflective fault).
-
Page 114: Summary Table
Analyzing Traces and Events Summary Table Summary Table Note: This function is available both in Advanced and Auto modes. The summary table gives, for each wavelength, the global status of the results (pass: no results exceed the thresholds or fail: at least one result exceeds the thresholds), the span loss and span ORL values. - Page 115 Analyzing Traces and Events Summary Table Since the summary table shows the information for all the wavelengths of the main trace only, the Next Trace button is not available. The summary table cannot be displayed when the events table is empty or if the trace contains only a span start.
-
Page 116: Events Tab
Analyzing Traces and Events Events Tab To display the summary table: From the main window, press the button. Note: To display the summary table as the default view after the acquisitions are all performed (at all the selected wavelengths) and the analysis of the last wavelength is complete, see Selecting the Default View on page 113. - Page 117 Analyzing Traces and Events Events Tab The events table lists all the events detected on the fiber. An event can be defined as the point at which change in the transmission properties of light can be measured. Events can consist of losses due to transmission, splices, connectors or breaks.
- Page 118 Analyzing Traces and Events Events Tab Loc.: Location; that is, distance between the OTDR and the measured event or between the event and the beginning of the fiber span. Loss: Loss in dB for each event or fiber section (calculated by the application).
- Page 119 Analyzing Traces and Events Events Tab To quickly locate an event in the events table: 1. Ensure that the button is selected in the zoom button bar. 2. Select the event on the trace. The list scrolls automatically to the event you selected. Event no.
-
Page 120: Measure Tab
Analyzing Traces and Events Measure Tab Measure Tab The application shows two, three or four markers: a, A, B, and b, depending on the button you pressed under Results. These markers can be repositioned along the trace to calculate loss, attenuation, reflectance, and optical return loss (ORL). -
Page 121: Displaying The Graph In Full Screen
Analyzing Traces and Events Displaying the Graph in Full Screen Displaying the Graph in Full Screen You can display the graph in full screen at any time, even when an acquisition is underway. The graph will keep the same display options as in normal view (grid, file name, zoom window, inverted colors). - Page 122 Analyzing Traces and Events Displaying the Graph in Full Screen If you want to view a table of events once the acquisitions are complete, you must select the Events tab or activate the option to display the event table (from OTDR Setup) before switching to full-screen mode. Once all acquisitions are complete, the application will automatically switch to the defined default view (see Selecting the Default View on page 113).
-
Page 123: Selecting The Default View
Analyzing Traces and Events Selecting the Default View Selecting the Default View You can select which view will be displayed by default once all the acquisitions are performed (at all the selected wavelengths) and the analysis of the last wavelength is complete. The table below indicates in which OTDR modes (Auto, Advanced, Template) a particular view can be displayed. - Page 124 Analyzing Traces and Events Selecting the Default View OTDR modes View for which view Remarks is available Summary table Auto This table gives, for each wavelength, the pass/fail status of Advanced the results, the span loss and span ORL values. Span length is also displayed.
-
Page 125: Automatically Displaying The Event Table After Acquisitions
Analyzing Traces and Events Automatically Displaying the Event Table after Acquisitions Automatically Displaying the Event Table after Acquisitions You may want the application to automatically switch to the event table once all acquisitions are complete. This could be particularly useful when you work in full-screen mode (see Displaying the Graph in Full Screen on page 111) if you want to view the event table without having to go back in normal view mode. -
Page 126: Automatically Zooming In On The Fiber Span
Analyzing Traces and Events Automatically Zooming in on the Fiber Span Automatically Zooming in on the Fiber Span Note: This function is available both in Advanced and Template modes. You can set the trace display to show only the span start to the span end of the trace in full-trace view. -
Page 127: Using Zoom Controls
Analyzing Traces and Events Using Zoom Controls Using Zoom Controls Use the zoom controls to change the scale of the trace display. You can zoom in on or out of the graph using the corresponding buttons or let the application automatically adjust the zoom on the currently selected event from the events table (only available when the events window is displayed). - Page 128 Analyzing Traces and Events Using Zoom Controls When you manually zoom in or out on a trace, the application will apply the new zoom factor and marker positions to the other traces (wavelengths) of a same file and on the reference file, if applicable. Both the zoom factor and marker positions will be saved along with the trace (same settings for all wavelengths).
- Page 129 Analyzing Traces and Events Using Zoom Controls according to the zooming type you have selected. All of the other zoom buttons (except for the zoom on selected event button) will reflect your selection and behave accordingly. You can zoom in or out on the graph by first using, respectively, or the button, and then by pressing the location where you want to zoom on the graph with the stylus or your finger.
-
Page 130: Setting Trace Display Parameters
Analyzing Traces and Events Setting Trace Display Parameters Setting Trace Display Parameters Once you have launched the desired trace acquisition mode (Automatic, Advanced, or Template), you can change several trace display parameters: the grid: You can display or hide the grid appearing on the graph’s background. - Page 131 Analyzing Traces and Events Setting Trace Display Parameters To set the trace display parameters: 1. From the button bar, press the OTDR Setup button, then select the General tab. 2. Select the boxes corresponding to the item you want to display on the graph.
-
Page 132: Customizing The Event Table
Analyzing Traces and Events Customizing the Event Table Customizing the Event Table Note: This function is available both in Advanced and Auto modes. You can include or exclude items from the events table to better suit your needs. Note: Hiding the fiber sections will not delete these items. Fiber sections: You can display or hide fiber sections in the events table and in the linear view, depending on the types of values you want to display. - Page 133 Analyzing Traces and Events Customizing the Event Table To customize the events table appearance: 1. From the OTDR Setup window, select the Event Table tab. 2. Select the boxes corresponding to the item you want to display or include in the table. To hide them, clear the boxes.
-
Page 134: Displaying Or Hiding A Trace
Analyzing Traces and Events Displaying or Hiding a Trace Displaying or Hiding a Trace There are two ways of displaying or hiding traces in the OTDR test application. You can view, in turn, all the trace files you have opened, including main and reference traces, as well as multiwavelength traces. - Page 135 Analyzing Traces and Events Displaying or Hiding a Trace To specify which traces to display or hide: 1. From the button bar, press Storage. 2. Select the boxes corresponding to the traces to display. Clear the boxes to hide them. Note: A hidden trace cannot be displayed with the navigation button.
-
Page 136: Clearing Traces From The Display
Analyzing Traces and Events Clearing Traces from the Display Clearing Traces from the Display Note: This function is available in Advanced mode only. Note: Clearing traces from the display does not delete them from the disk. If a trace you acquired (main or reference) does not meet your requirements, you can clear that trace and start over. -
Page 137: Viewing And Modifying Current Trace Settings
Analyzing Traces and Events Viewing and Modifying Current Trace Settings Viewing and Modifying Current Trace Settings You can view the trace parameters and modify them at your convenience. Note: Parameter modification is only possible in Advanced mode. You can modify the index of refraction (IOR) also known as group index, Rayleigh backscatter (RBS) coefficient and helix factor for the displayed trace. - Page 138 Analyzing Traces and Events Viewing and Modifying Current Trace Settings To view trace settings: Go to the Trace Info. tab. Note: Even if more than one trace is available, the Trace Info. tab only shows one at a time. To display the traces in turn, press Next Trace in the toolbar. The active trace appears in black in the trace display.
- Page 139 Analyzing Traces and Events Viewing and Modifying Current Trace Settings Span ORL: ORL calculated either between the span start and the span end, or on the total fiber span, depending on the option you have selected in the Setup window. High resolution: High-resolution feature was selected to perform the acquisition.
- Page 140 Analyzing Traces and Events Viewing and Modifying Current Trace Settings To modify the IOR, RBS coefficient, and helix factor parameters: 1. From the main window, go to the Trace Info. tab. 2. Press the Fiber Settings button. 3. Enter the desired values for the current trace in the appropriate boxes. If you want to revert a particular item to its default value, press the Default button appearing next to this item.
- Page 141 Analyzing Traces and Events Viewing and Modifying Current Trace Settings If you already know the IOR value, you can enter it in the corresponding box. However, if you prefer to let the application calculate the IOR value as a function of the distance between span start and span end, press Set IOR by Distance, then enter the distance value.
-
Page 142: Modifying Events
Analyzing Traces and Events Modifying Events Modifying Events Note: This function is available in Advanced mode only. You can change the loss and reflectance of almost any existing event except: continuous fiber end of analysis launch level merged events span start span end In the case of a reflective event, you can also specify whether the event corresponds to an echo, a possible echo, or no echo. - Page 143 Analyzing Traces and Events Modifying Events To modify an event: 1. Select the event you want to modify. 2. Press the Change Event button. Markers a, A, B, and b appear on the graph. With these markers, you can define a new location for the selected event. You can reposition all markers directly by dragging them, or by pressing where you want to relocate them on the graph.
- Page 144 Analyzing Traces and Events Modifying Events 3. Position marker A on the event, and submarker a (to the left of marker A) as far as possible from marker A , without including the preceding event. The area between markers A and a must not include any significant variation.
- Page 145 Analyzing Traces and Events Modifying Events 5. If you selected a reflective event, you can modify the echo status using the up/down arrows of the Echo status list. Note: Select “- - -” if you want to indicate that the event is not an echo. 6.
-
Page 146: Inserting Events
Analyzing Traces and Events Inserting Events Inserting Events You can insert events in the event table manually. This could be useful, for example, if you know that there is a splice at a given location, but the analysis does not detect it because it is hidden in the noise or because the splice loss is lower than the minimum detection threshold (see Setting Pass/Fail Thresholds on page 47). - Page 147 Analyzing Traces and Events Inserting Events 2. Select the location where you want to insert an event. Four markers are available to measure the inserted event, but only marker A identifies where the event will be inserted. Use the marker arrows to move marker A on the trace display.
-
Page 148: Deleting Events
Analyzing Traces and Events Deleting Events Deleting Events Note: This function is available in Advanced mode only. Almost any event can be deleted from the events table, except: end of analysis fiber section launch level end of fiber span start span end Note: The “End-of-fiber”... - Page 149 Analyzing Traces and Events Deleting Events To delete an event: 1. Select the event you want to delete. 2. Press Delete. 3. When the application prompts you, press Yes to confirm the deletion, or No to keep the event. OTDR...
-
Page 150: Managing Comments
Analyzing Traces and Events Managing Comments Managing Comments Note: This function is available in Advanced mode only. You can insert comments manually on a specific event and you can also delete them. A red triangle on the event indicates that a comment has been added. - Page 151 Analyzing Traces and Events Managing Comments To delete a comment: 1. Select the event on which you want to delete a comment. 2. From the Events tab, press Edit Comments. 3. From the Edit Comments dialog box, delete the text. 4.
-
Page 152: Changing The Attenuation Of Fiber Sections
Analyzing Traces and Events Changing the Attenuation of Fiber Sections Changing the Attenuation of Fiber Sections Note: This function is available in Advanced mode only. You can change the attenuation value of fiber sections. MPORTANT If you reanalyze a trace, all of the modifications made to the fiber sections will be lost and the events table will be re-created. - Page 153 Analyzing Traces and Events Changing the Attenuation of Fiber Sections 3. Position markers as desired to modify the attenuation value. For more information on positioning markers, see Using Markers on page 161. Note: The markers serve only to set the new attenuation value. Their actual locations will not be modified.
-
Page 154: Setting The Analysis Detection Thresholds
Analyzing Traces and Events Setting the Analysis Detection Thresholds Setting the Analysis Detection Thresholds Note: This function is available in Advanced mode only. To optimize event detection, you can set the following analysis detection thresholds: Splice loss threshold: To display or hide small non-reflective events. Reflectance threshold: To hide false reflective events generated by noise, transform non-harmful reflective events into loss events, or detect reflective events that could be harmful to network and other... - Page 155 Analyzing Traces and Events Setting the Analysis Detection Thresholds The following examples show how different splice-loss threshold levels can affect the number of displayed events, especially small non-reflective events such as those caused by two splices. Three traces are shown, corresponding to three threshold level settings.
- Page 156 Analyzing Traces and Events Setting the Analysis Detection Thresholds To set the analysis detection thresholds: 1. From the button bar, press OTDR Setup. 2. From the OTDR Setup dialog box, select the Analysis tab. 3. Under Analysis parameters, set the parameters. Enter the desired values in the appropriate boxes.
-
Page 157: Analyzing Or Reanalyzing A Trace
Analyzing Traces and Events Analyzing or Reanalyzing a Trace Analyzing or Reanalyzing a Trace Note: This function is available in Advanced mode only. You can analyze a displayed trace at any time. Analyzing or reanalyzing a trace will: produce an events table for a trace, if there was none (for example, the Automatically Analyze Data after Acquisition feature was not selected;... - Page 158 Analyzing Traces and Events Analyzing or Reanalyzing a Trace To analyze or reanalyze a trace: 1. From the main window, go to the Events tab. 2. Press the Analyze button. 3. From the Reanalyze Trace dialog box, select an item for setting the span start and end markers on the trace.
-
Page 159: Analyzing The Fiber On A Specific Fiber Span
Analyzing Traces and Events Analyzing the Fiber on a Specific Fiber Span Analyzing the Fiber on a Specific Fiber Span Note: This function is available in Advanced mode only. If you want to focus your fiber analysis on a specific fiber span, you can define events (new or existing) as a span start and/or span end. -
Page 160: Enabling Or Disabling The Detection Of Reflective Ends Of Fiber
Analyzing Traces and Events Enabling or Disabling the Detection of Reflective Ends of Fiber Enabling or Disabling the Detection of Reflective Ends of Fiber By default, the application stops the analysis as soon as there is too much noise on a trace to ensure accurate measurements. However, you can configure the application to search the “noisy”... - Page 161 Analyzing Traces and Events Enabling or Disabling the Detection of Reflective Ends of Fiber The table below shows the differences you will notice in the event table depending on if you enable the detection of reflective ends of fiber or not. Option not selected Option selected (conventional analysis)
- Page 162 Analyzing Traces and Events Enabling or Disabling the Detection of Reflective Ends of Fiber MPORTANT The analysis will stop as soon as the loss of an event crosses the end-of-fiber (EoF) threshold. The application will mark the event as an end-of-fiber event. In this case, even if you selected the option, the application will not search the “noisy”...
- Page 163 Analyzing Traces and Events Enabling or Disabling the Detection of Reflective Ends of Fiber 3. If you want to enable the option, under End-of-Fiber parameters, select the Reflective end-of-fiber detection box. If you prefer to disable the option, clear the box. 4.
-
Page 164: Swapping Traces
Analyzing Traces and Events Swapping Traces Swapping Traces Note: This function is available in Advanced mode only. Since the events table and the trace information are based on the main trace, you may want to interchange main and reference traces. When you swap traces, the application will provide a new set of events corresponding to the new main trace. -
Page 165: Opening Trace Files
Analyzing Traces and Events Opening Trace Files Opening Trace Files In Advanced mode, you can open a trace file as the main trace or the reference trace. You can open both the main and reference trace files at the same time. You can open two multiple wavelength trace files simultaneously, each containing several traces. - Page 166 Analyzing Traces and Events Opening Trace Files The table below presents the possible behavior of the zoom and markers when you open traces (main or reference). If you open old OTDR traces, see the corresponding row for more information. Type of file Zoom Marker Trace that has been saved with an...
- Page 167 As soon as a reference trace is open, the application will apply the zoom and marker settings of the reference file to all traces (main and reference). For detailed information on compatibility between EXFO’s file formats and software versions, see OTDR Trace File Compatibility on page 174.
- Page 168 Analyzing Traces and Events Opening Trace Files To open a trace file: 1. From the button bar, press Storage, then Open File. Available in Advanced mode 2. If necessary, change the location to retrieve the file that was stored. 3. Scroll through the list of files and select a trace file to open. 4.
-
Page 169: Analyzing The Results Manually
11 Analyzing the Results Manually Once a trace has been acquired or opened, you can use markers and zoom in on or out of any event or trace segment to measure splice loss, fiber section attenuation, reflectance, and optical return loss. Selecting the Attenuation and Loss Values that Will Be Displayed By default, in the Measure tab, the application only displays the values... - Page 170 Analyzing the Results Manually Selecting the Attenuation and Loss Values that Will Be Displayed To select the attenuation and loss values that will be displayed: 1. From the button bar, press OTDR Setup then go to the General tab. 2. Press the Measurement Method button. 3.
-
Page 171: Using Markers
Analyzing the Results Manually Using Markers Using Markers You can use markers to view the position and relative power of an event. Markers are available from the Events tab (when you modify or add an event) or the Measure tab in the main window. To move a marker: 1. -
Page 172: Getting Event Distances And Relative Powers
Analyzing the Results Manually Getting Event Distances and Relative Powers Getting Event Distances and Relative Powers The OTDR test application automatically calculates the position of an event and displays this distance in the events table. You can retrieve the position of an event as well as the distance between events manually. -
Page 173: Getting Event Loss (Four-Point And Least-Square Approximation)
Analyzing the Results Manually Getting Event Loss (Four-Point and Least-Square Approximation) Getting Event Loss (Four-Point and Least-Square Approximation) Event loss (expressed in dB) is calculated by measuring the signal level reduction in Rayleigh backscatter (RBS) caused by this event. Event loss can result from both reflective and non-reflective events. - Page 174 Analyzing the Results Manually Getting Event Loss (Four-Point and Least-Square Approximation) Four-point event loss: the LSA method is used to fit a straight line to the backscatter data within the two regions defined by markers a, A and b, B, that is over the regions to the left and to the right of the event bordered by markers A and B, respectively.
- Page 175 Analyzing the Results Manually Getting Event Loss (Four-Point and Least-Square Approximation) A-B LSA loss: the loss of the event bordered by the markers A and B is obtained by fitting a straight line to the backscatter data between these two markers. A-B LSA loss The event is then obtained by the reduction in power (dB) over the distance between the two markers, as calculated from the slope of the...
- Page 176 Analyzing the Results Manually Getting Event Loss (Four-Point and Least-Square Approximation) To get event loss: 1. From the main window, select the Measure tab. 2. In the Results section, press Loss. Markers a, A, B and b appear on the graph.
- Page 177 Analyzing the Results Manually Getting Event Loss (Four-Point and Least-Square Approximation) 5. Position marker B at the beginning of the linear area following the event to be measured. 6. Position submarker b at the end of the linear area following the event to be measured (must not include any significant events).
-
Page 178: Getting Attenuation (Two-Point And Least-Square Approximation)
Analyzing the Results Manually Getting Attenuation (Two-Point and Least-Square Approximation) Getting Attenuation (Two-Point and Least-Square Approximation) A two-point attenuation measurement gives the reduction in Rayleigh backscatter level as a function of distance (always expressed in dB/km to follow the standards of the fiber-optic industry) between two selected points. - Page 179 Analyzing the Results Manually Getting Attenuation (Two-Point and Least-Square Approximation) To get attenuation: From the main window, select the Measure tab. 2. In the Results section, press the Att. button. Markers A and B appear on the graph. 3. Place markers A and B at any two points on the trace. For more information, see Using Markers on page 161.
-
Page 180: Getting Reflectance
Analyzing the Results Manually Getting Reflectance Getting Reflectance Reflectance is the ratio of reflected light to input light. Note: If you are testing in Real time, the reflectance value you will get is not necessarily accurate. To get reflectance: 1. From the main window, select the Measure tab. 2. -
Page 181: Getting Optical Return Loss (Orl)
Analyzing the Results Manually Getting Optical Return Loss (ORL) Getting Optical Return Loss (ORL) Note: You must use a singlemode OTDR for ORL calculations. The ORL calculation will provide the following information: the ORL between markers A and B the total ORL is calculated either between the span start and the span end, or on the total fiber span, depending on the option you have selected in the Setup window. -
Page 183: Managing Trace Files From The Otdr Test Application
12 Managing Trace Files from the OTDR Test Application Once you have acquired traces, or when you want to work with them after an acquisition, you will need to save, open, rename, and delete trace files. You can save and open trace files from the OTDR test application. To rename, copy, move, and delete trace files, you must use the File Manager utility. -
Page 184: Otdr Trace File Compatibility
Managing Trace Files from the OTDR Test Application OTDR Trace File Compatibility OTDR Trace File Compatibility The table presented hereafter shows the compatibility between the format of a specific trace and the software that you may use to open that trace. Symbols used in the table Meaning Fully compatible... - Page 185 Managing Trace Files from the OTDR Test Application OTDR Trace File Compatibility Software used to open the file... ToolBox ToolBox ToolBox ToolBox FTB-100 FTB-100 FTB-100 6.5 or 6.7 to 6.21 or 2.5 or 2.6 or 2.7 2.8 or earlier 6.20 later earlier later/...
-
Page 186: Copying, Moving, Renaming, Or Deleting Trace Files
Managing Trace Files from the OTDR Test Application Copying, Moving, Renaming, or Deleting Trace Files Copying, Moving, Renaming, or Deleting Trace Files If you want to copy, move, rename or delete trace files, you will have to process the files manually via File Manager available from Mini ToolBox. For more information, refer to your unit help. -
Page 187: Creating And Generating Reports
13 Creating and Generating Reports For future reference, you can add notes on the location of the tested fiber, type of job performed and general comments related to a trace in trace reports. Adding Information to the Test Results After acquiring a trace, you might want to include or update information about the tested fiber and job or add comments. - Page 188 Creating and Generating Reports Adding Information to the Test Results To add information to the test results: 1. From the button bar, once a trace has been acquired or reopened, press Identification. 2. Enter the desired information. Note: The information in the Date, Time, Unit and Serial no. boxes is provided by the application and cannot be edited.
-
Page 189: Generating A Report
Creating and Generating Reports Generating a Report To clear all the information from the Identification window: Press the Clear All button. Note: The information appearing in the Date, Time, Unit, and Serial no. boxes cannot be deleted. Generating a Report You can generate trace reports directly from your unit in HTML format. - Page 190 Creating and Generating Reports Generating a Report The following table shows the various items that can appear on a report, depending on the test mode (Auto, Advanced or Template) that is selected. Auto Advanced Template Item appearing on the report mode mode mode...
- Page 191 Creating and Generating Reports Generating a Report Auto Advanced Template Item appearing on the report mode mode mode Job information: test date and time (including the time zone), job ID and customer, operator A and Operator B, filename, and company. By default, this item is selected.
- Page 192 Creating and Generating Reports Generating a Report Auto Advanced Template Item appearing on the report mode mode mode Pass/Fail thresholds: loss, reflectance, fiber section attenuation thresholds as they are defined in OTDR setup, under Event table. Note: Selecting this item will not highlight the failed results in the report.
- Page 193 Creating and Generating Reports Generating a Report To generate reports: 1. From the button bar, press Generate Report. 2. From the Report dialog box, select the report characteristics, including whether you want to include the graphs or not. Select the Include all traces item to generate a report for all traces (wavelengths) from the current file (available in Auto and Advanced modes only).
- Page 194 Creating and Generating Reports Generating a Report 5. From the Save As dialog box, select a folder or create one to save your file. 6. If desired, modify the file name. MPORTANT If you specify the name of an existing trace, the original file will be overwritten and only the new file will be available.
-
Page 195: Using The Otdr As A Light Source
14 Using the OTDR as a Light Source If you want to perform measurements with a power meter and your OTDR as a source, the OTDR port can transmit a special tone. This port can be used only to transmit—not detect that tone. AUTION Never connect a live fiber to the OTDR port without a proper setup. - Page 196 Using the OTDR as a Light Source To use your OTDR as a source: 1. Clean the connectors properly (see Cleaning and Connecting Optical Fibers on page 18). 2. Connect one end of the fiber under test to the OTDR port. If your unit is equipped with two OTDR ports, ensure that you connect the fiber to the appropriate port (singlemode, singlemode live, or multimode), depending on the wavelength you intend to use.
- Page 197 6. Under Source, press Turn ON. You can stop light emission at any time by pressing Turn OFF. Using an EXFO power meter with tone-detection features, such as the FOT-930 or FPM-300, an operator at the other end will be able to quickly locate the correct fiber or perform loss measurements.
-
Page 199: Analyzing Traces With The Bidirectional Analysis Application (Optional)
15 Analyzing Traces with the Bidirectional Analysis Application (Optional) Note: This function is available with the optional Event Characterization (EC) software package only. Note: The OTDR Bidirectional application is available from the Utilities tab in Mini ToolBox. The OTDR Bidirectional application helps you to perform a bidirectional analysis on two unidirectional OTDR traces. - Page 200 Analyzing Traces with the Bidirectional Analysis Application (Optional) Bidirectional analysis is the recommended method for splice loss measurements on singlemode fibers by the Telecommunications Industry Association (test procedure EIA/TIA FOTP-61 Measurement of Fiber or Cable Attenuation Using an OTDR). This method removes the so-called “gainers” (increase in the optical power) and exaggerated losses and provides accurate measurements.
-
Page 201: Starting And Exiting The Bidirectional Analysis Application
Analyzing Traces with the Bidirectional Analysis Application (Optional) Starting and Exiting the Bidirectional Analysis Application Starting and Exiting the Bidirectional Analysis Application The bidirectional analysis application is available from your unit. To start the Bidirectional Analysis application: 1. From Mini ToolBox, go to the Utilities tab. 2. - Page 202 Analyzing Traces with the Bidirectional Analysis Application (Optional) Starting and Exiting the Bidirectional Analysis Application The main window is displayed. To create, open, or save bidirectional measurement files. To create reports in .html format, or to export A->B and B->A traces (in .trc format). To define display settings, thresholds and to configure options related to spans.
-
Page 203: Creating Bidirectional Measurement Files
Analyzing Traces with the Bidirectional Analysis Application (Optional) Creating Bidirectional Measurement Files Creating Bidirectional Measurement Files To work with the OTDR Bidirectional application, you must acquire and save the traces (in the OTDR application) before opening them with the bidirectional analysis application. You can open unidirectional trace files to combine them into a bidirectional measurement file. - Page 204 Trace Both must be unidirectional files (.trc or .sor files). Only traces of native format or of Telcordia (Bellcore) EXFO version 200 format can be reanalyzed and be used to generate the bidirectional measurement. You can open traces of Telcordia (Bellcore) non-EXFO version 200 format, but you cannot reanalyze them.
- Page 205 Analyzing Traces with the Bidirectional Analysis Application (Optional) Creating Bidirectional Measurement Files When two traces are opened in the bidirectional analysis application, the span end of the B->A trace is aligned with the span start of the A->B trace. If the application cannot match the traces perfectly, error or warning messages will appear.
- Page 206 Analyzing Traces with the Bidirectional Analysis Application (Optional) Creating Bidirectional Measurement Files To create a bidirectional measurement file: 1. From the Main Menu, select File > Create. 2. Select the files to open. 2a. Press the Browse button, on the right of the A ->B file path box. 2b.
-
Page 207: Opening Existing Bidirectional Measurement Files
Analyzing Traces with the Bidirectional Analysis Application (Optional) Opening Existing Bidirectional Measurement Files Opening Existing Bidirectional Measurement Files You can open bidirectional measurement files to view results or to reanalyze them. When you open a bidirectional file, you will recover all the data of the unidirectional traces and the bidirectional measurement (one wavelength per bidirectional file). -
Page 208: Displaying Traces And Bidirectional Measurement
Analyzing Traces with the Bidirectional Analysis Application (Optional) Displaying Traces and Bidirectional Measurement Displaying Traces and Bidirectional Measurement You can view, in turn, the bidirectional measurement as well as the unidirectional trace files. When you create a bidirectional measurement using multiwavelength files, you can also navigate through the different wavelengths. - Page 209 Analyzing Traces with the Bidirectional Analysis Application (Optional) Displaying Traces and Bidirectional Measurement To switch from one wavelength to another: From the main window, use the buttons. To switch from one wavelength to another (available only when A->B and B->A traces contain multiple wavelengths).
-
Page 210: Viewing Results
Analyzing Traces with the Bidirectional Analysis Application (Optional) Viewing Results Viewing Results The application shows the results of the A->B and B->A traces according to the thresholds defined in the Bidirectional OTDR application. You can view the corresponding graphs (see Graph View on page 201) and tables of events (see Events Tab on page 204), as well as obtain more information about the status of the bidirectional measurement and/or A->B and B->A traces (see Summary Table). - Page 211 Analyzing Traces with the Bidirectional Analysis Application (Optional) Viewing Results Graph View The application shows the results both on a graph and in a table. The events, that are detailed in the events table (see Events Tab on page 204), are marked by numbers along the displayed trace.
- Page 212 Analyzing Traces with the Bidirectional Analysis Application (Optional) Viewing Results Summary Table The summary table gives, for each wavelength and at each direction, the status of the results (pass: no results exceed the thresholds, or fail: at least one result exceeds the thresholds) and the span loss values. A global status for the bidirectional measurement is also available.
- Page 213 Analyzing Traces with the Bidirectional Analysis Application (Optional) Viewing Results When you select an element from the summary table (or if you switch to another wavelength or direction), the graph, as well as the contents of the Events and Trace Info. tabs are updated accordingly. In the summary table, when you select an element having a “fail”...
- Page 214 Analyzing Traces with the Bidirectional Analysis Application (Optional) Viewing Results Events Tab You can view information about all detected events on a trace and fiber sections by scrolling through the events table. In graph view, when you select an event in the events table, marker A appears on the trace over the selected event.
- Page 215 Analyzing Traces with the Bidirectional Analysis Application (Optional) Viewing Results For each item listed in the events table, information is displayed. The information vary depending on the direction that is selected. Bidirectional Event type detected measurement (see Description of Event Types on page 289) Event number Position: distance between the OTDR and the measured event, or between the event and the beginning of the fiber span...
- Page 216 Analyzing Traces with the Bidirectional Analysis Application (Optional) Viewing Results Event type detected (see Description of Event Types on page 289) Unidirectional traces Event number Position: distance between the OTDR and the measured event, or between the event and the beginning of the fiber span Length of a fiber section (distance between two events).
- Page 217 Analyzing Traces with the Bidirectional Analysis Application (Optional) Viewing Results To quickly locate an event in the events table: 1. Ensure that the button is selected in the zoom button bar. 2. Select the event on the trace. The list scrolls automatically to the event you selected. Graph Zoom-on- Event no.
- Page 218 Analyzing Traces with the Bidirectional Analysis Application (Optional) Viewing Results Trace Info. Tab You can view information about the bidirectional measurement as well as the A->B and B->A traces (see Displaying Traces and Bidirectional Measurement on page 198). However, you can only modify the analysis settings for the current A->B and B->A traces, not for the bidirectional measurement (see Modifying Trace Analysis Settings on page 248).
- Page 219 Analyzing Traces with the Bidirectional Analysis Application (Optional) Viewing Results The following information is available: Pulse: Pulse width used to perform the acquisition. Span length: Measured length of the total fiber span (between span start and span end). Span loss: Total measured loss of the fiber calculated either between the span start and the span end, or on the total fiber span, depending on the settings you have chosen in the setup window.
- Page 220 Analyzing Traces with the Bidirectional Analysis Application (Optional) Viewing Results Information specific to the A->B or B->A trace is also displayed: Range: Acquisition range. Duration: Duration of the acquisition. Span ORL: ORL calculated either between the span start and the span end, or on the total fiber span, depending on the option you have selected in the Setup window.
-
Page 221: Reanalyzing Traces And Regenerating The Bidirectional Measurement
Analyzing Traces with the Bidirectional Analysis Application (Optional) Reanalyzing Traces and Regenerating the Bidirectional Measurement Reanalyzing Traces and Regenerating the Bidirectional Measurement You can analyze the A->B and B->A traces and regenerate the bidirectional measurement at any time. Reanalyzing a trace will: re-create the events table if it was modified. - Page 222 Analyzing Traces with the Bidirectional Analysis Application (Optional) Reanalyzing Traces and Regenerating the Bidirectional Measurement To reanalyze traces and regenerate bidirectional measurement: 1. From the main window, select the Edit tab. 2. Under Direction, select the desired option, depending on which trace you want to reanalyze.
-
Page 223: Modifying The Alignment Of Unidirectional Traces
Analyzing Traces with the Bidirectional Analysis Application (Optional) Modifying the Alignment of Unidirectional Traces Modifying the Alignment of Unidirectional Traces When two unidirectional traces are opened in the bidirectional analysis application, the span end of the B->A trace is aligned with the span start of the A->B trace. - Page 224 Analyzing Traces with the Bidirectional Analysis Application (Optional) Modifying the Alignment of Unidirectional Traces You can even set the span end after the detected end of fiber. This could be useful if you suspect problems in this section of the trace or if the actual end of fiber seems to be located in the noise (peak detected at the end of the fiber span).
- Page 225 Analyzing Traces with the Bidirectional Analysis Application (Optional) Modifying the Alignment of Unidirectional Traces To modify the alignment of A->B or B->A trace: 1. From the main window, select the Alignment tab. 2. Under Direction, select A->B or B->A. 3. Define the span event location by moving marker A along the trace using one of the following methods: Drag marker A to the desired span event location.
- Page 226 Analyzing Traces with the Bidirectional Analysis Application (Optional) Modifying the Alignment of Unidirectional Traces 4. Press Set as Span Start or Set as Span End to set the span start or span end marker on the appropriate event in the trace display. MPORTANT To keep a set fiber span during trace reanalysis, activate the corresponding option (see Saving the Span-Start and Span-End...
-
Page 227: Using Zoom Controls
Analyzing Traces with the Bidirectional Analysis Application (Optional) Using Zoom Controls Using Zoom Controls You can use the zoom controls to change the scale of the trace display. You can zoom in on or out of the graph using the corresponding buttons or let the application automatically adjust the zoom on the currently selected event from the events table. - Page 228 Analyzing Traces with the Bidirectional Analysis Application (Optional) Using Zoom Controls When you zoom in or out on an event, the application keeps the zoom on this event until you select another event or change the zoom position. In the case of a multiwavelength file, you can select a different event for each wavelength (for example, event 2 at 1550 nm and event 5 at 1625 nm).
- Page 229 Analyzing Traces with the Bidirectional Analysis Application (Optional) Using Zoom Controls To view specific portions of the graph: You can define which portion of the graph will be visible by selecting button and dragging the graph with the stylus or your finger. This could be useful, for example, if you want to zoom in on events located outside the defined fiber span.
- Page 230 Analyzing Traces with the Bidirectional Analysis Application (Optional) Using Zoom Controls To automatically zoom in on the selected event: 1. From the main window, select the Graph tab. 2. Select the Events tab. 3. Under Direction, select the desired option. 4.
-
Page 231: Using Markers To Edit Events
Analyzing Traces with the Bidirectional Analysis Application (Optional) Using Markers to Edit Events Using Markers to Edit Events You can use markers to define or modify the position of an event on the A->B or B->A trace. Markers are available when you modify or add an event. If two markers are located at the same place, both will move together. - Page 232 Analyzing Traces with the Bidirectional Analysis Application (Optional) Using Markers to Edit Events 3. Once the appropriate markers are selected, use one of the following methods to move them along the trace: Drag markers to the desired location directly on the graph using the stylus or your finger.
-
Page 233: Inserting Events
Analyzing Traces with the Bidirectional Analysis Application (Optional) Inserting Events Inserting Events Note: You can only create events for the A->B or B->A trace (not for the bidirectional measurement). The application regenerates the bidirectional measurement automatically to take into account the modifications you have made. - Page 234 Analyzing Traces with the Bidirectional Analysis Application (Optional) Inserting Events To insert an event: 1. From the main window, select the Edit tab. 2. Under Direction, select either A->B or B->A. 3. If desired, you can select an item from the events table that is near the location where you want to insert an event.
- Page 235 Analyzing Traces with the Bidirectional Analysis Application (Optional) Inserting Events 5. Specify the exact location where you want to insert an event. Marker b Marker a Marker A Marker B Four markers are available to help you place the event, but only marker A identifies where the event will be inserted.
- Page 236 Analyzing Traces with the Bidirectional Analysis Application (Optional) Inserting Events 6. Once you have determined the location, from the Type list, select the desired event type. Loss and reflectance values Loss and reflectance are calculated automatically, based on the position of the markers. Reflectance values are only displayed for reflective event types (reflective, echo, and possible echo).
-
Page 237: Modifying Events
Analyzing Traces with the Bidirectional Analysis Application (Optional) Modifying Events Modifying Events Note: You can only modify the events of the A->B or B->A trace (not those of the bidirectional measurement). The application regenerates the bidirectional measurement automatically to take into account the modifications you have made. - Page 238 Analyzing Traces with the Bidirectional Analysis Application (Optional) Modifying Events To modify an event: 1. From the main window, select the Edit tab. 2. Under Direction, select either A->B or B->A. 3. Select the event you want to modify. Position of marker A 4.
- Page 239 Analyzing Traces with the Bidirectional Analysis Application (Optional) Modifying Events 5. If desired, specify a new location for the selected event. Note: You cannot select another event from the events table of the Edit tab in modification mode. If you want to modify another event instead, press Cancel, then change your selection.
- Page 240 Analyzing Traces with the Bidirectional Analysis Application (Optional) Modifying Events 6. If desired, from the Type list, select a new event type. Loss and reflectance values Loss and reflectance are calculated automatically, based on the position of the markers. Reflectance values are only displayed for reflective event types (reflective, echo, and possible echo).
-
Page 241: Deleting Events
Analyzing Traces with the Bidirectional Analysis Application (Optional) Deleting Events Deleting Events Note: You can only delete events from the A->B or B->A trace (not from the bidirectional measurement). The application regenerates the bidirectional measurement automatically to take into account the modifications you have made. - Page 242 Analyzing Traces with the Bidirectional Analysis Application (Optional) Deleting Events To delete an event: 1. From the main window, select the Edit tab. 2. Under Direction, select either A->B or B->A. 3. Select the event you want to delete. 4. Press Delete. Note: If the Delete button is not available, that means you cannot delete events of this type.
-
Page 243: Changing The Attenuation Of Fiber Sections
Analyzing Traces with the Bidirectional Analysis Application (Optional) Changing the Attenuation of Fiber Sections Changing the Attenuation of Fiber Sections Note: You can only modify the sections of the A->B or B->A trace (not those of the bidirectional measurement). The application regenerates the bidirectional measurement automatically to take into account the modifications you have made. - Page 244 Analyzing Traces with the Bidirectional Analysis Application (Optional) Changing the Attenuation of Fiber Sections To modify the attenuation of a fiber section: 1. From the main window, select the Edit tab. 2. Under Direction, select either A->B or B->A. 3. Select the fiber section that you want to modify. 4.
- Page 245 Analyzing Traces with the Bidirectional Analysis Application (Optional) Changing the Attenuation of Fiber Sections 5. Position markers as desired to modify the attenuation value. For more information on positioning markers, see Using Markers to Edit Events on page 221. Note: The markers serve only to set the new attenuation value. Their actual locations will not be modified.
-
Page 246: Setting General Parameters
Analyzing Traces with the Bidirectional Analysis Application (Optional) Setting General Parameters Setting General Parameters You can set preferences such as: Distance unit: You can select the measurement units that will be used throughout the application, except for certain values such as the pulse and the wavelength. - Page 247 Analyzing Traces with the Bidirectional Analysis Application (Optional) Setting General Parameters the gridlines: You can display or hide the grid appearing on the graph’s background. By default, the gridlines are displayed. Gridlines displayed the graph background: You can display the graph with a black (invert color feature) or a white background.
- Page 248 Analyzing Traces with the Bidirectional Analysis Application (Optional) Setting General Parameters To set the general parameters: 1. From the Main Menu, select Setup, then select the General tab. 2. Select the boxes corresponding to the item you want to display on the graph.
-
Page 249: Customizing The Events Table
Analyzing Traces with the Bidirectional Analysis Application (Optional) Customizing the Events Table Customizing the Events Table You can include or exclude items from the events table to better suit your needs. By default, all items are selected. Include span start and span end loss: When applicable, the application will include the losses caused by the span start and span end events in the displayed values. - Page 250 Analyzing Traces with the Bidirectional Analysis Application (Optional) Customizing the Events Table Injection level: In the events table, the injection level is represented by icon. In the Att. column, the injection level value for that event is identified by the @ symbol. You can hide the injection level value and symbol from the Att.
- Page 251 Analyzing Traces with the Bidirectional Analysis Application (Optional) Customizing the Events Table To customize the events table appearance: 1. From the Main Menu, select Setup, then select the Events tab. 2. Select the boxes corresponding to the item you want to display or include in the table.
-
Page 252: Saving The Span-Start And Span-End Information
Analyzing Traces with the Bidirectional Analysis Application (Optional) Saving the Span-Start and Span-End Information Saving the Span-Start and Span-End Information Saving the modified span-start and span-end information allows you to reapply the current span start and span end to a unidirectional trace when your reanalyze this trace. -
Page 253: Setting Pass/Fail Thresholds
Analyzing Traces with the Bidirectional Analysis Application (Optional) Setting Pass/Fail Thresholds Setting Pass/Fail Thresholds You can activate and set Pass/Fail threshold parameters for your traces and measurements. These thresholds are part of the OTDR Bidirectional application (not of the bidirectional files). This means that once you have set them, you can reuse them as many times as you want with other files. - Page 254 Analyzing Traces with the Bidirectional Analysis Application (Optional) Setting Pass/Fail Thresholds The following table provides the default, minimum and maximum thresholds. Test Default Minimum Maximum Splice loss (dB) 1.000 0.015 5.000 Connector loss (dB) 1.000 0.015 5.000 Reflectance (dB) –40.00 –80.0 Fiber section attenuation (dB/km) 0.400...
- Page 255 Analyzing Traces with the Bidirectional Analysis Application (Optional) Setting Pass/Fail Thresholds To set pass/fail thresholds: 1. From the Main Menu, select Setup, then select the Thresholds tab. 2. From the Wavelength list, select the wavelength for which you want to set thresholds.
- Page 256 Analyzing Traces with the Bidirectional Analysis Application (Optional) Setting Pass/Fail Thresholds 4. If you want to apply the thresholds you have just defined to one or several other wavelengths, proceed as follows: 4a. Press the Copy to Other Wavelengths button. 4b.
- Page 257 Analyzing Traces with the Bidirectional Analysis Application (Optional) Setting Pass/Fail Thresholds To revert to default threshold values and to delete custom wavelengths: 1. From the Main Menu, select Setup, then select the Thresholds tab. 2. Press the Revert to Factory Settings button. 3.
-
Page 258: Modifying Trace Analysis Settings
Analyzing Traces with the Bidirectional Analysis Application (Optional) Modifying Trace Analysis Settings Modifying Trace Analysis Settings You can view the current trace parameters for the bidirectional measurement as well as for the A->B and B->A traces (see Trace Info. Tab on page 208). - Page 259 1.000 25.000 Note: The event detection thresholds are not available when you work with a trace in Telcordia (Bellcore) non-EXFO version 200 format. MPORTANT Modifications to the detection thresholds alter the displayed traces because the application automatically reanalyzes the current trace and regenerates the bidirectional measurement.
- Page 260 Analyzing Traces with the Bidirectional Analysis Application (Optional) Modifying Trace Analysis Settings You can always revert to factory settings. The fiber settings will be reset according to the current trace and the event detection thresholds will return to fixed default values. To modify the trace analysis settings of the selected trace: 1.
- Page 261 Analyzing Traces with the Bidirectional Analysis Application (Optional) Modifying Trace Analysis Settings 4. Enter values for the current trace in the appropriate boxes. If you already know the IOR value, select Fixed IOR, then enter the value in the corresponding box. However, if you prefer to let the application calculate the IOR value as function of the distance between span start and span end, select Fixed length instead, then enter the distance value.
- Page 262 Analyzing Traces with the Bidirectional Analysis Application (Optional) Modifying Trace Analysis Settings To revert to default settings: 1. From the main window, select the Trace Info. tab. 2. Under Direction, select either A->B or B->A. 3. Press the Trace Analysis Settings button. 4.
-
Page 263: Saving Traces
Analyzing Traces with the Bidirectional Analysis Application (Optional) Saving Traces Saving Traces After recalling, analyzing and displaying the two traces in the bidirectional table, these traces may be stored as a merged bidirectional file in order to facilitate file management. All information in the tables, comments and reports for A->B, B->A, as well as the bidirectional trace will be saved in the bidirectional file. - Page 264 Analyzing Traces with the Bidirectional Analysis Application (Optional) Saving Traces To save bidirectional files: 1. From the Main Menu, select File > Save. 2. From the Save As dialog box, select a folder or create one to save your file. 3.
-
Page 265: Exporting Unidirectional Traces From Bidirectional Files
The files that you export are in native .trc format that can be opened with the OTDR application. Note: Traces in Telcordia (Bellcore) EXFO version 200 format, will also be exported to a native .trc format, but operations allowed on them will be limited. - Page 266 Analyzing Traces with the Bidirectional Analysis Application (Optional) Exporting Unidirectional Traces from Bidirectional Files To export unidirectional traces from a bidirectional file: 1. Create a bidirectional measurement (see Creating Bidirectional Measurement Files on page 193). Open an already existing file (see Opening Existing Bidirectional Measurement Files on page 197).
-
Page 267: Adding Information To The Test Results
Analyzing Traces with the Bidirectional Analysis Application (Optional) Adding Information to the Test Results Adding Information to the Test Results You might want to include or update information about the tested fiber and job or add comments to the A->B or B->A traces. This information will be included in the reports that you will create (see Creating Reports on page 259). - Page 268 Analyzing Traces with the Bidirectional Analysis Application (Optional) Adding Information to the Test Results 4. Enter the desired information. Note: The information in the Model and Serial number boxes is provided by the application and cannot be edited. 5. Press Apply to confirm your changes, then OK to return to the main window.
-
Page 269: Creating Reports
Analyzing Traces with the Bidirectional Analysis Application (Optional) Creating Reports Creating Reports You can create a report directly from the bidirectional application. This report will be saved in .html format. You can open it from your unit or from any computer equipped with a Web browser. It includes the following information: general information such as the cable ID, fiber ID, operators, etc. - Page 270 Analyzing Traces with the Bidirectional Analysis Application (Optional) Creating Reports To create a report: 1. Create a bidirectional measurement (see Creating Bidirectional Measurement Files on page 193). Open an already existing file (see Opening Existing Bidirectional Measurement Files on page 197). 2.
- Page 271 Analyzing Traces with the Bidirectional Analysis Application (Optional) Creating Reports To view a report from your unit: 1. Exit the OTDR Bidirectional application. 2. From Mini ToolBox, open File Manager. 3. Go to the folder in which you have saved your report. 4.
-
Page 273: 16 Maintenance
16 Maintenance To help ensure long, trouble-free operation: Always inspect fiber-optic connectors before using them and clean them if necessary. Keep the unit free of dust. Clean the unit casing and front panel with a cloth slightly dampened with water. Store unit at room temperature in a clean and dry area. -
Page 274: Cleaning Eui Connectors
Maintenance Cleaning EUI Connectors Cleaning EUI Connectors Regular cleaning of EUI connectors will help maintain optimum performance. There is no need to disassemble the unit. MPORTANT If any damage occurs to internal connectors, the module casing will have to be opened and a new calibration will be required. To clean EUI connectors: 1. - Page 275 6c. With a dry lint-free wiping cloth, gently wipe the same surfaces to ensure that the connector and ferrule are perfectly dry. 6d. Verify connector surface with a portable fiber-optic microscope(for example, EXFO’s FOMS) or fiber inspection probe (for example, EXFO’s FIP). ARNING Verifying the surface of the connector WHILE THE UNIT IS ACTIVE WILL result in permanent eye damage.
-
Page 276: Verifying Your Otdr
Deviation is measured to determine if the OTDR needs recalibration. Setting your OTDR to zero can only be done at EXFO. However, you can test your OTDR to verify the accuracy of its measurement origin. To measure the deviation: 1. - Page 277 If the situation persists, you will observe a degradation in dynamic range. Return the OTDR to EXFO. Note: This does not affect the precision of distance or loss measurements. OTDR...
- Page 278 The position of the marker should be equal to the length of the jumper (± 2 m). For example, 8 to 12 m if the jumper is 10 m long. If the distance error is beyond this limit, return the OTDR to EXFO. FTB-700 Series...
- Page 279 If this is the case, carefully clean the connector. If the problem persists, change the output connector. If the problem remains even after changing the output connector, return the OTDR to EXFO. Note: This does not affect the precision of the distance or loss measurements.
- Page 280 Maintenance Verifying Your OTDR To measure the dynamic range: 1. Connect the OTDR as indicated below. Other configurations are possible, such as the one explained in the section on how to determine measurement range, if you use the shortest fiber length from that setup.
- Page 281 If this is the case, clean the connector. If the problem persists, change the output connector. If the problem remains even after changing the output connector, return the OTDR to EXFO. Note: This does not affect the precision of the distance or loss measurements.
- Page 282 Maintenance Verifying Your OTDR To determine the measurement range (singlemode models only): 1. Connect the OTDR as indicated below. Other configurations are possible, but the fiber should have several sections longer than 2 km, with no loss greater than 8 dB and with the average attenuation not exceeding 1 dB/km.
- Page 283 Maintenance Verifying Your OTDR 2. Set the distance range to 80 km (singlemode fiber), the pulse width to the longest value available and the acquisition time to 180 seconds. The measurement range using the non-reflective event method represents the amount of attenuation (dB) between the launch level and a 0.5 dB splice (which can be detected and measured to an accuracy of ±...
-
Page 284: Recalibrating The Unit
You should determine the adequate calibration interval for your unit according to your accuracy requirements. Under normal use, EXFO recommends calibrating your unit every year. FTB-700 Series... -
Page 285: Recycling And Disposal (Applies To European Union Only)
This equipment was sold after August 13, 2005 (as identified by the black rectangle). Unless otherwise noted in a separate agreement between EXFO and a customer, distributor, or commercial partner, EXFO will cover costs related to the collection, treatment, recovery, and disposal of... -
Page 287: 17 Troubleshooting
17 Troubleshooting Problem Cause Solution The application displays The fiber under test is Ensure that the fiber under test is a message indicating too long. shorter than the maximum length the that a “Non-resolved OTDR can measure. fiber end” event has been found. - Page 288 “normal”. If you still see the message about live fiber error even if no fiber is connected to the OTDR, contact EXFO. Never connect a live fiber to the OTDR port without a proper setup. Any incoming optical power ranging from –65 dBm to –40 dBm will affect...
- Page 289 If you still see the message about live wavelength. fiber error even if no fiber is connected to the OTDR, contact EXFO. Singlemode live-fiber testing requires that the integrated power in the test channel (corresponding to the filter bandwidth of the SM Live port) be as low as possible.
-
Page 290: Contacting The Technical Support Group
Contacting the Technical Support Group To obtain after-sales service or technical support for this product, contact EXFO at one of the following numbers. The Technical Support Group is available to take your calls from Monday to Friday, 8:00 a.m. to 7:00 p.m. -
Page 291: Transportation
Troubleshooting Transportation Transportation Maintain a temperature range within specifications when transporting the unit. Transportation damage can occur from improper handling. The following steps are recommended to minimize the possibility of damage: Pack the unit in its original packing material when shipping. Avoid high humidity or large temperature fluctuations. -
Page 293: 18 Warranty
18 Warranty General Information EXFO Inc. (EXFO) warrants this equipment against defects in material and workmanship for a period of one year from the date of original shipment. EXFO also warrants that this equipment will meet applicable specifications under normal use. -
Page 294: Liability
Liability Liability EXFO shall not be liable for damages resulting from the use of the product, nor shall be responsible for any failure in the performance of other items to which the product is connected or the operation of any system of which the product may be a part. -
Page 295: Service And Repairs
5. Return the equipment, prepaid, to the address given to you by support personnel. Be sure to write the RMA number on the shipping slip. EXFO will refuse and return any package that does not bear an RMA number. -
Page 296: Exfo Service Centers Worldwide
Warranty EXFO Service Centers Worldwide EXFO Service Centers Worldwide If your product requires servicing, contact your nearest authorized service center. EXFO Headquarters Service Center 400 Godin Avenue 1 866 683-0155 (USA and Canada) Quebec (Quebec) G1M 2K2 Tel.: 1 418 683-5498... -
Page 297: A Technical Specifications
MPORTANT The following technical specifications can change without notice. The information presented in this section is provided as a reference only. To obtain this product’s most recent technical specifications, visit the EXFO Web site at www.exfo.com. SPECIFICATIONS TECHNICAL SPECIFICATIONS FTB-7200D... -
Page 298: Technical Specifications
Technical Specifications All specifications valid at 23º C ± 2º C with an FC/PC connector for the FTB-7300E, with FC/APC for FTB-730, unless otherwise specified. TECHNICAL SPECIFICATIONS Model FTB-7300E FTB-730 Wavelength (nm) 1310 ± 20/1490 ± 10/1550 ± 20/1625 ± 10/1650 ± 7 1310 ±... -
Page 299: B Description Of Event Types
Description of Event Types This section describes all types of events that may appear in the events table generated by the application. Here is a guide to the descriptions: Each type of event has its own symbol. Each type of event is represented by a graph of a fiber trace, which illustrates the power reflected back toward the source as a function of distance. -
Page 300: Span Start
Description of Event Types Span Start Span Start The Span Start of a trace is the event that marks the beginning of the fiber span. By default, the Span Start is placed on the first event of a tested fiber (typically the first connector of the OTDR itself). -
Page 301: Continuous Fiber
Description of Event Types Continuous Fiber Continuous Fiber Reflected power (dB) Continuous fiber Distance (km) This event indicates that the selected acquisition range was shorter than the fiber length. The fiber end was not detected because the analysis process ended before reaching the end of the fiber. -
Page 302: End Of Analysis
Description of Event Types End of Analysis End of Analysis Reflected power (dB) Distance (km) This event indicates that the pulse width used did not provide enough dynamic range to get to the end of the fiber. The analysis ended before reaching the end of the fiber because the signal-to-noise ratio was too low. -
Page 303: Non-Reflective Event
Description of Event Types Non-Reflective Event Non-Reflective Event Reflected power (dB) Non-reflective event Linear downward slope due to Rayleigh backscatter Distance (km) This event is characterized by a sudden decrease in the Rayleigh backscatter signal level. It appears as a discontinuity in the downward slope of the trace signal. -
Page 304: Reflective Event
Description of Event Types Reflective Event Reflective Event Reflected Clipped level power (dB) Reflective events Distance (km) Reflective events appear as spikes in the fiber trace. They are caused by an abrupt discontinuity in the index of refraction. Reflective events cause a significant portion of the energy initially launched into the fiber to be reflected back toward the source. -
Page 305: Positive Event
Description of Event Types Positive Event Positive Event Reflected power (dB) Positive event Distance (km) This event indicates a splice with an apparent gain, due to the junction of two fiber sections having different fiber backscatter characteristics (backscatter and backscatter capture coefficients). A loss value is specified for positive events. -
Page 306: Launch Level
Description of Event Types Launch Level Launch Level Reflected power (dB) Launch level event position Second event Launch level Linear area Distance (km) This event indicates the level of the signal launched into the fiber. The figure above shows how the launch level is measured. A straight line is plotted using least-square approximation to fit all trace points in the linear area between the first and second detected events. -
Page 307: Fiber Section
Description of Event Types Fiber Section Fiber Section Reflected power (dB) Fiber Fiber section section Distance (km) This symbol denotes a fiber section with no event. The sum of all fiber sections contained in an entire fiber trace equals the total fiber length. Detected events are distinct even if they cover more than one point on the trace. -
Page 308: Merged Event
Description of Event Types Merged Event Merged Event Reflected power (dB) Reflective events Point A Δ Total loss ( Point B Merged Reflective event position Distance (km) This symbol denotes an event combined with one or more other events. It also indicates the total loss produced by the merged events following it in the events table. - Page 309 Description of Event Types Merged Event The total loss (Δ dB) produced by the events is measured by plotting two straight lines. The first line is plotted by fitting, through least-square approximation, trace points in the linear area preceding the first event.
- Page 310 Description of Event Types Merged Event Pass/Fail Tests As an example about pass/fail tests, let us consider the situation below: Merged event Merged sub-events: 2 reflective losses 1 non-reflective loss Thresholds: Reflective loss: 0.5 dB Event loss Non-reflective Loss: 0.2 dB For a merged event, it is possible to determine the global event loss, but not the contribution of each sub-event.
- Page 311 Description of Event Types Merged Event All Event Types Are Tested In the first case, where all event types are tested, the pass/fail conditions are as follows: If the event loss is less than or equal to the smallest threshold value, then the event status is Pass.
- Page 312 Description of Event Types Merged Event Not All Event Types Are Tested In this situation, the only thing that we can clearly know is when the loss has a Pass status. If the global event loss is less than or equal to the smallest threshold value (a value that is tested, of course), we are sure that the merged event status is Pass.
- Page 313 Description of Event Types Merged Event Effect of Event Status in the Global Trace Status A trace status is, by default, set to Unknown. If a trace is set to Fail once, it remains with that status (it cannot be set back to Pass or Unknown).
-
Page 314: Echo
Description of Event Types Echo Echo Reflected power (dB) OTDR connector Second connector End connector Echo Lightwave travel Distance (km) This symbol indicates that a reflective event has been detected after the end of the fiber. In the example above, the launched pulse travels up to the end connector and is reflected back toward the OTDR. -
Page 315: Reflective Event (Possible Echo)
Description of Event Types Reflective Event (Possible Echo) Reflective Event (Possible Echo) Reflected power (dB) OTDR connector Second connector Third connector Reflective event (possible echo) Distance (km) This symbol indicates a reflective event that can be a real reflection or an echo produced by another stronger reflection located closer to the source. -
Page 317: Index
Index Index analyzing traces......... 150 application, main window ......192 ***** indication ........170 application, starting ........15 Att. column in events table..108, 205, 206 attenuation fiber section ........47, 243 accuracy, trace ..........43 fiber-section threshold ....47, 243 acquiring traces LSA measurement method.... - Page 318 Index buttons, trace editing in events table..109 dial buttons, zoom. see controls, zoom Distance ..........39 moving ..........41 Pulse ............39 Time............39 calibration disappearing marker........161 certificate..........274 displaying interval ..........274 fiber sections ....... 122, 239 caution fiber span..........
- Page 319 ......... 263 description........... 201 locating event......109, 207 trace editing buttons ......109 General tab........82, 120, 237 events, view ..........102 generating reports........179 EXFO universal interface. see EUI graph view ..........201 grid display........82, 120, 237 OTDR...
- Page 320 Index measurement........163 measurement, positioning markers..167 helix factor modification ........ 132, 227 admissible values ........37 non-reflective events average ..128, 209 in Trace Info. tab ....129, 210, 248 span threshold ....... 47, 243 modification ........ 127, 248 splice..........
- Page 321 Index photodetector ..........5 Pos. in event table ......205, 206 naming trace automatically....20, 72 position, event........205, 206 native trace format........174 precision, trace ..........43 noise area, searching......... 150 product non-reflective event, averaged loss ... 128, 209 identification label .......
- Page 322 ..........52 Template mode pass/fail thresholds ......47, 243 acquiring the reference trace ....58 shipping to EXFO ........285 acquiring traces ........60 signal-to-noise ratio ........40 applying parameters to other traces ..56 single-wavelength trace file, description..........
- Page 323 Index test, settings used in Template mode..56 autonaming ........20, 72 testing changing default name....20, 72 Advanced mode........31 color in trace display ......101 Auto mode ..........27 compatibility between ToolBox versions174 Fault Finder..........69 editing buttons ........109 Template mode........
- Page 324 Index total/average loss......... 209 wavelength.......... 128 zoom trace report controls........117, 217 creating ..........177 resetting automatically ......116 generating ........... 179 window display........120 transportation requirements ..... 263, 281 two-point attenuation.......... 168 measurement method vs. LSA ..... 168 measurement method, definition ..168 type in events table .....
- Page 325 CHINESE REGULATION ON RESTRICTION OF HAZARDOUS SUBSTANCES NAMES AND CONTENTS OF THE TOXIC OR HAZARDOUS SUBSTANCES OR ELEMENTS CONTAINED IN THIS EXFO PRODUCT EXFO Indicates that this toxic or hazardous substance contained in all of the homogeneous materials for this part is below the limit requirement in SJ/T11363-2006...
- Page 326 MARKING REQUIREMENTS Product Environmental protection use period (years) Logo This Exfo product EXFO Battery If applicable.
- Page 327 East, Dongcheng District EXFO SERVICE ASSURANCE 270 Billerica Road Chelmsford MA, 01824 USA Tel.: 1 978 367-5600 · Fax: 1 978 367-5700 TOLL-FREE (USA and Canada) 1 800 663-3936 © 2011 EXFO Inc. All rights reserved. Printed in Canada (2011-02)
Need help?
Do you have a question about the FTV-700 series and is the answer not in the manual?
Questions and answers