
Related Manuals for Hioki 8855


Summary of Contents for Hioki 8855
- Page 1 Instruction Manual 8855 MEMORY HiCORDER December 2008 Revised edition 9 8855A988-09 08-12H...
-
Page 3: Table Of Contents
Chapter 2 Installation and Preparation 2.1 Installation of the Product 2.2 Power Supply and Ground Connections 2.2.1 Connecting the AC Power Supply 2.2.2 Functional Grounding of the 8855 2.3 Power On/Off 2.4 Connection of the Input Product 2.4.1 8950, 8952, 8953-10, 8955 INPUT UNITs 2.4.2 8951 VOLTAGE/CURRENT UNIT... - Page 4 Chapter 3 Recorder & Memory Function 3.1 Overview of the Recorder & Memory Function 3.2 Operation Sequence (REC&MEM) 3.3 STATUS Settings (REC&MEM: STATUS Screen) 34 3.3.1 Setting the Function Mode 3.3.2 Setting the Time Axis Range 3.3.3 Setting the Recording Length 3.3.4 Display Function 3.3.5 Setting the Display Format 3.4 Setting the Additional Recording Function...
- Page 5 4.3.15 Setting the Wave Colors 4.3.16 Setting the Display Scale 4.3.17 Octave Filter Setting 4.4 Printout of FFT Processing Results (When 8994 PRINTER UNIT is installed.) 4.4.1 Setting the Print Mode 4.4.2 Setting the Auto Print Function 4.5 Setting the Auto Save Function 4.6 Settings on the Waveform Display Screen (FFT) 75 4.7 Start and Stop Operation (FFT) 4.8 FFT Analysis Function...
- Page 6 5.8 Setting the 8951 VOLTAGE/CURRENT UNIT 5.8.1 Setting Voltage Measurement 5.8.2 Setting Current Measurement 5.9 Setting the 8952 DC/RMS UNIT 5.9.1 Setting Voltage Measurement 5.9.2 Setting RMS Measurement 5.10 8953-10 HIGH RESOLUTION UNIT 5.11 Setting the 8954 VOLTAGE/TEMP UNIT 5.11.1 Setting Voltage Measurement 5.11.2 Setting Temperature Measurement 5.12 Setting the 8955 F/V UNIT 5.12.1 Frequency, Rotation, and Commercial...
- Page 7 8.4 Event Search 8.5 Time Search 8.6 Moving Cursors to the Search Points Chapter 9 Waveform Evaluation Function 9.1 Waveform GO/NG Evaluation (MEM, FFT Function, Power Monitor Function) 9.2 Setting the Waveform Area 9.3 Setting the Waveform Evaluation Mode 9.4 Setting the GO/NG Stop Mode 9.5 Creating the Evaluation Area 9.6 Editor Command Details Chapter 10 Printout of Measurement Data...
- Page 8 Appendix APPENDIX 1 Appendix 1 Error Messages APPENDIX 1 Appendix 2 Glossary APPENDIX 4 Appendix 3 Reference APPENDIX 6 Appendix 3.1 Sampling APPENDIX 6 Appendix 3.2 Aliasing APPENDIX 6 Appendix 3.3 Measurement Limit Frequency APPENDIX 7 Appendix 3.4 Recorder Function APPENDIX 8 Appendix 3.5 Averaging Equations APPENDIX 9...
- Page 9 This manual is the Advanced edition (Instruction Manual) for the "8855 MEMORY HiCORDER." It describes the advanced functions and procedures for the 8855. For information on general functions and procedures, refer to the Basics edition (Quick Start Manual) of this manual.
-
Page 10: Inspection
When you receive the instrument, inspect it carefully to ensure that no damage occurred during shipping. In particular, check the accessories, panel switches, and connectors. If damage is evident, or if it fails to operate according to the specifications, contact your dealer or Hioki representative. Accessories Power cord... - Page 11 ──────────────────────────────────────────────────── 220H PAPER WINDER 9303 PT 9318 CONVERSION CABLE (for the 9270 to 9272, 9277 to 9279) 3273 CLAMP ON PROBE (DC to 50 MHz) 3273-50 CLAMP ON PROBE (DC to 50 MHz) 3274 CLAMP ON PROBE (DC to 10 MHz) 3275 CLAMP ON PROBE (DC to 2 MHz) 3276 CLAMP ON PROBE (DC to 100 MHz) 9018-10 CLAMP ON PROBE (10 to 500 A, 40 Hz to 3 kHz)
-
Page 12: Safety Notes
──────────────────────────────────────────────────── Safety Notes This manual contains information and warnings essential for safe operation of the instrument and for maintaining it in safe operating condition. Before using the instrument, be sure to carefully read the following safety notes. This instrument is designed to comply with IEC 61010 Safety DANGER Standards, and has been thoroughly tested for safety prior to shipment. - Page 13 ──────────────────────────────────────────────────── Measurement categories (Overvoltage categories) This instrument complies with CAT II safety requirements. To ensure safe operation of measurement instruments, IEC 61010 establishes safety standards for various electrical environments, categorized as CAT I to CAT IV, and called measurement categories. These are defined as follows. CAT I Secondary electrical circuits connected to an AC electrical outlet through a transformer or similar device.
-
Page 14: Notes On Use
Using the products in such conditions could cause an electric shock, so contact your dealer or Hioki representative for replacements. (Model 9197, 9198.) Input/output terminal Maximum input voltage... - Page 15 The logic input and 8855 instrument share a common ground. Therefore, if power is supplied to the measurement object of the logic probe and to the 8855 from different sources, an electric shock or damage to the equipment may result. Even if power is...
- Page 16 MEMORY HiCORDERs that use the 9665 and the 9666. ) Do not measure voltages that exceed the maximum input voltage, as the 8855 instrument could be damaged and an accidents resulting in injury or death could result.
- Page 17 Never use abrasives or solvent cleaners. Hioki shall not be held liable for any problems with a computer system that arises from the use of this CD-R, or for any problem related to the purchase of a Hioki product.
- Page 18 Recording paper (when the 8994 PRINTER UNIT is installed) Use only recording paper specified by Hioki. Non-specified recording paper may result in poor-quality or blank printouts. Printing is not possible if the recording paper is loaded wrong-side up. See Section 2.9.
-
Page 19: Chapter Summary
Explains how to use the FFT functions of the instrument. Chapter 5 Input Channel Settings Explains how to use the input channel of the instrument. This manual describes the advanced functions of the 8855. Chapter 6 Memory Segmentation Function Explains how to use the Memory Segmentation Function. - Page 20 ──────────────────────────────────────────────────── ──────────────────────────────────────────────────── Chapter Summary...
-
Page 21: Chapter 1 Product Overview
──────────────────────────────────────────────────── Chapter 1 Product Overview ────────────────────────────────────────────────────... -
Page 22: Major Features
Using the 8954 VOLTAGE/TEMP UNIT in combination with the 8855, it is possible to record temperature. Using the 8955 F/V UNIT in combination with the 8855, it is possible to measure items such as frequency. Regardless of the input module, it is possible to record waveforms on up to 8 channels, simultaneously. - Page 23 If a MO drive is connected to the SCSI interface, the waveform data and/or setup conditions can be stored on a MO disk. When the 8855 is connected to your PC through an SCSI, you can access the data of the internal 8855 MO disk or hard disk from the PC.
-
Page 24: Identification Of Controls And Indicators
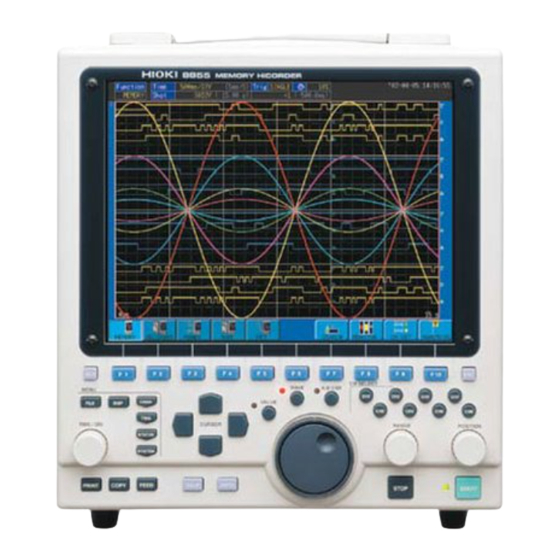
──────────────────────────────────────────────────── 1.2 Identification of Controls and Indicators 16 17 Front Panel ──────────────────────────────────────────────────── 1.2 Identification of Controls and Indicators... - Page 25 ──────────────────────────────────────────────────── Serve to select setting items. HELP Provides on-line help. CHAN Causes the display to show the Channel screen which serves for making input channel settings. DISP Causes the display to show measurement and analysis results. FILE Causes the display to show the File screen which serves for reading, storing, etc.
- Page 26 ──────────────────────────────────────────────────── 10 11 12 13 14 15 16 Right Side Panel AC power switch Switches on or off the AC power supply. AC connector The supplied power cord must be plugged in here. Function ground Connects to the earth. terminal (GND) External sampling Allows input of an external sampling signal.
- Page 27 Unbalanced analog input. (on ANALOG UNIT) Blowing slot Left Side Panel Upper Panel Rear Panel Bottom Panel Handle Serves for transporting the 8855. Ventilation slots Printer (when the 8994 PRINTER UNIT is installed) ──────────────────────────────────────────────────── 1.2 Identification of Controls and Indicators...
- Page 28 ──────────────────────────────────────────────────── ──────────────────────────────────────────────────── 1.2 Identification of Controls and Indicators...
-
Page 29: Chapter 2 Installation And Preparation
──────────────────────────────────────────────────── Chapter 2 Installation and Preparation 2.1 Installation of the Product Installation orientation Install the instrument on a flat, level surface. ──────────────────────────────────────────────────── 2.1 Installation of the Product... - Page 30 ──────────────────────────────────────────────────── Ambient conditions Temperature 5 to 40 C, 23 5 C recommended for high-precision measurements. Humidity 30 to 80% RH (no condensation); 50 10% RH (no condensation) recommended for high-precision measurements. Ventilation Take care not to block the ventilation openings and assure proper ventilation.
-
Page 31: Power Supply And Ground Connections
1. Verify that the AC power switch of the 8855 is set to OFF. 2. Plug the grounded three-core power cord supplied into the AC power connector on the right side of the 8855. -
Page 32: Functional Grounding Of The 8855
──────────────────────────────────────────────────── 2.2.2 Functional Grounding of the 8855 When the 8855 is used in noise-prone environments, connect the functional grounding terminal to improve noise characteristics. Functional grounding terminal ──────────────────────────────────────────────────── 2.2 Power Supply and Ground Connections... -
Page 33: Power On/Off
──────────────────────────────────────────────────── 2.3 Power On/Off Check the following points before the power switch is turned on. WARNING Power supply matches Rated supply voltage (100 to 240 V AC: Voltage fluctuations of 10% from the rated supply voltage are taken into account.) and rated supply frequency (50/60 Hz). The instrument is correctly installed (Section 2.1). -
Page 34: Connection Of The Input Product
──────────────────────────────────────────────────── 2.4 Connection of the Input Product 2.4.1 8950, 8952, 8953-10, 8955 INPUT UNITs Never connect the probe to the 8855 while the probe is WARNING already connected to the measurement object. Otherwise there is a risk of electric shock. -
Page 35: 8951 Voltage/Current Unit
IEC 61010-2-032 (JIS C 1010-2-32) *: The voltage levels are 30 V rms and 42.4 V peak or 60 V DC. When you are using the clamp to the 8855, the 8951 GND, WARNING clamp GND, and power supply terminals of modules on other channels are not insulated. - Page 36 9270, 9271, 9272, 9277, 9278, 9279 Number of usable clamps The number of clamps that can be used with the 8855 is limited according to clamp type. The clamps that can be used for the relevant clamp type is shown to the list shown below.
- Page 37 ──────────────────────────────────────────────────── Connecting the 9318 CONVERSION CABLE Instrument's sensor connector 1. Align the groove on the conversion cable plug with Conversion cable plug the sensor connector on the 8951 and push inward Conversion cable connector until the connector locks into place. 2.
-
Page 38: 8954 Voltage/Temp Unit
──────────────────────────────────────────────────── 2.4.3 8954 VOLTAGE/TEMP UNIT Do not connect the connection cord to the 8855 while the WARNING instrument is connected to the object being measured. This may cause electric shock. A common GND is used for the voltage and temperature input on each channel. - Page 39 ──────────────────────────────────────────────────── How to remove the covering from the thermocouple 25 mm 10 mm External covering Internal covering Thermocouple wire Recommended diameter φ 0.4 mm to 1.2 mm (AWG26 to 16) To install and remove the thermocouple, use a tool such as a screwdriver. NOTE The push-button terminal block on the 8954 VOLTAGE/TEMP UNIT is for use with a thermocouple.
-
Page 40: Logic Probe Connection
If no logic probe is connected, the corresponding logic waveform is NOTE displayed on the screen at high level. Carefully read the instruction manual supplied with the probe. Do not connect logic probes other than supplied by HIOKI to the logic inputs. ──────────────────────────────────────────────────── 2.5 Logic Probe Connection... -
Page 41: 9018-10, 9132-10 Clamp On Probe Connection
Section 5.3.2. When the clamp-on probe is used for measurement, the measurement precision will be affected both by the 8855 precision and clamp-on probe precision ratings. The same is true for cases where other clamps are used. When using the 9199 CONVERSION ADAPTOR, the 9018, 9132 CLAMP ON PROBEs can be used. -
Page 42: 9322 Differential Probe Connection
L-GND 1,000 V AC, DC (CAT II) 600 V AC, DC (CAT III) 9322 is a differential probe that connects to input of 8855 MEMORY HiCORDER input module. For more details, refer to its instruction manual. ──────────────────────────────────────────────────── 2.7 9322 DIFFERENTIAL PROBE Connection... -
Page 43: 9665 10:1 Probe / 9666 100:1 Probe
MEMORY HiCORDERs that use the 9665 and the 9666. ) Do not measure voltages that exceed the maximum input voltage, as the 8855 instrument could be damaged and an accidents resulting in injury or death could result. The 9665 10:1PROBE and the 9666 100:1PROBE cannot be used with the... -
Page 44: Loading Recording Paper (When The 8994 Printer Unit Is Installed)
──────────────────────────────────────────────────── 2.9 Loading Recording Paper (when the 8994 PRINTER UNIT is installed) 1. Press the stock cover and open it. Stock cover Head up/down lever 2. Put down the head up/down lever. Holder 3. Insert the attachments into the ends of the roll of recording paper and set the paper into its holder. - Page 45 ──────────────────────────────────────────────────── 5. Align the edges of the recording paper you pulled out of the printer with the edges of the recording paper set into the holder. If the edges of the recording paper are not aligned exactly, the paper will come out crooked when printing.
-
Page 46: Care Of Recording Paper
──────────────────────────────────────────────────── 2.10 Care of Recording Paper Care of recording paper While unopened, thermal paper will not be affected by the environment, provided that ambient temperature and humidity do not exceed normal levels. For long-term storage, temperature should be lower than 40 . Low temperatures cause no problem. -
Page 47: Notes On Measurement
Using the products in such conditions could cause an electric shock, so contact your dealer or Hioki representative for replacements. (Model 9197 or 9198 CONNECTION CORD.) Input/output terminal... - Page 48 ──────────────────────────────────────────────────── In order to avoid accidents from electric shock, before WARNING removing or replacing an input module, check that the connection cords and thermocouple are disconnected, turn off the power, and remove the power cord. To avoid the danger of electric shock, never operate the instrument with an input module removed.
-
Page 49: Maximum Input Voltage
──────────────────────────────────────────────────── 2.11.1 Maximum Input Voltage 8950 ANALOG UNIT/ 8952 DC/RMS UNIT 8953-10 HIGH RESOLUTION UNIT 8950 8855 400 V DC max. 8953-10 370 V AC, DC 370 V AC, DC 8951 VOLTAGE/CURRENT UNIT 8855 8951 Connector 30 V rms or 60 V DC... -
Page 50: Using A Voltage Transformer
When making measurements on an AC power line for example, using a voltage transformer, be sure to connect the voltage transformer ground terminal to ground. When the voltage transformer has a ground terminal 8950 8855 Input Voltage transformer (PT) ground terminal Ground... -
Page 51: Chapter 3 Recorder & Memory Function
──────────────────────────────────────────────────── Chapter 3 Recorder & Memory Function 3.1 Overview of the Recorder & Memory Function The recorder and memory function has the following features. (1) After being stored in the internal memory, input signal data can be displayed and printed. (2) All input channel data are recorded on the same time axis. -
Page 52: Operation Sequence (Rec&Mem)
──────────────────────────────────────────────────── 3.2 Operation Sequence (REC&MEM) Preparation Installation of the Instrument Turn on the power See Chapter 2 Connect the inputs Basic Settings Settings on the STATUS screen Function Select the recorder and memory function. Section 3.3 Time axis range Determine the speed with which (Recorder/Memory the input signal waveform is STATUS... - Page 53 ──────────────────────────────────────────────────── Setting the input channel See Quick Start Chapter 6 Settings on the channel screen Waveform display color Waveform display graph Voltage axis range Input coupling Logic input Magnification/compression along voltage Zero position Zero adjustment Low-pass filter Variable function (See Section 5.2) Settings the advanced function Scaling function (See Section 5.3) Comment function (See Section 5.4)
-
Page 54: Status Settings (Rec&Mem: Status Screen)
──────────────────────────────────────────────────── 3.3 STATUS Settings (REC&MEM: STATUS Screen) Press the key to access the STATUS screen. This section explains STATUS how to set the STATUS screen of the recorder and memory function. See the corresponding sections for items that can be set in the Waveform display or CHANNEL screens. -
Page 55: Setting The Function Mode
──────────────────────────────────────────────────── 3.3.1 Setting the Function Mode The 8855 has four function modes. Select the Recorder and Memory functions. Procedure Screen: STATUS, CHANNEL, Waveform display, TRIGGER, SYSTEM 1. Use the Menu keys to display the desired screen. 2. Move the flashing cursor to the top position. -
Page 56: Setting The Time Axis Range
──────────────────────────────────────────────────── 3.3.2 Setting the Time Axis Range Set the speed for inputting and storing the waveform of the input signal. Time axis range setting expresses the time for 1 DIV. The sampling period is 1/100th of the set value for the time axis range. (100 samples/DIV) The sampling period for the sampling recorder is set by the memory. -
Page 57: Setting The Recording Length
──────────────────────────────────────────────────── 3.3.3 Setting the Recording Length The length of recording for one measurement operation (number of DIV) can be set. The recording lengths for the recorder and memory are set separately. Two setting methods are available. Select the recording length. SELECT Variable recording length can be selected by the user. -
Page 58: Display Function
The memory waveform in Recorder and Memory function can be also displayed in memory recorder function. The display function setting cannot be changed during measurement. Starting up the 8855 with memory waveform display ON automatically selects REC&MEM display. ──────────────────────────────────────────────────── 3.3 STATUS Settings (REC&MEM: STATUS Screen) -
Page 59: Setting The Display Format
──────────────────────────────────────────────────── 3.3.5 Setting the Display Format The style can be set for showing input signals on the screen display and recording them on the printer. The styles single, dual, quad, and oct are available. Procedure Screen: STATUS 1. Press the key to display the Status STATUS screen. -
Page 60: Setting The Additional Recording Function
──────────────────────────────────────────────────── 3.4 Setting the Additional Recording Function This records, regarding the memory as though it were recording paper. As waveforms captured by the recorder are stored in the instrument's memory, this machine can be operated as a paper recorder. The memory capacity of 32 M words can accommodate up to 10000 divisions of waveform data. -
Page 61: Settings On The Waveform Display Screen (Rec&Mem)
──────────────────────────────────────────────────── Time values output to the printer and displayed on the screen with the NOTE additional recording function enabled are equal to those of the most recently acquired waveforms. Therefore, when measuring waveforms in a different time axis range, always take that difference into consideration. When the 10000 (128 M words: 40000, 512 M words: 160000) DIV has been reached, old data will be overwritten. - Page 62 ──────────────────────────────────────────────────── Setting items Selection Explanation 1. Function MEM, REC, FFT, Select function. REC&MEM SINGLE, REPEAT, 2. Trigger mode Select trigger mode. TIMER (recorder waveform) 3. Pre-trigger 0 to 100%, -95% Set the Pre-trigger. (memory waveform) 4. Time Axis Range 10 ms/DIV to Set the speed for inputting and 1 h/DIV (REC) storing the waveform of the input...
-
Page 63: Setting The Printer (Only When The 8994 Printer Unit Is Installed)
──────────────────────────────────────────────────── 3.6 Setting The Printer (Only When The 8994 PRINTER UNIT Is Installed) 3.6.1 Setting the Print Mode Select the format, waveform, or numerical value should be used to output measured data and calculation results. The smooth print function can be used, but print speed will Waveform decrease. -
Page 64: Setting The Real-Time Printing Function
──────────────────────────────────────────────────── 3.6.2 Setting the Real-time Printing Function The input waveform (recorder waveform) is continuously printed in real time. Procedure Screen: PRINTER 1. Press the key to display the PRINTER screen. SYSTEM 2. Move the flashing cursor to the item. Realtime Print 3. -
Page 65: Setting The Auto Save Function
: Data are stored as binary data. : Data are stored as text data. Data stored in the text format is not readable by the 8855. 5. When the data format to be saved is set to text data, the intermittent setting item is displayed. - Page 66 ──────────────────────────────────────────────────── 9. When Media is selected, the Storage method item appears. Function display Meaning When [Make directory] is set to [NONE], auto- save is cancelled when the storage media is full, or when the directory's file count exceeds 5000. When [Make directory] is set to [EXIST], a new directory is created each time the current directory's file count exceeds 5000, until the storage media fills up, causing auto-save to...
-
Page 67: Simultaneous Display Of Recorder And Memory Waveforms
──────────────────────────────────────────────────── 3.8 Simultaneous Display of Recorder and Memory Waveforms A recorder waveform and memory waveform can be displayed simultaneously on the screen. This allows trigger activation using memory to analyze in detail an incident that occurs during recording. :Recorder waveform Bottom :Memory waveform Use with memory segmentation... -
Page 68: Start And Stop Operation (Rec&Mem)
──────────────────────────────────────────────────── 3.9 Start and Stop Operation (REC&MEM) Setting the 8855 STATUS Settings See Section 3.3, "STATUS Settings", Chapter 5, "Input Channel Channel Settings Settings", Quick Start Chapter 7, "Trigger Functions." Trigger Settings Press the key and LED light. START Measurement start Setting the trigger to Timer causes a delay until the set time. -
Page 69: Chapter 4 Fft Function
──────────────────────────────────────────────────── Chapter 4 FFT Function 4.1 Overview of the FFT Function The FFT function has the following features. (1) FFT (Fast Fourier Transform) processing can be performed on input signal data for frequency analysis. (2) Frequency range 133 mHz to 8 MHz (3) Frequency resolution 1/400, 1/800, 1/2000, 1/4000 of frequency range (4) 12 types of analysis functions... -
Page 70: Operation Sequence (Fft)
──────────────────────────────────────────────────── 4.2 Operation Sequence (FFT) Preparation Installation of the Instrument Turn on the power See Chapter 2 Connect the inputs Basic Settings Settings on the STATUS screen Function Select the FFT function. FFT mode Select the using channels (1 Section 4.3 channel or 2 channels) STATUS Press the... - Page 71 ──────────────────────────────────────────────────── Setting the input channel See Quick Start Chapter 6 Settings on the channel screen Waveform display color Voltage axis range Input coupling Magnification/compression along voltage Anti-aliasing filter Zero position Zero adjustment Low-pass filter Settings the advanced function Comment function Section 5.4 Setting the trigger function Trigger mode...
-
Page 72: Status Settings (Fft)
──────────────────────────────────────────────────── 4.3 STATUS Settings (FFT) Press the key to access the STATUS screen. This section explains STATUS how to set the STATUS screen of the FFT function. See the corresponding sections for items that can be set in the Waveform display or CHANNEL screens. -
Page 73: Setting The Function Mode
──────────────────────────────────────────────────── 4.3.1 Setting the Function Mode The 8855 has four function modes. Select the FFT function. Procedure Screen: STATUS, CHANNEL, Waveform display, TRIGGER 1. Use the Menu keys to display the desired screen. 2. Move the flashing cursor to the top position. -
Page 74: Setting The Frequency Range
──────────────────────────────────────────────────── 4.3.3 Setting the Frequency Range The frequency range (frequency axis maximum value) can be set as follows. The frequency range corresponds to the time axis range (TIME/DIV) setting of the memory function. Screen: STATUS, Waveform display Procedure 1. Use the Menu keys to display the desired screen. 2. -
Page 75: Fft Number Of Points Setup
──────────────────────────────────────────────────── The cutoff frequency of the anti-aliasing filter is the same as the selected frequency range, except for the cases listed below. *1: Anti-aliasing filter is OFF. *2: Cutoff frequency is 20 Hz. *3: FFT Number of Points values of 2000, 5000 and 10,000 correspond to multiples of 1/2, 1/5 and 1/10, respectively. -
Page 76: Setting The Window Function
──────────────────────────────────────────────────── 4.3.5 Setting the Window Function The window function defines the segment of the input signal that will be processed. Window processing can be used to minimize leakage error. Screen: STATUS, Waveform display Procedure 1. Use the Menu keys to display the desired screen. 2. -
Page 77: Setting The Peak Function
──────────────────────────────────────────────────── 4.3.6 Setting the Peak Function Display the peak or maximum value of the input signal and analyzed results. This is available only when the Format is set to Single or Dual display. Screen: STATUS Procedure 1. Press the key to display the screen to be displayed. STATUS 2. -
Page 78: Selecting Reference Data
──────────────────────────────────────────────────── 4.3.7 Selecting Reference Data Select data to be used for FFT processing. Screen: STATUS Procedure 1. Press the key to display the STATUS screen. STATUS 2. Move the flashing cursor to the item. Reference 3. Use the function keys to make a setting. Function display Meaning... -
Page 79: Setting The Display Format
──────────────────────────────────────────────────── 4.3.8 Setting the Display Format You can set the format for displaying input signal waveforms on the screen and recording them on the printer. The SINGLE, DUAL, and NYQUIST formats are available. Screen: STATUS Procedure 1. Press the key to display the screen to be displayed. STATUS 2. -
Page 80: Setting The Averaging Function
──────────────────────────────────────────────────── 4.3.9 Setting the Averaging Function The averaging function allows capturing several instances of a waveform and determining the average. This makes it possible to eliminate noise and irregular signal components. Averaging for the time axis waveform and frequency axis waveform can be selected. - Page 81 ──────────────────────────────────────────────────── Frequency axis peak hold The specified number of samples are captured, and the peak value is held (stored) for each frequency. For details on summing averaging and exponential averaging, refer to NOTE Appendix 3.5. When averaging is used together with the waveform evaluation function, waveform evaluation is carried out after the specified averaging count is completed.
- Page 82 ──────────────────────────────────────────────────── Averaging and trigger mode (1) Trigger mode: SINGLE 1. After the key was pressed, data are captured whenever the trigger START conditions are fulfilled, averaging is carried out, and then the waveform is displayed. Collected waveform data is averaged with the FFT time axis waveform and FFT processing is performed.
-
Page 83: Setting The Interpolation (Dot-Line)
──────────────────────────────────────────────────── (3) Trigger mode: AUTO (Time axis waveform) When the key is pressed, data are captured even if trigger conditions START are not fulfilled after a certain interval. If averaging is applied to unsynchronized input signals, the result will be meaningless. (Frequency axis waveform) 1. -
Page 84: Setting The Waveform Evaluation
──────────────────────────────────────────────────── 4.3.11 Setting the Waveform Evaluation Display format can be set on single screen or Nyquist screen. GO (pass) or NG (fail) evaluation of the input signal waveform can be performed using an evaluation area specified by the user. This can serve to detect irregular waveforms. -
Page 85: Setting The Fft Analysis Mode
──────────────────────────────────────────────────── 4.3.12 Setting the FFT Analysis Mode Used to select the FFT calculation method. Procedure Screen: STATUS, Waveform display 1. Use the Menu keys to display the desired screen. 2. Move the flashing cursor to the item. FFT Mode 3. Use the function keys to make a setting. For details on analysis, please refer to 4.8 FFT Analysis Function. -
Page 86: Setting The Analysis Channel
──────────────────────────────────────────────────── 4.3.13 Setting the Analysis Channel Select the channel for FFT analysis. Procedure Screen: STATUS, Waveform display 1. Use the Menu keys to display the desired screen. 2. Move the flashing cursor to the item. 3. Use the function keys or Jog/shuttle control, select the channel. Function display Meaning... -
Page 87: Setting The X-Axis And Y-Axis Displays
──────────────────────────────────────────────────── 4.3.14 Setting the X-axis and Y-axis Displays Set the X and Y axis for display of FFT calculation results. Different units can be selected for the X and Y axis. With some FFT analysis modes, one of the axis cannot be set. When external sampling is used, the X-axis (horizontal axis) expresses the data count. - Page 88 ──────────────────────────────────────────────────── X and Y Axis Settings Available with each FFT Analysis Mode X Axis Y Axis FFT analysis mode (horizontal axis) (vertical axis) Storage Waveform (Time) (Linear) LIN-REAL LIN-IMAG LIN-Hz Linear Spectrum LIN-MAG LOG-Hz LOG-MAG PHASE LIN-REAL LIN-IMAG LIN-Hz RMS Spectrum LIN-MAG LOG-Hz LOG-MAG...
-
Page 89: Setting The Wave Colors
──────────────────────────────────────────────────── 4.3.15 Setting the Wave Colors Set the waveform display ON/OFF and the waveform color. Procedure Screen: STATUS, Waveform display 1. Use the Menu keys to display the desired screen. 2. Move the flashing cursor to the item. Wave 3. Use the function keys or Jog control, select the channel. Set the x-axis in the same way. -
Page 90: Setting The Display Scale
──────────────────────────────────────────────────── 4.3.16 Setting the Display Scale The display scale for showing the FFT processing result can either be set manually or automatically. Procedure Screen: STATUS 1. Press the key to display the STATUS screen. STATUS 2. Move the flashing cursor to the item. -
Page 91: Octave Filter Setting
──────────────────────────────────────────────────── 4.3.17 Octave Filter Setting When octave analysis has been selected, two different filter types can be chosen. The characteristics of both filter types are within ANSI CLASS 3 tolerance limits (1/3 octave only). Procedure Screen: STATUS 1. Select "OCTAVE ANALYSIS" in FFT analysis mode, and the Octave Filter item is shown. -
Page 92: Printout Of Fft Processing Results (When 8994 Printer Unit Is Installed.)
──────────────────────────────────────────────────── 4.4 Printout of FFT Processing Results (When 8994 PRINTER UNIT is installed.) 4.4.1 Setting the Print Mode Select the format, waveform, or numerical value should be used to output FFT processing results. Procedure Screen: PRINTER (1) Setting the printer format 1. -
Page 93: Setting The Auto Save Function
: Data are stored as text data. (Nyquist cannot be saved in the text format) Data stored in the text format is not readable by the 8855. 5. Set the file name. For the input method, refer to Section 5.4.3. - Page 94 ──────────────────────────────────────────────────── File names consist of 8 characters. With auto-save, since numbers are NOTE attached to the end of file names, long file names are truncated when this number is appended to the end of the file name. When auto-save is enabled, the storage channel cannot be selected. Data for the channel for which the waveform is displayed is saved.
-
Page 95: Settings On The Waveform Display Screen (Fft)
──────────────────────────────────────────────────── 4.6 Settings on the Waveform Display Screen (FFT) Explains the setting items on the Waveform display screen. For details, refer to Sections 4.3. When want to use the Jog/Shuttle control, press the select key. (The VALUE selection window is not displayed.) Setting items Selection Explanation... -
Page 96: Start And Stop Operation (Fft)
When the key is pressed once during measurement, the STOP 8855 acquires measurement data in an amount corresponding to the set recording length, and the FFT analysis is carried, and then the measurement is stopped. (FFT analysis result, auto printout, auto save are executed.) -
Page 97: Fft Analysis Function
──────────────────────────────────────────────────── 4.8 FFT Analysis Function 4.8.1 Storage Waveform [STR] Displays the time domain waveform of the input signal. Function Horizontal Time Time axis display cursor Indicates the value of the specified TIME/DIV frequency range. (Refer to the table "Frequency Range, Frequency Resolution, Window Width, Corresponding Time Axis Range"... -
Page 98: Linear Spectrum [Lin]
──────────────────────────────────────────────────── 4.8.2 Linear Spectrum [LIN] Displays the frequency domain waveform of the input signal, including magnitude and phase information. Major applications include: Determining the peaks of waveform frequency components Determining the levels of high and low harmonics Function Fa = (fa) = |Fa|exp(jθa) θa + jsin... - Page 99 ──────────────────────────────────────────────────── Examples Linear spectra waveforms Stored waveform Y-axis: LIN-REAL (X-axis: LOG-Hz) Y-axis: LIN-MAG (X-axis: LOG-Hz) Y-axis: LIN-IMAG (X-axis: LOG-Hz) Y-axis: LOG-MAG (X-axis: LOG-Hz) Y-axis: PHASE (X-axis: LOG-Hz) Nyquist ──────────────────────────────────────────────────── 4.8 FFT Analysis Function...
-
Page 100: Rms Spectrum [Rms]
──────────────────────────────────────────────────── 4.8.3 RMS Spectrum [RMS] Displays the frequency domain waveform of the input signal, including magnitude (effective value) and phase information. The LOG-MAG displays of RMS spectrum and Power spectrum express the same processing result. Major applications include: Determining the peaks of waveform frequency components. Determining the effective values of frequency components. -
Page 101: Power Spectrum [Psp]
──────────────────────────────────────────────────── 4.8.4 Power Spectrum [PSP] Displays the energy spectrum of the input signal, consisting of only magnitude information. Major applications include: Determining the peaks of waveform frequency components Determining the energy levels of high and low harmonics Function Gaa = Fa* Fa Fa*: complex conjugate of Fa Re (Fa): real number component of Fa... - Page 102 ──────────────────────────────────────────────────── Overall value The overall value is the total effective value obtained from the frequency spectrum contained in the input signal. It is obtained by taking the square root of the total of power spectra for all frequencies. (Overall value) = (Vrms) PSPo DC component PSPi ith AC component...
-
Page 103: Auto Correlation [Acr]
──────────────────────────────────────────────────── 4.8.5 Auto Correlation [ACR] Displays the degree of similarity between two points in the input signal separated by time difference (τ). Major applications: Detecting a periodic signal contained in a noisy signal with an improvement in signal-to-noise ratio. Checking the periodic signal components contained in a noisy waveform, and periodic noise. -
Page 104: Histogram [His]
──────────────────────────────────────────────────── 4.8.6 Histogram [HIS] Displays the frequencies of the magnitudes of sampled points. Major applications include: Determining waveform imbalance Determining whether a waveform is artificial or natural from the waveform distribution (most natural waveforms are regular sine waves). Function Volt Linear display of the measurement range of the input module. -
Page 105: Transfer Function [Trf]
──────────────────────────────────────────────────── 4.8.7 Transfer Function [TRF] Displays the transfer function (frequency characteristics) of the system being measured calculated from input and output signals. Nyquist diagrams can also be displayed, including magnitude and phase information. Major applications include: Determining filter frequency characteristics. Determining feedback control system stability through Nyquist diagrams. - Page 106 ──────────────────────────────────────────────────── Example Transfer function spectra waveform Stored waveform (output signal) Stored waveform (input signal) Y-axis: LIN-IMAG (X-axis: LOG-Hz) Y-axis: LIN-REAL (X-axis: LOG-Hz) Y-axis: LIN-MAG (X-axis: LOG-Hz) Y-axis: LOG-MAG (X-axis: LOG-Hz) Nyquist Y-axis: PHASE (X-axis: LOG-Hz) ──────────────────────────────────────────────────── 4.8 FFT Analysis Function...
-
Page 107: Cross Power Spectrum [Csp]
──────────────────────────────────────────────────── 4.8.8 Cross Power Spectrum [CSP] Displays the product of the spectra of two input signals. The magnitude and phase information of the frequency components that are common to both signals can be displayed. Major applications: Obtaining frequency components common to two signals. Function Gab = Fa* Fb... - Page 108 ──────────────────────────────────────────────────── Example Cross power spectra waveforms Stored waveform 1 Stored waveform 2 Y-axis: LIN-REAL (X-axis: LOG-Hz) Y-axis: LIN-IMAG (X-axis: LOG-Hz) Y-axis: LIN-MAG (X-axis: LOG-Hz) Y-axis: LOG-MAG (X-axis: LOG-Hz) Nyquist Y-axis: PHASE (X-axis: LOG-Hz) ──────────────────────────────────────────────────── 4.8 FFT Analysis Function...
-
Page 109: Cross Correlation [Ccr]
──────────────────────────────────────────────────── 4.8.9 Cross Correlation [CCR] Displays the degree of similarity between two points separated by a time difference (τ) on two signals. The degree of similarity is expressed as a function of the time difference (τ). Major applications: Obtaining the phase difference between two signals in time units. Obtaining a speed or distance by measuring the time delay. -
Page 110: Unit Impulse Response [Imp]
──────────────────────────────────────────────────── 4.8.10 Unit Impulse Response [IMP] Displays the frequency response of a system in the time domain. A response waveform equivalent to the unit impulse function is obtained by analyzing the input and output signals of the system being measured. Major applications Checking circuit time constants. -
Page 111: Coherence [Coh]
──────────────────────────────────────────────────── 4.8.11 Coherence [COH] Displays the output signal component that is coherent (interference possible) to the input signal, yielding a value from 0 to 1. Major applications include: Evaluation of transfer functions. Determining the contribution of individual input lines to the output of multi-input systems. -
Page 112: Octave Analysis [Oct]
In analog octave analysis, the octave band center frequencies and filter characteristics are determined according to the ANSI CLASS 3 standard. In the 8855, the power spectrum is measured first and bundling is then used to perform 1/1-octave or 1/3-octave analysis. This allows the following analysis... - Page 113 ──────────────────────────────────────────────────── Example Octave analysis waveforms Stored waveform 1/1 octave analysis 1/3 octave analysis ──────────────────────────────────────────────────── 4.8 FFT Analysis Function...
- Page 114 ──────────────────────────────────────────────────── Frequency ranges and measurable range widths (0: 1/1 OCT, 1: 1/3 OCT) 0: 1/1 OCT, 1: 1/3 OCT Band No. Center frequency 20 40 80 200 400 800 2k 4k 8k 20k 40k 80k 2 M 4 M 8 M 1/1 1/3 (Hz) 6.3 m...
- Page 115 ──────────────────────────────────────────────────── Band No. Center frequency 20 40 80 200 400 800 2k 4k 8k 20k 40k 80k 2 M 4 M 8 M 1/1 1/3 (Hz) 6.3 k 10 k 12.5 k 16 k 20 k 25 k 31.5 k 40 k 50 k 63 k...
- Page 116 ──────────────────────────────────────────────────── ──────────────────────────────────────────────────── 4.8 FFT Analysis Function...
-
Page 117: Chapter 5 Input Channel Settings
──────────────────────────────────────────────────── Chapter 5 Input Channel Settings ────────────────────────────────────────────────────... -
Page 118: Overview
──────────────────────────────────────────────────── 5.1 Overview This section describes the various input channel settings. This manual describes the advanced functions of the 8855. For information on commonly used functions, refer to the Basics edition (Quick Start Manual) of this manual. Item Screen Channel... -
Page 119: Setting The Variable Function
──────────────────────────────────────────────────── 5.2 Setting the Variable Function The variable function allows the user to modify the waveform position and size. The variable screen serves for setting the lower and upper limit of the waveform display range. The variable function can be set to ON or OFF for each channel individually. - Page 120 ──────────────────────────────────────────────────── Procedure Screen: ONE CH, LIST (CHANNEL) 1. Press the key to display the Channel (ONE CHAN CH, LIST) screen. Flashing cursor 2. Using the cursor key, move the flashing cursor to the variable position of the channel to be set. 3.
- Page 121 ──────────────────────────────────────────────────── Setting the value Screen: CHANNEL (ONE CH, LIST) 1. Using the cursor key, move the flashing cursor to /DIV Disp Limits 2. Select the ) key to numerical value input display the numerical value input screen. 3. Use the cursor keys and function keys to input numerical values.
-
Page 122: Scaling Function (System)
──────────────────────────────────────────────────── 5.3 Scaling Function (SYSTEM) The scaling function can be used to convert an output voltage from a sensor or similar into a physical quantity. The gauge scale (maximum and minimum values of vertical axis) and A/B cursor measurement values are displayed in the scaled units. Scaling can be performed for every channel. -
Page 123: Setting The Scaling Function
──────────────────────────────────────────────────── 5.3.1 Setting the Scaling Function (1) Setting the scaling function Method 1 Screen: CHANNEL (SCALING) 1. Press the key and move to the CHAN SCALING items of the menu screen to display the scaling settings screen. 2. Using the cursor key, move the flashing cursor to the channel to be set. - Page 124 ──────────────────────────────────────────────────── (2) Entering the numerical value 1. Move the flashing cursor to the item to be set. 2. Use the function keys to make the selection. Function display Meaning : Displays the numerical value input screen. Flashing cursor : Initializes the system. : Returns to the numerical values set one step before.
- Page 125 ──────────────────────────────────────────────────── Combination of the scaling and variable functions It is possible to combine the scaling and variable functions. When using the scaling and variable functions together, it is necessary to set the upper and lower limits of the physical amounts after first conversion (after scaling).
-
Page 126: Scaling Setting Example
──────────────────────────────────────────────────── 5.3.2 Scaling Setting Example The example below shows the type of scaling when the measurement range is set to 10 A using the 9018 CLAMP ON PROBE. Scaling method: 2-point method Setting: SCI or ENG Converting value: 0.2 (V) 10 (scale), 0 (V) 10 (scale) unit (eu): A... -
Page 127: Comment Function (Channel)
──────────────────────────────────────────────────── 5.4 Comment Function (CHANNEL) 5.4.1 Title Comment Entry Title comments of up to 40 characters can be included on the recording paper. Enabling title comment input prints the title on recording paper for all functions. "SET & COM" prints setup conditions (function, time axis range, magnification of time axis, and trigger time) along with the title. -
Page 128: Analog/Logic Channel Comment Entry
──────────────────────────────────────────────────── 5.4.2 Analog/Logic Channel Comment Entry Comments of up to 40 characters can be printed or displayed with waveforms for each channel. If "COMMENT" or "SET & COM" is selected, this comment will be included on the recording paper in all functions. "SET &... -
Page 129: Character Entry Procedure
──────────────────────────────────────────────────── 5.4.3 Character Entry Procedure The procedure for entering the characters for the comments, units, etc. is described. Procedure Screen: COMMENT (CHANNEL), SCALING (UNIT), FILE (SAVE NAME) 1. Use the cursor key to move the flashing cursor to the position where you want to input the comment (characters). -
Page 130: Copying Channel Settings
──────────────────────────────────────────────────── 5.5 Copying Channel Settings Copies any of input channel settings (voltage axis range, input coupling, low-pass filter, and variable function), scaling function settings, or comment function settings to another channel. Copying channel settings cannot be carried out between different modules. Flashing cursor Procedure Screen: LIST, SCALING, COMMENT (CHANNEL) -
Page 131: Setting The Waveform Display Screen
──────────────────────────────────────────────────── 5.6 Setting the Waveform Display Screen 5.6.1 Entering by F9 (CH.SET) Key Pressing the ) key, enables the measurement conditions for each channel CH.SET on the Waveform display screen to be set or changed. It is possible to make the settings, while monitoring the waveforms in real time on the Waveform display screen. -
Page 132: Entering By Ch.set Key
──────────────────────────────────────────────────── Setting the power monitor (when the 9549 FUNCTION UP DISK is installed) Waveform display color Waveform display graph Zero position Magnification/compression ratio of voltage axis. 5.6.2 Entering by CH.SET Key Procedure 1. Press the key to display the Waveform display screen. DISP 2. -
Page 133: Setting The Vernier Function
──────────────────────────────────────────────────── 5.6.3 Setting the Vernier Function With the vernier function, input voltage can be minutely adjusted to the desired value. When recording various physical quantities using noise, temperature, and acceleration sensors, this vernier function allows you to adjust amplitudes to assist with calibration. For example, use the vernier function when you want to convert an input voltage of 1.2 V to 1.0 V and display the converted value. -
Page 134: Setting The Probe Voltage Division Ratio
MEMORY HiCORDERs that use the 9665 and the 9666. ) Do not measure voltages that exceed the maximum input voltage, as the 8855 instrument could be damaged and an accidents resulting in injury or death could result. - Page 135 ──────────────────────────────────────────────────── Procedure Screen: LIST (CHANNEL) 1. Press the key to display the List (Channel) CHAN screen. 2. To display the optional settings screen, use the ) key. PAGE 3. Move the flashing cursor to the item to be Probe set. 4.
-
Page 136: Setting The 8951 Voltage/Current Unit
──────────────────────────────────────────────────── 5.8 Setting the 8951 VOLTAGE/CURRENT UNIT 5.8.1 Setting Voltage Measurement Procedure Screen: LIST, ONE CH (CHANNEL) Flashing cursor 1. Use the Menu keys to display the desired screen. 2. Move the flashing cursor to the item to be Mode set. - Page 137 ──────────────────────────────────────────────────── Procedure Screen: LIST, ONE CH (CHANNEL) 1. Use the Menu keys to display the desired screen. Flashing cursor 2. Move the flashing cursor to the item to be Mode set. 3. Select the model name of the clamp-on sensor or clamp-on probe to be used with the function keys.
-
Page 138: Setting The 8952 Dc/Rms Unit
──────────────────────────────────────────────────── 5.9 Setting the 8952 DC/RMS UNIT 5.9.1 Setting Voltage Measurement Procedure Screen: LIST, ONE CH (CHANNEL) 1. Use the Menu keys to display the desired screen. 2. Move the flashing cursor to the item to be Mode set. 3. Use the function keys to select Function display Meaning... - Page 139 ──────────────────────────────────────────────────── (2) Setting the response The response time can be selected from three levels, High Speed, Standard, or Low Speed. Normally, this selection is set to High Speed, but if the frequency is low or fluctuations are frequent, more stable display can be obtained by setting the response time to Standard or Low Speed.
-
Page 140: 8953-10 High Resolution Unit
──────────────────────────────────────────────────── 5.10 8953-10 HIGH RESOLUTION UNIT The 8953-10 HIGH RESOLUTION UNIT contains an internal anti-aliasing filter required for FFT analysis. Enable the anti-aliasing filter when doing FFT analysis. For details on other common settings, see Quick Start Section 6.3. Procedure Screen: LIST, ONE CH (CHANNEL) 1. -
Page 141: Setting The 8954 Voltage/Temp Unit
──────────────────────────────────────────────────── 5.11 Setting the 8954 VOLTAGE/TEMP UNIT A common GND is used for voltage and temperature input on WARNING each channel. When using the voltage and temperature inputs simultaneously, do not connect them both at the same time, as this may damage the object you are measuring. (You cannot measure the voltage and temperature simultaneously on the same channel.) 5.11.1 Setting Voltage Measurement... - Page 142 ──────────────────────────────────────────────────── (2) Setting reference junction compensation 1. Use the Menu keys to display the desired screen. Flashing cursor 2. Move the flashing cursor to the item to be set. 3. Use the function keys to make the selection. Function display Meaning : The 8954 performs reference junction compensation internally.
- Page 143 ──────────────────────────────────────────────────── Measurement range and measurement input upper and lower limits Note that the measurement input upper and lower limits change according to the measurement range. When the following upper and lower temperature limits are exceeded, the waveform is saturated. Measurement range 10 /DIV 100 /DIV Measurement input upper limit...
-
Page 144: Setting The 8955 F/V Unit
──────────────────────────────────────────────────── 5.12 Setting the 8955 F/V UNIT The 8955 F/V UNIT can measure the frequency, rotation speed, commercial power frequency, integral value, pulse duty ratio, and pulse width for each channel. (Only one setting type can be measured for each channel.) For details on common settings, see Quick Start section 6.3. - Page 145 3. Use the function keys to make the selection. (4) Setting the pull-up resistance Pull-up resistance is used when the 8855 is connected to an open-collector output signal. When ON is selected, the input terminal is pulled up by +5V. With most measurements, this option is set to OFF.
- Page 146 Frequency and rotation speed measurement results are displayed after a single cycle is verified. When measuring the phenomena called rotation stoppage with hold set to ON, the 8855 waits endlessly for measurement period verification, so the stoppage cannot be detected. When hold is set to...
-
Page 147: Integration Measurement Settings
3. Use the function keys to make the selection. (4) Setting the pull-up resistance Pull-up resistance is used when the 8855 is connected to an open-collector output signal. When ON is selected, the input terminal is pulled up by +5V. With most measurements, this option is set to OFF. -
Page 148: Pulse Duty Ratio Measurement Settings
3. Use the function keys to make the selection. (3) Setting the pull-up resistance Pull-up resistance is used when the 8855 is connected to an open-collector output signal. When ON is selected, the input terminal is pulled up by +5V. -
Page 149: Pulse Width Measurement Settings
──────────────────────────────────────────────────── be set. 3. Use the function keys to make the selection (4) Setting the level Select whether you want to measure duty ratio based on the HI level or the LO level. 1. Use the Menu keys to display the desired screen. 2. - Page 150 3. Use the function keys to make the selection. (4) Setting the pull-up resistance Pull-up resistance is used when the 8855 is connected to an open-collector output signal. When ON is selected, the input terminal is pulled up by +5V. With most measurements, this option is set to OFF.
-
Page 151: Chapter 6 Memory Segmentation Function
──────────────────────────────────────────────────── Chapter 6 Memory Segmentation Function This function divides the memory into separate blocks, each of which can be used for waveform recording. The recording length (DIV) has priority over the number of memory blocks. (A maximum of 1024 segments, or a maximum of 512 segments when using the recorder &... - Page 152 ──────────────────────────────────────────────────── Input signal capture is carried out continuously using the trigger, storing waveform data successively in each block. Any block in which an input signal is recorded can be called up on the display. During measurement, displaying, printing, and saving cannot be carried out until the recording data in all block is completed.
- Page 153 ──────────────────────────────────────────────────── Procedure Screen: MEMORY DIV (STATUS) (1) Select the Memory Segmentation 1. Press the key to display the Memory STATUS segmentation (MEMORY DIV) screen. 2. Move the flashing cursor to the position shown in the figure. 3. Use the function keys, and select Function display Meaning...
- Page 154 ──────────────────────────────────────────────────── (3) Set the number of segmentation. 1. Move the flashing cursor to the item. Division 2. Use the function keys or to set the number of splits. See item (2) of this section for details about the number of splits that can be set. Function display Meaning...
- Page 155 ──────────────────────────────────────────────────── (6) Setting ref blocks Waveform data recorded in multiple blocks can be displayed in a composite display. 1. Move the flashing cursor to the item. Ref Block 2. Use the function keys to make the selection. Function display Meaning : Disable ref block : Enable ref block : Turns off reference for all blocks.
- Page 156 STOP SINGLE 8855 is forcibly stopped. (Auto printout is not executed.) When auto save is enabled and the 8855 is forcibly stopped during measurement, the measurement data up to the point where the 8855 was forcibly stopped is saved automatically.
-
Page 157: Chapter 7 Calculation Function
──────────────────────────────────────────────────── Chapter 7 Calculation Function 7.1 Numerical Calculation (MEM) This performs calculation only on those waveforms in the memory. Once it performs calculation, it displays numerical results. When using A-B cursor, it performs waveform calculation only for the data between the cursors. (When the calculation range is specified.) The following 19 types of calculations are possible: (1) Average value, (2) RMS value, (3) Peak-to-peak value (4) Maximum value, (5) Time to maximum value, (6) Minimum value,... - Page 158 ──────────────────────────────────────────────────── Numerical calculation Operating Sequence Setting the waveform Disable numerical calculation. numerical calculation Enable numerical calculation. Setting for numerical calculation Disable printout result printout Enable printout Setting for numerical calculation Storing is disabled result saving Stored on floppy disk Stored on PC card Stored on external MO connected through SCSI External MO Stored on MO disk or hard disk...
-
Page 159: Making Settings For Numerical Calculation
──────────────────────────────────────────────────── 7.1.1 Making Settings for Numerical Calculation Numerical calculations results can be printed on the internal printer. Numerical calculations results can be saved in text format to the current directory selected in the File screen. For the file name to be saved, see Quick Start Section 10.7, "Saving the Data." Procedure Screen: STATUS (1) Set the numerical calculation. - Page 160 ──────────────────────────────────────────────────── 4. Make a selection from the function key display. Function display Meaning : Does not save calculation results : Saves the calculation results on a floppy disk : Saves the calculation results on a PC card : Saves the calculation results on the built-in MO disk or hard disk : Saves the calculation results on a external MO disk connected through a SCSI...
- Page 161 ──────────────────────────────────────────────────── Numerical calculation operations Average value The average value in the waveform data RMS value The RMS value of the waveform data Peak The peak-to-peak value of the waveform data Maximum value The maximum value in the waveform data Time to maximum The time from the trigger to the maximum value value Minimum value...
-
Page 162: Copying Calculations Settings
──────────────────────────────────────────────────── 7.1.2 Copying Calculations Settings Numerical calculation settings can be copied from one channel to another. Procedure Screen: MEASUREMENT (STATUS) 1. Press the key to display the numerical STATUS calculation screen. 2. Move the flashing cursor to the number of the calculation to be used as copy source. -
Page 163: Making Settings For Numerical Evaluation
──────────────────────────────────────────────────── 7.1.3 Making Settings for Numerical Evaluation Depending on the results of the numerical calculation, a GO (pass) or NG (fail) result is returned. Evaluation criteria can be set independently for each of the calculation sets No. 1 - No. 16. Procedure Screen: MEASUREMENT (STATUS) 1. - Page 164 ──────────────────────────────────────────────────── Evaluation result Interpret the numerical calculation evaluation results by the color of the numerical values. NG numerical values are red. Also, if a beeping sound has been set, you hear the sound whenever a NG occurs. When a NG occurs, the numerical values of the channel that experience the error are displayed red on the screen.
-
Page 165: Executing Numerical Calculation
Displays "Storing". Waveform displays after data corresponding to Storing measurement recording length have been stored in memory. data When the key is pressed twice during measurement, the 8855 STOP is forcibly stopped. (numerical calculation are not executed.) Displays "Calculating". Numerical calculation Displays numerical calculation result on the screen. - Page 166 ──────────────────────────────────────────────────── Calculation of data stored in memory Selecting the calculation Press the key to display the File screen. FILE Loading from the media Read the measurement data. See Quick Start Section 10.8. The measurement data stored in memory of the instrument is Internal memory data calculated.
-
Page 167: Waveform Calculation (Mem)
──────────────────────────────────────────────────── 7.2 Waveform Calculation (MEM) Waveform processing is possible only for the memory function. Processing result are displayed as a waveform. The maximum recording length allowing waveform processing calculation is 5000 divisions (20,000 divisions for 128 M words, 80,000 divisions for 512 Use the A/B cursors to specify the processing range for the waveform data within the maximum recording length . -
Page 168: Preparing For Waveform Processing
──────────────────────────────────────────────────── 7.2.1 Preparing for Waveform Processing Procedure Screen: WAVE CALC (STATUS) (1) Set the waveform calculation. 1. Press the key to display the waveform STATUS calculation screen. 2. Move the flashing cursor to Wave CALC 3. Use the function keys to make the selection. Function display Meaning... -
Page 169: Defining The Processing Equation
──────────────────────────────────────────────────── If the cursors are overlayed so that they form a single cursor, that point only NOTE is calculated. You cannot use horizontal line cursors to specify an area for calculation. If cursor A only is used, calculations are applied to the area from cursor A to the end of the measurement data. - Page 170 ──────────────────────────────────────────────────── Operators (For details, see Appendix.3.8.) Absolute value DIF2 2nd differential Exponential INT2 2nd integral Logarithm Sine Square root Cosine Displacement average Tangent ASIN Parallel displacement Arc-sine on time axis ACOS Arc-cosine 1st differential ATAN Arc-tangent 1st integral For multiplication, always use the " "...
-
Page 171: Copying An Equation
──────────────────────────────────────────────────── (3) Deleting an Equation 1. Move the flashing cursor to one of the Z1 - Z8 items. 2. Select 3. Make the setting with the function keys. Function display Meaning : Clear equation : Do not clear equation 7.2.3 Copying an Equation An equation to which an equation number has been assigned (copy source) can be copied to another equation number (copy target). -
Page 172: Setting The Channel For Recording Processing Results
──────────────────────────────────────────────────── 7.2.4 Setting the Channel for Recording Processing Results The calculation result of equations Z1 - Z8 can be recorded and displayed in a specified channel. Processing results can be recorded also in channels where no input module is installed (but the range of the "number of channels in use" setting cannot be exceeded). -
Page 173: Setting The Display Scale
──────────────────────────────────────────────────── 7.2.5 Setting the Display Scale Display scale can be set automatically or manually. The channel selected for recording is automatically set to variable display. (See Section 5.2) If MOV or SLI was used, the number of moved points must be specified. Procedure Screen: WAVE CALC (STATUS) (1) Setting the Display Scale... - Page 174 ──────────────────────────────────────────────────── (1) Setting the number of moved point 1. Move the cursor to the position of the number of moved point setting (MOV or SLI). 2. Make the setting with the function keys or the control. JOG/SHUTTLE For MOV (moving average): 1 to 4000 For SLI (parallel displacement): -4000 to +4000 Function display...
-
Page 175: Perform Waveform Processing
When the key is pressed once during measurement, the STOP 8855 acquires measurement data in an amount corresponding to the set recording length, and the measurement is stopped. (Waveform display, Waveform calculation are executed.) The maximum recording length allowing waveform processing calculation is... - Page 176 ──────────────────────────────────────────────────── Waveform processing of data in internal memory or media Select the calculating data Press the key to display the FILE screen. FILE Loading from media For details on LOAD, refer to Quick Start Section 10.8. Internal memory data Waveform calculation execute the stored measurement data. This setting calculates the measurement data between A and B Setting the calculating cursors.
-
Page 177: Chapter 8 Search Function
──────────────────────────────────────────────────── Chapter 8 Search Function ────────────────────────────────────────────────────... -
Page 178: View Function (View Key)
──────────────────────────────────────────────────── 8.1 View Function (VIEW key) 8.1.1 Position Display Indicates the position of the currently displayed waveform within the entire recording length. The trigger time, trigger position and A/B cursor position are displayed when using the vertical or trace cursors. When the recording length is 200 divisions: Trigger position A cursor B cursor... -
Page 179: Block Display
──────────────────────────────────────────────────── 8.1.2 Block Display When memory segmentation is being used, the memory block status is shown. Any block in which an input signal is recorded can be called up on the display. Procedure Screen: Waveform display 1. Press the ) key on the Waveform SEARCH display screen. -
Page 180: Trigger Search
──────────────────────────────────────────────────── 8.2 Trigger Search Allows you to set the triggering conditions and find the location that matches those conditions in the captured waveforms. This is set in the trigger screen. See Quick Start Chapter 7 for details about trigger settings. Procedure Screen: Waveform display, TRIGGER 1. - Page 181 ──────────────────────────────────────────────────── 5. You can specify the range of waveforms to search for. Move the flashing cursor on the position on the screen. Function display Meaning : Specifies the current position : Specifies the data start : Specifies the data end : Specifies cursor A : Specifies cursor B 6.
-
Page 182: Peak Search Function
──────────────────────────────────────────────────── 8.3 Peak Search Function Allows you to search for the captured waveform maximum and minimum values. Procedure Screen: Waveform display, TRIGGER 1. Press the ) key on the Waveform SEARCH display screen. 2. Press the ) key on the function key PEAK display. -
Page 183: Event Search
──────────────────────────────────────────────────── 8.4 Event Search This selection applies only to the Recorder mode or REC & MEM Function. An event mark is entered each time the key is pressed during START measurement in the Recording mode. (Event marks can also be entered using the external start terminal.) When the screen is set to REC&MEM, an event mark is automatically entered at the point where a MEM trigger has been activated. -
Page 184: Time Search
──────────────────────────────────────────────────── 8.5 Time Search This function searches acquired waveforms. You can search using the elapsed time since triggering or the date. Procedure Screen: Waveform display 1. Press the ) key on the Waveform SEARCH display screen. 2. Press the ) key on the function key EVENT display. -
Page 185: Moving Cursors To The Search Points
──────────────────────────────────────────────────── 8.6 Moving Cursors to the Search Points The A and B cursors can be moved to the search points. Procedure Screen: Waveform display 1. Display the A and B cursors other than horizontal cursors on the display screen. 2. Press the ) key on the function key SEARCH display. - Page 186 ──────────────────────────────────────────────────── ──────────────────────────────────────────────────── 8.6 Moving Cursors to the Search Points...
-
Page 187: Chapter 9 Waveform Evaluation Function
──────────────────────────────────────────────────── Chapter 9 Waveform Evaluation Function 9.1 Waveform GO/NG Evaluation (MEM, FFT Function, Power Monitor Function) The waveform evaluation function can be used from the Memory function (single screen, X-Y single screen), FFT function, or the Power monitor function (when the 9549 FUNCTION UP DISK is installed). GO (pass) or NG (fail) evaluation of the input signal waveform can be performed using an evaluation area specified by the user. - Page 188 ──────────────────────────────────────────────────── Trigger mode: SINGLE NOTE Measurement continues until stop mode conditions are fulfilled and then stops. Trigger mode REPEAT, AUTO Recording and waveform evaluation is carried out continuously. Press the key to terminate the measurement. STOP When "auto print" is set to ON, the waveform is printed out when operation stops.
- Page 189 ──────────────────────────────────────────────────── Waveform evaluation mode and stop mode Waveform evaluation mode Stop mode Stop on GO result Stop on NG result Return NG if any part of waveform leaves evaluation area GO&NG Stop on GO or NG result Stop on GO result ALL-OUT Stop on NG result Return NG if entire waveform leaves...
-
Page 190: Setting The Waveform Area
──────────────────────────────────────────────────── 9.2 Setting the Waveform Area To evaluate the waveforms, a evaluation area is required. Two methods are available: one is to load the already created evaluation area and settings, and the other is to create a new evaluation area. (1) Loading the already created evaluation area Procedure Screen: FILE... -
Page 191: Setting The Waveform Evaluation Mode
──────────────────────────────────────────────────── 9.3 Setting the Waveform Evaluation Mode Procedure Screen: STATUS 1. Move the flashing cursor to Comparison 2. Make the setting with the function keys. Function display Meaning : Disable waveform evaluation. : Return NG if any part of the waveform leaves the evaluation area. -
Page 192: Creating The Evaluation Area
──────────────────────────────────────────────────── 9.5 Creating the Evaluation Area Procedure Screen: Waveform display 1. Move the flashing cursor to the Comparison item. Press the ) key. edit 2. Use these commands to create the evaluation area. 3. When the area has been stored in memory, it can be used for waveform evaluation. - Page 193 ──────────────────────────────────────────────────── line Serves to draw a straight or polygonal line. 1. Press this key. 2. Use the cursor keys to move the pencil mark to the start point of the line. Pressing speed up accelerates the movement of the mark. If the area is not completely enclosed, adjacent areas will also be filled in.
- Page 194 ──────────────────────────────────────────────────── clear Clears a specified rectangular area of the editor screen. 1. Press this key. 2. Use the cursor keys to move the pencil mark to the start corner of the area to be erased. Pressing speed up accelerates the movement of the mark. 3.
-
Page 195: Chapter 10 Printout Of Measurement Data
──────────────────────────────────────────────────── Chapter 10 Printout of Measurement Data Printing is possible when the 8994 PRINTER UNIT is installed. Waveform data can be printed out in two formats: waveform or numeric. Seven different procedures can be used to print out the measured waveforms. On the printer, the print density can be changed in five steps. -
Page 196: Printout Of Measurement Data Operating Procedure
──────────────────────────────────────────────────── 10.1 Printout of Measurement Data Operating Procedure Settings on the STATUS screen Press the STATUS key to make the settings on the STATUS screen. Display format Single Display and record as one graph. (8 analog + 16 logic signals max.) Dual Display and record as two graphs. - Page 197 ──────────────────────────────────────────────────── Print Settings on the SYSTEM screen Waveform Setting the smooth print format Smooth-print yields a smooth- looking waveform printout, but Press the SYSTEM key to make the printing speed is reduced. settings on the SYSTEM screen. Numerical value See Quick Start Section 9.4. Setting the print interval When using numerical values, set the printing intervals.When...
-
Page 198: Setting The Status Screen (Printout)
──────────────────────────────────────────────────── 10.2 Setting the STATUS Screen (printout) 10.2.1 Setting the Display Format The style can be set for showing input signals on the screen display and recording them on the printer. The styles single, dual, quad, oct, X-Y single, X-Y quad are available. Procedure Screen: STATUS Flashing cursor... -
Page 199: Setting The Waveform Display Graph Position
──────────────────────────────────────────────────── 10.2.2 Setting the Waveform Display Graph Position Set which graph type to use when display format has been set to DUAL, QUAD or OCT screen display on the Status screen. Procedure Screen: ONE CH, LIST (CHANNEL) Flashing cursor 1. Press the key to display the Channel CHAN screen. -
Page 200: Setting The Channel Screen (Printout)
──────────────────────────────────────────────────── 10.3 Setting the CHANNEL Screen (printout) 10.3.1 Setting the Print Density If the data is to be output on the internal printer, any of four print densities may be set for twelve waveform display colors. The set print density determines waveform density on printouts or hard copies. -
Page 201: Comment Screen
──────────────────────────────────────────────────── 10.3.3 COMMENT Screen Three types of comment are available. If "COMMENT" or "SET & COM" is selected, this comment will be included on the recording paper in all functions. For details, see Section 5.4. NOTE ──────────────────────────────────────────────────── 10.3 Setting the CHANNEL Screen (printout) -
Page 202: Setting The System Screen (Printout)
──────────────────────────────────────────────────── 10.4 Setting the SYSTEM Screen (printout) The various printer settings can be made on the system's Printer screen. For details, see Quick Start section 9.4. ──────────────────────────────────────────────────── 10.4 Setting the SYSTEM Screen (printout) -
Page 203: Example Of Printer Output
This section explains the printer type and how to read the printout (in the case of a SINGLE format waveform display screen). 100 µs/DIV( 100 µs x 1) Trig:'01-03-28 12:00:00 MEMORY [HIOKI 8855 COMMENT 500 µs 1 ms 1.5 ms 200 mV f.s. - Page 204 ──────────────────────────────────────────────────── Advanced settings HIOKI 8855 MEMORY HiCORDER 2.5ms Upper '01 - 3 - 28 - 0017 ch2 COMMENT ch1 COMMENT ch1 COMMENT ch2 COMMENT chA1 COMMENT chA2 COMMENT Lower chA3 COMMENT chA4 COMMENT -7 V -4 V 1. Upper-lower print (ON) 2.
- Page 205 ──────────────────────────────────────────────────── Printing the List (MEM) Example ──────────────────────────────────────────────────── 10.5 Example of Printer Output...
-
Page 206: Printing Procedure
──────────────────────────────────────────────────── 10.6 Printing Procedure 10.6.1 Manual Print This mode serves to print waveform data from the internal memory. Memory function Measurement data from one measurement (entire recording length) are printed. Recorder function Measurement data stored in memory before the end of measurement are printed (2000 divisions max.). -
Page 207: Auto Print
──────────────────────────────────────────────────── 10.6.2 Auto Print Printout is carried out automatically after a waveform has been captured for the specified recording length. (MEM) Procedure Screen: PRINTER (SYSTEM) 1. Press the key to display the Printer SYSTEM screen. 2. Move the flashing cursor to the item. -
Page 208: Real Time Print
──────────────────────────────────────────────────── 10.6.3 Real Time Print The input waveform and data are printed out continuously in real time. (in Recorder function) Procedure Screen: PRINTER (SYSTEM) 1. Press the key to display the Status STATUS screen. 2. Move the flashing cursor to the Realtime Print item. -
Page 209: Partial Print
──────────────────────────────────────────────────── 10.6.4 Partial Print This function prints the waveform between the A and B cursors (vertical or trace cursors). The function is available also when the A/B cursors are currently outside the range displayed on screen. Printing is possible also when the print format is currently set to "numeric". -
Page 210: Screen Hard Copy
──────────────────────────────────────────────────── 10.6.5 Screen Hard Copy The display contents of the all screens can be printed out as is. Procedure Screen: All 1. Display the desired screen. 2. Press the key. COPY Even if the gauge is set to the List & Gauge function, the gauge is not NOTE printed out in the screen copy mode. -
Page 211: Chapter 11 Communication Settings
TCP. Further, because the 8855 provides an FTP service, you can use an FTP client from your PC to access the files in this instrument. - Page 212 ──────────────────────────────────────────────────── DHCP : Yes/No Host Name and Address setting Host Name (Up to 12 characters) : ____________ IP Address : ___.___.___.___ Subnet Mask : ___.___.___.___ (When using DHCP, you do not need to enter the IP address or subnet mask.) DNS setting : Yes/No IP Address(If Yes)
- Page 213 ──────────────────────────────────────────────────── Settings Make each setting prepared previously. After making each setting, move the cursor to Reset and press Execute on the GUI. DHCP DHCP is a method whereby devices automatically acquire and set their own IP address, etc. Enabling DHCP makes automatic acquisition and setting of an IP address and subnet mask possible when a DHCP server is operating on the same network as the device.
- Page 214 If the IP address is set to 0.0.0.0, DNS is used to search for the IP address. For example, names are set in the following format: gateway.hioki.co.jp In the case of this example, if ".hioki.co.jp" is omitted, DNS may not be able to identify the IP address.
- Page 215 If the IP address is set to 0.0.0.0, DNS is used to search for the IP address. For example, names are set in the following format: collect.hioki.co.jp. In the case of this example, if ".hioki.co.jp" is omitted, DNS may not be able to identify the IP address.
- Page 216 A straight cable cross-converter (9642 LAN CABLE accessory) can be used with this instrument. Connect it as illustrated below. NOTE Power for the 8855, and PC should be obtained from the same outlet. Otherwise, potential difference between grounds may cause malfunctions. ────────────────────────────────────────────────────...
-
Page 217: Ftp Service
──────────────────────────────────────────────────── 11.2 FTP Service This instrument provides FTP service by means of an FTP (File-Transfer- Protocol, RFC959 compatible) server. By using FTP client software from your PC, you can access the files stored on the media in this instrument. For information on how to use FTP on your PC, refer to the explanation provided with the FTP software. - Page 218 Wait until measurement is finished. Stop measurement using the 9333 remote control. Use the pre-software for starting and stopping measurement on this instrument planned to be provided on the HIOKI Web site. Use the following FTP SITE commands. SITE START: Starts measurement...
-
Page 219: Ppp Connection
Current IP on the PPP screen in Communications located in System Settings. For details on PC cards that can be used with the instrument, refer to HIOKI's Web site. (URL http://www.hioki.co.jp) Settings Settings can be broadly divided into the following two categories: Recorder -->... - Page 220 ──────────────────────────────────────────────────── Outbound settings If LAN is set as the save location for the Auto Save and Save buttons, when files are saved, the PC is dialed from the recorder and the data saved in the specified location. Two locations (A and B) can be registered as the dial destination, and dialing is performed according to the settings made in Pattern on the PPP settings screen.
- Page 221 ──────────────────────────────────────────────────── Inbound settings Set when the recorder is dialed from the PC. "Inbound" receipt permission Sets whether the recorder is able to receive data from an external source. "Inbound" user name and password Sets a user name and password used for authentication when receiving data.
-
Page 222: Pc Card Interface
──────────────────────────────────────────────────── 11.4 PC Card Interface Make settings for the RS-232C interface and GP-IB interface. Press the Next (F3) key on the Communications screen to display the screen for making PC card interface settings. When the PC card is inserted, it is automatically recognized, and you can make the necessary settings. - Page 223 APPENDIX 1 ──────────────────────────────────────────────────── Appendix Appendix 1 Error Messages The instrument produces two levels of message to indicate problems. These are distinguished as follows. Error messages The "ERROR" indication appears at the bottom of the screen, followed by the message. This remains until the cause of the error is removed, or the key is pressed.
- Page 224 APPENDIX 2 ──────────────────────────────────────────────────── WARNING 013: Disk full. The media is running low on storage space. Cannot save. Delete files or use a new media. WARNING 014: File is read only. This is a read-only file. Save or delete is not possible. WARNING 015: General failure.
- Page 225 APPENDIX 3 ──────────────────────────────────────────────────── WARNING 064: The number of clamps Check the number of clamps that can be used, and make sure that can be used is limited. you do not use more than this number. WARNING 065: The overlay and Turn off the Roll mode.
- Page 226 Waveform expressed as High and Low level Logical formatting Formatting that writes basic file structure information to the physically- formatted disks, making them compatible for use with the 8855 system. Low-pass filter Filter that passes through only signals below a certain frequency...
- Page 227 APPENDIX 5 ──────────────────────────────────────────────────── Ripple component AC component of noise Sampling Measuring an analog waveform at regular intervals Sampling rate Rate at which sampling carried out; sampling frequency Scaling Conversion of voltage value into a specified unit Storage Storing measurement data in the internal memory Thermal head Print head of thermal printer Threshold value...
- Page 228 ──────────────────────────────────────────────────── Appendix 3 Reference Appendix 3.1 Sampling The 8855 converts the input signal to a digital value, then carries out all internal processing digitally. This process of converting an analog signal to digital values is termed sampling. Sampling measures the magnitude of the signal at fixed time intervals (sampling periods).
- Page 229 APPENDIX 7 ──────────────────────────────────────────────────── Appendix 3.3 Measurement Limit Frequency As a general rule, to ensure that sampling catches the peaks of a typical sine wave input on the display, more than 25 samples are required for each input cycle. The measurement limit frequency changes depending on the time axis range. Measurement TIME/DIV Sampling period...
- Page 230 APPENDIX 8 ──────────────────────────────────────────────────── Appendix 3.4 Recorder Function One division is equal to 100 samples. One piece of sample data collected using the recorder function contains the maximum and minimum voltage obtained in the set sampling period. Therefore, this data is of a certain width. 1 2 3 4 ..
- Page 231 APPENDIX 9 ──────────────────────────────────────────────────── Appendix 3.5 Averaging Equations For time axis averaging in memory functions, summing averaging is synchronized by the trigger. If trigger synchronization is not performed, the results will be meaningless. Summing averaging Captured data are added sequentially and the sum is divided by the number of samples.
- Page 232 APPENDIX 10 ──────────────────────────────────────────────────── Appendix 3.7 Waveform Parameter Calculation Details (1) Average value Calculates the average value (V) of the waveform data. Σ i = 1 average value number of data samples i-th data of the source channel (2) RMS value Calculates the RMS (effective) value (V) of the waveform data.
- Page 233 APPENDIX 11 ──────────────────────────────────────────────────── (10) Rise time (11) Fall time From the captured waveform data, the 0% and 100% level is determined, and the rise time (s) is taken as the time required to go from 10% to 90% (fall time: from 90% to 10%). In the captured waveform data, the first rising slope (or falling slope) is used to make the calculation.
- Page 234 APPENDIX 12 ──────────────────────────────────────────────────── (14) X-Y area value Calculates the area (V ) after X-Y plotting. The waveform is plotted on the X-Y screen, and the area enclosed by the plot lines is calculated. In single, dual, or quad screen, the A/B cursors (vertical, trace) can be used to specify the range (see Quick Start Section 8.2.) for X-Y plotting and area calculation.
- Page 235 APPENDIX 13 ──────────────────────────────────────────────────── (17) Duty Ratio The ratio is calculated according to the time difference between the point where the rising waveform intersects the set level and the intersection of the next opposite slope. It can also be calculated according to the time difference between the point where the falling waveform intersects the set level and the intersection of the next opposite slope.
- Page 236 APPENDIX 14 ──────────────────────────────────────────────────── Appendix 3.8 Details on Operators This section describes the operators used in waveform operation. The parameter "bi" shows the operational result, and "di" shows the source channel, respectively, in which "i" indicates the serial number of data. (1) The four arithmetical operations (+, -, * , /) According to the operators set, the four arithmetical operations are performed.
- Page 237 APPENDIX 15 ──────────────────────────────────────────────────── (8) Differentiation once (DIF) (9) Differentiation twice (DIF2) 1st and 2nd differential are calculated using the 5th-order Lagrange interpolation equation, whereby data from a range of five surrounding points are used to determine the value of the current point. Data corresponding to sample time t are taken as d and used for...
- Page 238 APPENDIX 16 ──────────────────────────────────────────────────── 2st integral Point t Point t = (I )h/2 Point t = (I )h/2 + (I )h/2 = II + (I )h/2 Point t = II + (I )h/2 to II processing result data (12) Sine (SIN) = sin(d ) (i = 1, 2, ..
- Page 239 APPENDIX 17 ──────────────────────────────────────────────────── Appendix 3.9 FFT Function FFT stands for Fast Fourier Transformation, which is a calculation method used to decompose a time-domain waveform into frequency components. By performing FFT calculation, various calculations can be performed. Concept of time domain and frequency domain The signals measured by this memory recorder have values which correspond to time, that is the signals are functions of time.
- Page 240 APPENDIX 18 ──────────────────────────────────────────────────── Application of Fourier transform (transfer function, unit-impulse response) As an application of Fourier transform, this section describes a steady-state response in a static linear system. fin(t) h(t) fout(t) Input Output ω ω ω Fin( Fout( fin(t): time function of input (source signal) fout(t): time function of output (response function) h(t): unit impulse response of linear system τ...
- Page 241 1/2 of the sampling frequency. Such a low-pass filter is called an anti-aliasing filter. The input module incorporates an anti- aliasing filter and therefore allows the 8855 to perform FFT analysis without being subject to aliasing. ──────────────────────────────────────────────────── Appendix 3 Reference...
- Page 242 APPENDIX 20 ──────────────────────────────────────────────────── When an anti-aliasing filter is not used. This is a spectral artifact that occurs as a result of aliasing of the high frequency component of a signal with the A/D converter sampling rate. Although visible during measurement, it does not exist in reality. Because no anti-aliasing filter is present, fine square waves are monitored through the high-frequency amplifier, so the corners of square waves include high-frequency components.
- Page 243 APPENDIX 21 ──────────────────────────────────────────────────── Window processing Fourier transform is defined as the integration from negative infinity to positive infinity, but in actual measurement this calculation is not possible. Therefore only a limited segment of the continuous signal is taken for processing. This is called window processing. The FFT algorithm assumes that the data of that limited segment are repeated and defines the input signal using a periodic function for determining the frequency spectrum.
- Page 244 To minimize the leakage error, a suitable window should be chosen which matches the type of input signal. Possible window types include rectangular, Hanning, exponential, flat-top, minimum, force, etc. In the 8855, three window functions (rectangular, Hanning, exponential) are available. Generally, the rectangular window function is most useful for single waveforms, the Hanning window function for continuous waveforms, and the exponential window function for attenuated waveforms.
- Page 245 APPENDIX 23 ──────────────────────────────────────────────────── Hanning window Input waveform Waveform assumed by FFT processing Hanning window Waveform after window processing Exponential window Input waveform Waveform assumed by FFT processing Exponential window Waveform after window processing ──────────────────────────────────────────────────── Appendix 3 Reference...
- Page 246 APPENDIX 24 ──────────────────────────────────────────────────── Appendix 4 Waveform Viewer (Wv) The waveform viewer provides a simplified view of data transferred to a PC by remote control or data acquisition. The viewer has a CSV conversion function. Converted files may be read by a spreadsheet program. System requirements For a PC running Windows 95, 98, Me, Windows NT4.0 SP3 or later, Windows 2000, or Windows XP...
- Page 247 APPENDIX 25 ──────────────────────────────────────────────────── Appendix 4.1 Starting the Waveform Viewer In the Windows Start menu, select [Programs] - [HIOKI] - [Wv]. This starts the waveform viewer application. To close the waveform viewer application, in the [File] menu select [Exit]. You can also click the Close button at the top right corner of the window.
- Page 248 APPENDIX 26 ──────────────────────────────────────────────────── Appendix 4.2 Waveform Viewer Menus The following is the complete menu tree of the waveform viewer application. [File] [ Open ] Refer to Appendix 4.3. [ Save All ] Refer to Appendix 4.4. [ Save Between Cursors ] Refer to Appendix 4.4.
- Page 249 APPENDIX 27 ──────────────────────────────────────────────────── Right-click with the mouse in the waveform display screen for the following functions. Right-click with [ Wave Control Panel ] the mouse [ Properties ] [ Trace ] [ Block list ] [ Zoom In ] [ Zoom Out ] [ Set Magnification ] [ Jump ] [ Trig ]...
- Page 250 APPENDIX 28 ──────────────────────────────────────────────────── Appendix 4.3 Using the Waveform Viewer Waveform display To display a waveform it is first necessary to select the file to be displayed. In the [File] menu, select [Open], to display the file selection dialog box. Select a waveform file, and click Open to read in the file, and display the waveform.
- Page 251 APPENDIX 29 ──────────────────────────────────────────────────── Changing waveform scale and position (Waveform Control Panel) You can adjust the display for each channel separately. In the [View] menu, select [Wave Control Panel] to display a dialog box. This indicate the list of channel. When a check mark is present the corresponding channel is displayed.
- Page 252 APPENDIX 30 ──────────────────────────────────────────────────── Waveform jump function Select [View], then [Jump] to jump to the trigger position or the positions of the A or B cursors. Time Notation Select [View], then [Time Notation]. You can select the time notation on the waveform display screen.
- Page 253 APPENDIX 31 ──────────────────────────────────────────────────── Appendix 4.4 Conversion to CSV Format You can convert displayed waveform data to a CSV format file. Once in CSV format, the file can be loaded into spreadsheet or other software for further processing. You can either convert the whole data file or a range selected with the cursors.
- Page 254 APPENDIX 32 ──────────────────────────────────────────────────── Appendix 4.5 Batch Conversion You can convert multiple waveform files CSV files. 1. Select [File] from the menu bar, then select [Batch Conversion] from the File menu. 2. Select the desired files from the file list. To select two or more files, left- click on the desired files while holding down the Shift or Control key.
- Page 255 APPENDIX 33 ──────────────────────────────────────────────────── Appendix 5 Size of a Waveform File In the memory function (Binary data) Size of a file = header + data Size of a header = number of W header + number of B header + number of C header + number of L header + number of S header + number of P header Number of W header = 1 Number of B header = To save in either analog or logic is 1;...
- Page 256 APPENDIX 34 ──────────────────────────────────────────────────── In the recorder function (Binary data) Size of a file = header + data Size of a header = number of W header + number of B header + number of C header + number of L header + number of S header + number of P header Number of W header = 1 Number of B header = To save in either analog or logic is 1;...
- Page 257 APPENDIX 35 ──────────────────────────────────────────────────── In the memory function (text data) Size of a file = header + data Size of a header = 170+27*number of analog channels+64*number of logic probes Size of a data = (17+15 x number of analog channels+9 x number of logic probes) x (recording length[DIV] x 100+1) Number of analog channels = 4 : 512 Mwords (expansion...
- Page 258 APPENDIX 36 ──────────────────────────────────────────────────── In the Recorder function (text data) (bytes) Size of a file = header + data Size of a header = 170 + 27 x number of analog channels + 64 x number of logic probes Size of a data = (17+30 x number of analog channels+18 x number of logic probes) x (recording length[DIV] x 100+1) Number of analog channels = 4 : 512 Mwords (expansion...
- Page 259 INDEX 1 _____________________________________________________________________________________________ INDEX - A - Channel mode Character entry A/B cursor Clamp on probe 17,21,116 Coherence Comment AC power supply Accessories Commercial power frequency measurement 124 Additional recording function Common mode APPENDIX4 Aliasing APPENDIX6,APPENDIX18 Communication Analysis channel Conversion cable Analysis mode Conversion ratio method Copy...
- Page 260 INDEX 2 _____________________________________________________________________________________________ Duty ratio 141,APPENDIX13 Head up/down Histogram - E - Hold Host name - I - Editor command End block Error message APPENDIX1 IP address Evaluation result Index file Event mark Integration Event search Interface 191,202 Exponential 56,APPENDIX22 Interpolation Exponential averaging 60,APPENDIX9...
- Page 261 INDEX 3 _____________________________________________________________________________________________ RS-232C - O - Rated supply frequency 11,13 Rated supply voltage 11,13 Octave analysis Real time print 44,188 Octave filter Recorder & memory function Operator 150,APPENDIX14 Recording length 37,133 Recording paper ix,24,26 Option Rectangular 56,APPENDIX22 - P - Ref block Reference data PC card...
- Page 262 INDEX 4 _____________________________________________________________________________________________ Time search Time to maximum value 141,APPENDIX10 Time to minimum value 141,APPENDIX10 Title comment Transfer function Trigger mode 62,136 Trigger search - U - Unbalanced input APPENDIX5 Unit impulse response Upper-lower print User name - V - Variable function Variable recording length Vernier function...
Need help?
Do you have a question about the 8855 and is the answer not in the manual?
Questions and answers