Table of Contents
Advertisement
Quick Links
Advertisement
Table of Contents

Related Manuals for Deviser E8900A


Summary of Contents for Deviser E8900A
- Page 1 E8900A 5G NR Spectrum Analyzer User Manual Ver:1.04...
- Page 3 E8900A 5G NR Spectrum Analyzer User Manual Safety requirements Security Level Will be using this manual uses the following security prompt. Warming This prompted some to note specifically refers to methods of operation hazard issues. Before fully aware of and meet...
- Page 4 E8900A Spectrum Analyzer User Manual Warranty Equipment is guaranteed for two years after sale. In two years warranty period, the user can buy extended warranty, the warranty period of the battery is one year. Manufacturers or agents be responsible for necessary adjustment or inspection, equipment for authorized inspection before packing, return the user.
- Page 5 E8900A 5G NR Spectrum Analyzer User Manual Warranty restrictions Incorrect use or improper maintenance (including additional software or user interface), and the user disassembles the machine by themselves, the company will not be under warranty. Two years warranty, calibration, repair services, consultation is free of charge.
- Page 6 After a period of use, if you have any needs, please query. The company reserves all rights reserved, not be copied without the prior written consent of, adaptation or translation. © Tianjin Deviser Electronics Instrument Co., Ltd. All rights reserved. Printed in CHINA. Jan. 2020.
-
Page 7: Table Of Contents
E8900A 5G NR Spectrum Analyzer User Manual Contents GENERAL DESCRIPTION ............. 1 ......... 2 UNCTION INTRODUCTION ............2 REVENTIVE ......3 NSPECTION AND CALIBRATION INSTRUCTIONS ..........3 PROTECTION METHODS ACQUAINTED WITH THE INSTRUMENT ........4 ..........5 NTRODUCE THE INSTRUMENT Introduction front panel ........ - Page 8 E8900A Spectrum Analyzer User Manual BW) ........30 CCUPIED ANDWIDTH Parameters Set ..........31 3.3.1 3.3.2 Meas Set ............31 Marker .............. 33 3.3.3 (ACLR) ...... 33 DJACENT HANNEL EAKAGE ATIO Parameters Set ..........34 3.4.1 Meas Set ............34 3.4.2...
- Page 9 E8900A 5G NR Spectrum Analyzer User Manual 4.1.1Parameters Set ............50 4.1.2 Marker ............... 50 4.1.3Meas Set ..............51 DPS ................51 4.2.1Parameters Set ............52 4.2.2Meas Set ..............52 4.2.3Marker ............... 52 ..............53 RIENTATE 4.3.1Parameter Set ............53 4.3.2Meas Set ..............
- Page 10 E8900A Spectrum Analyzer User Manual Parameter Set ........... 61 5.2.1 Mode Set ............61 5.2.2 5.2.3 Meas Set ............61 ............. 61 OWER VS Parameter Set ........... 62 5.3.1 Meas Set ............62 5.3.2 CH P ............. 62 ONTROL OWER Parameter Set ...........
- Page 11 E8900A 5G NR Spectrum Analyzer User Manual Parameter Set ........... 69 7.1.1 Meas Set ............70 7.1.2 SS O ..............71 UTDOOR Parameter Set ........... 71 7.2.1 Meas Set ............72 7.2.2 ............73 ETCLEAN UTDOOR Parameter Set ........... 74 7.3.1...
- Page 12 E8900A Spectrum Analyzer User Manual ..............91 NTER ETECT Paremeter Set ........... 92 8.2.1 8.2.2 Meas Set ............95 ............98 NALYZER Parameter Set ........... 99 8.3.1 Meas Set............99 8.3.2 ............101 OWER Parameter Set ..........102 8.4.1 Meas Set............103 8.4.2...
- Page 13 E8900A 5G NR Spectrum Analyzer User Manual 10.1 ..............117 NALOG 10.2 ..............120 IGITAL FILE MANAGEMENT .............. 123 11.1 ............123 ILE MANAGEMENT 11.2 ..............124 AVING SYSTEM SETTING ..............127 12.1 ....... 127 YSTEM INFORMATION AND ETTING System information ......... 127 12.1.1...
-
Page 15: General Description
E8900A 5G NR Spectrum Analyzer User Manual 1 General description This chapter will focus on the following main elements: Main functions Preventive Care Inspection and calibration instruments ESD Protection methods... -
Page 16: Main Function Introduction
ID, signal power, signal to noise ratio and other indicators can be measured by space interface or radio frequency. E8900A also has the function of interference test, which can be combined with DF series antenna to realize the positioning and search of interference signals. -
Page 17: Inspection And Calibration Instructions
1.3 Inspection and calibration instructions All branches or offices of Deviser Instruments are responsible for the maintenance and calibration of the instrument once a year. In order to ensure the normal operation of the instrument, we recommend customers to do periodic maintenance and calibration. -
Page 18: Acquainted With The Instrument
E8900A Spectrum Analyzer User Manual 2 Acquainted with the Instrument This chapter will introduce the overview of E8900A spectrum analyzer, so that users can get familiar with the instrument. This chapter will focus on the following main contents: Introduce the instrument ... -
Page 19: Introduce The Instrument
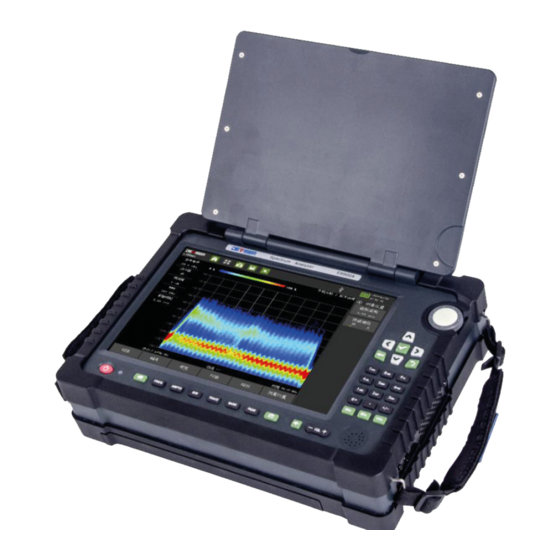
E8900A 5G NR Spectrum Analyzer User Manual 2.1 Introduce the instrument The E8900A spectrum analyzer can work continuously for about 2 hours when the battery is fully charged, and can also work while charging through the AC-DC power adapter. Warning: users can only use power adapters and chargers licensed by Deviser company. - Page 20 E8900A Spectrum Analyzer User Manual Start up: Press the red power button on the front panel for 2 seconds, the power indicator lights up, the instrument will start, wait for a few seconds, and the instrument will enter the measurement interface.
-
Page 21: Introduction Connector
E8900A 5G NR Spectrum Analyzer User Manual 2.1.2 Introduction connector 2.1.2.1 The upper panel Fig.2-2 the upper panel 1 USB2.0 Above the instrument, there is a USB2.0 interface, which can be used to insert USB disk, store status files and image files, and import building figures and maps. - Page 22 E8900A Spectrum Analyzer User Manual 6 IF output IF output interface. 7 RF input 50ΩN-type female connector, the maximum input +30dBm, ±50VDC. 8 Aviation plug Antenna data and control interface. 2.1.2.2 The left panel On the left side of the instrument, there are two USB2.0 interfaces, which are used to insert USB disk, store files such as status files and image files, and import files such as building figure and maps.
-
Page 23: User Interface
E8900A 5G NR Spectrum Analyzer User Manual Warning: Users can only use power adapters and chargers licensed by Deviser company. Make sure the outlet is clean and dry. Plug is very hot, should immediately disconnected, stop using. Non-professionals should not open the equipment shell and battery compartment. -
Page 24: Measurement Mode Selection
E8900A Spectrum Analyzer User Manual Fig.2-5 User interface ① ② Parameter display Main menu Settings area area ③ ④ Sub-menu Settings MENU touch key area ⑤ ⑥ Snapshot touch key File management ⑦ File saving ⑧ Screen brightness control ⑨... - Page 25 E8900A 5G NR Spectrum Analyzer User Manual Fig.2-6 Measurement mode selection...
-
Page 26: Spectrum Analysis
Note: 1. If the input signal is too strong, it will damage the input attenuator and input mixer of the instrument. The upper limit of input power of E8900A spectrum analyzer is +30dBm MAX. 2. If the DC voltage transmitted with the signal input cable is too high, it may damage the input attenuator. -
Page 27: Swept Sa
E8900A 5G NR Spectrum Analyzer User Manual 3.1 Swept SA 3.1.1 Based parameter set Swept SA measurement mainly measures the amplitude-frequency characteristics of signals. It mainly involves the frequency and amplitude buttons located at the bottom of the panel. Frequency Click [Swept SA] to enter the measurement interface, click [Frequency], and press <... - Page 28 E8900A Spectrum Analyzer User Manual Span refers to the current measurement frequency range of the instrument. Under the < Span > menu, click < Span > and set the span in the menu that pops up at the top right of the screen. The maximum input range is 9GHz, and the minimum can be set to 0Hz.
- Page 29 E8900A 5G NR Spectrum Analyzer User Manual The default frequency step is 1/10 of the span, so changing the frequency will move one grid at a time. When you set to manual, you can change the current frequency step value. Three ways to change the frequency step: manual input, direction keys and wheel keys.
- Page 30 E8900A Spectrum Analyzer User Manual Users can click the < Amptd > menu, click < Amptd >, select < Ref >, and input value in the reference level input box. Also step through the direction key and wheel key. (2) Level Offset Compensation values for attenuator or amplifiers connected to input ports.
-
Page 31: Measurement Parameter Set
E8900A 5G NR Spectrum Analyzer User Manual attenuator should be at least 10 dB, otherwise the instrument itself will produce distortion or even be damaged! When the attenuator is manual, a "#" mark will be added to the left attenuator parameter display area. Similar RBW, VBW and sweep time are preceded by a "#"... - Page 32 E8900A Spectrum Analyzer User Manual Fig.3-3 BW < BW> (1) RBW Resolution bandwidth, also known as RBW, refers to the spectrum analyzer IF filter bandwidth. RBW determines the nearest distance between two adjacent signals that the instrument can distinguish. If the signal distance is less than RBW, it will not be able to distinguish.
- Page 33 E8900A 5G NR Spectrum Analyzer User Manual Click the <BW> menu and click the <RBW> button, which can be set by manual input, direction key and wheel key. (2) VBW The video bandwidth (VBW) is useful for observing signals in noise. It is a low pass filter after IF detection, which is used for noise averaging processing.
- Page 34 E8900A Spectrum Analyzer User Manual Fig.3-5 Sweep < Sweep> (1) Sweep Time Sweep time mainly depends on the span, RBW, VBW, it is proportional to the span and inversely proportional to RBW, and inversely proportional to RBW and VBW minimum value. When the span is equal to zero, the sweep time can be set arbitrarily.
- Page 35 E8900A 5G NR Spectrum Analyzer User Manual (5) Trig Mode Users can click the < Sweep > menu and select < Trig Mode > to set the trig mode, providing a choice of Free Run, External and GPS. User also can set the Trig delay.
- Page 36 E8900A Spectrum Analyzer User Manual Fig.3-6 Multiple trace < Dete> (1)Sample: Sample detection is to display the original sampled data completely without any operation, which is the fastest scanning speed compared with other detection. It is to display a sampling point randomly selected from all sampling points contained in each pixel of the instrument.
-
Page 37: Meas Set
E8900A 5G NR Spectrum Analyzer User Manual Neg-Peak detection takes the minimum sampling point from each pixel point and displays it. Although most spectrum analyzer provide this detection, it is not commonly used. Neg-Peak detection can distinguish weak continuous sinusoidal signal from noise, which can well suppress the display noise and show the minimum level of noise fluctuation. -
Page 38: Marker
3.1.4 Marker 1Marker E8900A can be set up to 6 Markers open at the same time. Touch the menu of Marker at the bottom of the screen and click [Marker]. Under the sub-menu, select one of the Markers from M1 to M6 as the active marker. - Page 39 E8900A 5G NR Spectrum Analyzer User Manual Fig.3-8 Marker < Marker> (1) Normal Click <Normal>, the selected marker can be stepped by moving arrow keys and wheel keys, and the frequency and amplitude value of the position of the Marker will be displayed, while in the zero-span mode, the time and amplitude value will be displayed.
- Page 40 E8900A Spectrum Analyzer User Manual When the normal marker is in the selected state, click < Marker to > sub-key, the sub-menu will pop up, select < Rev Level> sub-key to set the level of the current marker as the reference level, select < Center Freq > key, the frequency of current marker directly jumps to the center frequency.
-
Page 41: Channel Power
E8900A 5G NR Spectrum Analyzer User Manual (3)Track Click the < trace > and set it to the "on" state to automatically find a new peak in each field. If it is in the "off" state, the horizontal position of the marker will not change any more. -
Page 42: Parameters Set
E8900A Spectrum Analyzer User Manual Fig.3-10 Channel Power 3.2.1 Parameters Set Under the < Channel Power > measurement, users can refer to the parameters set in the Swept SA. 3.2.2 Meas Set 1 Integ BW Sets the integration bandwidth for the channel power measurement. - Page 43 E8900A 5G NR Spectrum Analyzer User Manual Fig.3-11 Burst RF setting menu Trig Slope: Sets the trigger polarity. Tap “Rise” to trigger on a rising edge, and “Fall” to trigger on a falling edge. Position: Sets the trigger line position. Adjust with the rotary knob or arrow keys.
-
Page 44: Marker
E8900A Spectrum Analyzer User Manual 4 Signal Standard Tapping the Signal submenu key opens the Signal Standard submenu, enabling users to select a specific signal standard from the Select Signal list, as well as the specific channel number and respective link, downlink or uplink. -
Page 45: Parameters Set
E8900A 5G NR Spectrum Analyzer User Manual Fig.3-13 Occupied bandwidth After capturing a group data. System will calculate the total power in all span firstly. Then find the max point of power in all data, the interval between this point and frequency center is frequency offset. - Page 46 E8900A Spectrum Analyzer User Manual Fig.3-14 Measurement setting 1 Integ BW Sets the integration bandwidth for the channel power measurement. 2 OBW Power Sets the percentage of power for calculating the occupied BW. 3 X dB: Sets the dB Down level for calculating the occupied BW.
-
Page 47: Marker
E8900A 5G NR Spectrum Analyzer User Manual Fig.3-15 Burst RF setting 3.3.3 Marker Users can refer to the marker function under Swept SA and Channel power measurement. 3.4 Adjacent Channel Leakage Ratio (ACLR) Adjacent channel power ratio refers to the ratio between the power of main channel and that of adjacent channels. -
Page 48: Parameters Set
E8900A Spectrum Analyzer User Manual Fig.3-16 ACLR measurement 3.4.1 Parameters Set Under the < Channel Power > measurement, users can refer to the parameters set in the Swept SA. 3.4.2 Meas Set 1 Meas Set Tapping the Meas Set softkey opens up a dialog box enabling the user to setup the ACLR measurement. - Page 49 E8900A 5G NR Spectrum Analyzer User Manual Fig.3-17 measurement setting Sig Std:The instrument prefabricates the templates of various communication systems. By selecting the communication mode in the template, parameters can be set in one key mode. Carr BW:Set the spectrum width of the carrier frequency signal to be measured.
- Page 50 E8900A Spectrum Analyzer User Manual Use Default: After clicking, the parameter setting will automatically adjust to the default initial state of the signal type of the signal meter. 2 Limit Under ACLR measurement, click the [Meas Set] menu, click the < Limit >...
-
Page 51: Marker
E8900A 5G NR Spectrum Analyzer User Manual Or: Absolute or relative qualification is qualified. Only the left and right adjacent roads are qualified as the adjacent roads. The comprehensive result of the qualified line on the top of the screen is to check whether all the adjacent channels of the enabled line are qualified. -
Page 52: Parameters Set And Maker Operation
E8900A Spectrum Analyzer User Manual 3.5.1 Parameters Set and maker operation Users can refer to the parameter setting and marker function under Swept SA. In the field strength mode, the user can click the [Amptd] menu and click < Amptd Unit > to select the supported units under the field strength... -
Page 53: Basic Measurement
E8900A 5G NR Spectrum Analyzer User Manual In the field strength measurement mode, the user can select the antenna correction by clicking measurement < measurement Settings > and then click < Antenna Select > to select the appropriate antenna list in the pop-up check box. -
Page 54: Sem
E8900A Spectrum Analyzer User Manual 4 Connect the antenna to the instrument. 5 The user can set the measurement parameters according to the test requirements. 6 To change the measurement unit, the main menu [Ampd] menu, click < Ampd unit > to select the unit required by the user. -
Page 55: Parameters Set And Maker Operation
E8900A 5G NR Spectrum Analyzer User Manual Spectrum Template Fig.3-22 3.6.1 Parameters Set and maker operation Users can refer to the parameter setting and marker function under Swept SA. 3.6.2 Meas Set 1 Meas Set In the measurement setting, the user can set the parameters of carrier,... - Page 56 E8900A Spectrum Analyzer User Manual Fig.3-23 measurement setting 2 Limit The user can click the [Meas Set] menu and click < Limit > to set the parameters of qualified line There are four modes each spectrum line : absolute(Abs), relative(Rel), And, Or.
-
Page 57: Fix Frequency Mode(Ffm)
E8900A 5G NR Spectrum Analyzer User Manual Fig.3-24 Limit line setting 3.7 Fix Frequency Mode(FFM) Users can observe the spectrum of 104.4MHz bandwidth under this function. Fig.3-25 Frequency Fix Mode 3.7.1 Parameter Set 1.Frequency... -
Page 58: Meas Set
E8900A Spectrum Analyzer User Manual Click [FFM] to enter the measurement interface, click [Frequency], and press < Freq > menu to set frequency-related parameters. 2.Amplitude User can refer to the method of amplitude setting in [Swept SA]measurement. 3.Bandwidth(BW) RBW: use can set the RBW in auto mode or manu mode, the range is from 15.8kHz to 3MHz in normal sweep mode. -
Page 59: Gate Sweep
E8900A 5G NR Spectrum Analyzer User Manual Fig.3-26 Disp line setting 3.8 Gate Sweep This function will show the waveform after GPS locking, user must connect GPS module and select “Built-in GPS ” Source . Fig.3-27 Gate sweep measurement... -
Page 60: Parameter Set
E8900A Spectrum Analyzer User Manual 3.8.1 Parameter Set 1.Frequency Click [Gate Sweep] to enter the measurement interface, click [Frequency], and press < Freq > menu to set frequency-related parameters. 2.Amplitude User can refer to the method of amplitude setting in [Swept SA]measurement. -
Page 61: Meas Set
E8900A 5G NR Spectrum Analyzer User Manual 3.8.2 Meas Set Fig.3-28 Measurement setting 1.Normal Trig Fig.3-29 Normal Trigger measurement setting... - Page 62 E8900A Spectrum Analyzer User Manual GPS Delay: The interval time of GPS 1PPS trigger signal and the starting time of time domain measurement signal. The minimum is 0us and the maximum is 10ms. Gate Delay: Based on the start time of signal. The time after Gate Delay of the start time of signal is the start time of spectrum calculation.
- Page 63 E8900A 5G NR Spectrum Analyzer User Manual Symbol Index: The number of 5G signal symbol in one slot, and combines the [Symbol Index] setting decide the start of signal for spectrum calculation. Num: the length of symbol, decides the length of spectrum calculation.
-
Page 64: Inter Analyzer
E8900A Spectrum Analyzer User Manual 4 Inter Analyzer 4.1 Spectrogram Spectrogram is a way to record spectrum by 3D display. The horizontal coordinate represents the frequency, the vertical coordinate represents the time. Use different colors to indicate the amplitude of the signal. The user can analyze the time stability of the signal or search for intermittent interference signal through the spectrogram. -
Page 65: 3Meas Set
E8900A 5G NR Spectrum Analyzer User Manual 4.1.3Meas Set 1 Meas Set (1)View Click < View >, and click < Display > to switch between "double window" mode and "single window" mode. The upper part of the window is "Spectrogram" and the lower part is "Swept SA" mode, which is convenient for users to measure and analyze. -
Page 66: 1Parameters Set
E8900A Spectrum Analyzer User Manual DPS is a three-dimensional spectrum analysis. The X-axis is the frequency domain, the Y-axis is the amplitude domain, and the z-axis is the color, which represents the frequency of current signal occurrence. The more the color tends to red, the more the frequency of occurrence. The more the color tends to blue, the less the frequency of occurrence. -
Page 67: Orientate
E8900A 5G NR Spectrum Analyzer User Manual 2.Marker Users can refer to the marker function under Swept SA measurement. Orientate Under the [Orientate] measurement, users need to use directional antenna with GPS and electronic compass. Directional antenna is used to test... -
Page 68: Signal Strength
E8900A Spectrum Analyzer User Manual Polarization modes are horizontal and vertical. The user can choose "Hor" and "Ver". Signal Strength The signal strength measurement has the function of alarm. Judge the position of the transmitter according to the strength of the signal... -
Page 69: Inter Locate
E8900A 5G NR Spectrum Analyzer User Manual Click < Sound > to set it to "on". As the signal strength increases, the frequency of the prompt sound will increase gradually. It is helpful to judge the distance between the starting source and the current instrument. -
Page 70: Parameters Set And Maker Operation
E8900A Spectrum Analyzer User Manual 1. Copy the map file to the root directory of the U disk, click " " button, select "Map" as the file type, select "USB disk" as the save location, check the file to be copied by the user, and click "copy to local", 2. -
Page 71: Tdd-Lte
E8900A 5G NR Spectrum Analyzer User Manual Three point positioning Fig.4-5 5 TDD-LTE The TDD-LTE function of E8900A can conduct relatively comprehensive demodulation analysis of 4G communication system and improve the work efficiency of base station maintenance. Power vs RB Click the [MENU], and click the [TDD-LTE], and click the sub-menu [Power vs RB] measurement. -
Page 72: Parameter Set
E8900A Spectrum Analyzer User Manual At the bottom right of the screen is the RB Markers, which selects a particular RB or subframe through the <Marker> function. Fig.5-1 RB power test 5.1.1 Parameter Set 1 Frequency Center Freq: Click < Center Freq >, and the center frequency of current LTE signal can be set through keyboard or wheel key. -
Page 73: Mode Set
E8900A 5G NR Spectrum Analyzer User Manual According to the TD-LTE standard of 3GPP protocol, TD-LTE bandwidth can be set to 1.4MHz, 3MHz, 5MHz, 10MHz, 15MHz and 20MHz. Users can manually select according to the current bandwidth. 4 Mark Under the Power vs RB, The Mark is divided into two types: RB and Free. -
Page 74: Meas Set
E8900A Spectrum Analyzer User Manual 5.1.3 Meas Set Auto Scale: Click [Auto Scale], and parameters such as < Max Value >, < Range >, < Threshold > can be set automatically according to the power value of the current test signal. -
Page 75: Parameter Set
E8900A 5G NR Spectrum Analyzer User Manual 5.2.1 Parameter Set Under the <Constell> measurement, users can refer to the parameters set in the Power vs RB. 5.2.2 Mode Set EVM Max Hold: The <EVM Max Hold> is set to on, EVM will maintain the current test max value. -
Page 76: Parameter Set
E8900A Spectrum Analyzer User Manual Fig.5-3 Power vs Time 5.3.1 Parameter Set Under the <Power vs Time> measurement, users can refer to the parameters set in the Power vs RB. 5.3.2 Meas Set Subframe: The user can set the sub-frame number to view the spectrum waveform of each sub-frame. -
Page 77: Parameter Set
E8900A 5G NR Spectrum Analyzer User Manual Fig.5-4 Control CH Power 5.4.1 Parameter Set Under the <Control CH Power> measurement, the users can refer to the parameters setting in the Power vs RB. 5.4.2 Meas Set Under the <Control CH Power> measurement, the users can refer to the... -
Page 78: Fdd-Lte
E8900A Spectrum Analyzer User Manual 6 FDD-LTE The FDD-LTE function of E8900A can conduct relatively comprehensive demodulation analysis of 4G communication system and improve the work efficiency of base station maintenance. Power vs RB RB power measurement provides RB quantity, RB utilization, channel power, Cell ID …... -
Page 79: Mode Set
E8900A 5G NR Spectrum Analyzer User Manual Ref Offset: Compensates for positive and negative compensations of attenuators or amplifiers connected to the input port. The user enters a compensation value at < Ref Offset >. The instrument defaults to 0dB. -
Page 80: Meas Set
E8900A Spectrum Analyzer User Manual Cell ID: You can set the <Cell ID> to "Auto" or "Manu". When set to "Manu", set the cell ID number through the keyboard. If the Cell ID specified by the user cannot be searched in the current spatial signal, the prompt "Cell ID not exist"... -
Page 81: Parameter Set
E8900A 5G NR Spectrum Analyzer User Manual Fig.6-2 Constellation measurement 6.2.1 Parameter Set Under the <Constell> measurement, users can refer to the parameters set in the Power vs RB in [FDD-LTE]. 6.2.2 Mode Set Pressing <Mode Set>, enter mode setup menu. User can set bandwidth, Cell ID, UL/DL allocation parameters. -
Page 82: Control Ch Power
E8900A Spectrum Analyzer User Manual Control CH Power Give a test power and EVM result list for RS, P-SS, S-SS, PBCH, PCFICH, PDSCH-QPSK, PDSCH-16QAM, PDSCH-64QAM. Fig.6-3 Control power measurement 6.3.1 Parameter Set Under the <Control CH Power> measurement, the users can refer to the parameters setting in the Power vs RB in [FDD-LTE]. -
Page 83: Coverage
E8900A 5G NR Spectrum Analyzer User Manual 7 Coverage 7.1 SS Indoor Users can import building map files via USB disk and mark them on the building map by manual tapping. Capture data based on user-defined time intervals or user-defined building map locations.(Import and load building map from File Manager interface). -
Page 84: Meas Set
E8900A Spectrum Analyzer User Manual Users can refer to the BW setting under [Swept SA] to perform related operations. (Users need to set the bandwidth when the measurement status is "Stop"). (4)Sweep Users can refer to the sweep setting under [Swept SA] to perform related operations. -
Page 85: Ss Outdoor
E8900A 5G NR Spectrum Analyzer User Manual Time Interval: Only in the "Time" mode, the user can manually input the sampling point interval, the setting range is between 100ms and 1Min. Threshold:The user clicks <Threshold> to manually set the threshold values of “Excellent”, “Very Good”, “Good”, “Poor”... -
Page 86: Meas Set
E8900A Spectrum Analyzer User Manual The user can refer to the frequency setting under [Swept SA] measurement. (The user needs to set the frequency when the measurement status is "Stop"). (2)Amptd The user can refer to the amptd setting under [Swept SA] to perform related operations. -
Page 87: Netclean Outdoor
E8900A 5G NR Spectrum Analyzer User Manual b.Dist Inter: In Distance mode, the user can set [Dist Inter]. After starting the measurement, the instrument marks the sampling points on the map at the set distance. The input range is from 1 meter to 500 meters. -
Page 88: Parameter Set
E8900A Spectrum Analyzer User Manual 7.3.1 Parameter Set The setting of Freq, Amptd, BW, Sweep, Marker setting, user can refer to the frequency setting under [Swept SA] measurement. 7.3.2 Meas Set Measure: The user clicks "Start" to perform a dot test,and click "Stop" to end the test. -
Page 89: Tdd Outdoor
E8900A 5G NR Spectrum Analyzer User Manual The FDD-LTE quality data include CELL ID, S-SS, P-SS, RSRQ, RSRP. The operation is same as the Drive test for SS Outdoor. So please take it as the reference. Fig.7-4 FDD Outdoor test 7.5 TDD Outdoor... -
Page 90: Nr Outdoor
E8900A Spectrum Analyzer User Manual Fig.7-5 TDD Outdoor test 7.6 5G NR Outdoor Under the 5G-NR Outdoor test, the user can test the 5G information quality and coverage of the relevant area to determine whether there are weak coverage or overlapping coverage in the area. An external GPS module is required for this test. -
Page 91: Parameter Set
E8900A 5G NR Spectrum Analyzer User Manual Fig.7-6 5G NR Outdoor test 7.6.1 Parameter Set (1)Freq The user can refer to the frequency setting under [Swept SA] measurement. (2)Amptd The user can refer to the amptd setting under [Swept SA] to perform related operations. -
Page 92: Nr Indoor
E8900A Spectrum Analyzer User Manual to start the measurement. When the GPS information is not acquired, clicking “Start” will prompt “GPS is not connected”. Mode: The user clicks the <Mode> button to select the“Time” and “Distance” modes. “Time”mode:Automatically mark sampling points according to the time interval that the user has set. -
Page 93: Parameter Set
E8900A 5G NR Spectrum Analyzer User Manual Fig.7-7 5G NR Indoor test 7.7.1 Parameter Set (1)Freq The user can refer to the frequency setting under [Swept SA] measurement. (The user needs to set the frequency when the measurement status is "Stop"). -
Page 94: Mode Set
E8900A Spectrum Analyzer User Manual 7.7.2 Mode set Users can refer to <Mode set> under 5G-NR [Summary] for related operations. 7.7.3 Meas set The user can refer to the setting of [5G NR Outdoor] under [Coverage] to perform related operations. -
Page 95: Summary
Synchronization flag, Phycical Cell ID(NID1,NID2), Beam ID, PBCH QPSK EVM RMS, PBCH QPSK EVM PK, SS-RSRP, SS-RSRQ, SS-SINR, PBCH Power, Time Offset, PBCH constellation and PBCH MIB decode. In the summary measurement, E8900A shows the following settings: 8.1.1 Parameter Set 1.Frequency Select [Summary] and press <Frequency>... - Page 96 E8900A Spectrum Analyzer User Manual In the <Frequency> setting, press <Cent Freq>, user can set the frequency to be measured and the <NR-ARFCN> covert corresponding value automatically according the 3GPP protocol. Example: Setting the center to 3550MHz, press the key “3” , “5” , “4” , “9”, “.”, “9”, “9”, select the unit “MHz”.
- Page 97 E8900A 5G NR Spectrum Analyzer User Manual change to “3GHz” automatically. User can also use the rotary knob or the arrow keys. Fig.8-3 Frequency Channel Setting (3) Cali Cent Freq In the <Frequency> setting, press < NR-ARFCN>,waiting for about 6 seconds ,<Cali Cent Freq >...
- Page 98 E8900A Spectrum Analyzer User Manual Fig.8-4 Calibrate SSB Center Frequency 2.Amplitude User can refer to the method of amplitude setting in [Spectrum Sweep]measurement. The "AGC" option is added here. When the user selects AGC on, the software automatically adjusts the values of amplifier switch and attenuator according to the measured values.
-
Page 99: Mode Set
E8900A 5G NR Spectrum Analyzer User Manual Figure.8-5 5G-NR Bandwidth setting 8.1.2 Mode Set (1)SCS ① In [Summary], user press [BW] item. ②Press <SCS>, select the measured value 15kHz or 30kHz, default: 30kHz. Note: SCS is corresponding with analyzed bandwidth. When set bandwidth is greater than 50MHz, the SCS just can be set to 30kHz. - Page 100 E8900A Spectrum Analyzer User Manual Figure.8-6 SCS Setting (2)RB Offset by 15kHz SCS This parameters with SCS Offset by 15kHz SCS define the location of the synchronization signals in the frequency domain in terms of resource blocks (RB) ①In [Summary], user press [Mode Set] item.
- Page 101 E8900A 5G NR Spectrum Analyzer User Manual Figure.8-7 RB Offset Setting (3)SCS Offset by 15kHz SCS This parameters with RB Offset by 15kHz SCS define the location of the synchronization signals in the frequency domain in terms of 15kHz sub-carrier ①In [Summary],user press [Mode Set] item.
- Page 102 E8900A Spectrum Analyzer User Manual Figure.8-8 SCS Offset Setting (4)SS Block Pattern ①In [Summary],user press [Mode Set] item. ②Press <SSB>. ③Press < SS Block Pattern >, select the SSB pattern : Case A , Case B or Case C. Note: When SCS is 15kHz, SSB pattern only can be set Case A. When SCS...
- Page 103 E8900A 5G NR Spectrum Analyzer User Manual Figure.8-9 SS Block Pattern Setting (5)Spec Pair ①In [Summary],user press [Mode Set] item. ②Press <SSB>. ③Press <SSB Pattern>,select <Case C> ④Press<Spec Pair>,select the pattern in Case C: Pair or Unpaired.
- Page 104 E8900A Spectrum Analyzer User Manual Figure.8-10 Spec Pair Setting (6)PBCH MIB Info Click<Show MIB Info>, the measurement figure will show the PBCH MIB specific information in the block(See below) . The first column is the source code of MIB, the second column is the meaning according to 3GPP protocol.
-
Page 105: Meas Set
E8900A 5G NR Spectrum Analyzer User Manual 8.1.3 Meas Set Synchronization flag, Phycical Cell ID(NID1,NID2), Beam ID. PBCH QPSK EVM RMS, PBCH QPSK EVM PK, SS-RSRP, SS-RSRQ, SS-SINR, PBCH Power, Time Offset and PBCH constellation. (1)Sync: show whether the 5G-NR cell is locked.“Yes”means the synchronization was successful.“No”means the synchronization was not... -
Page 106: Paremeter Set
PBCH channel constellation, antenna angle diagram and statistics diagram of antenna angle and SS-RSRP in each antenna angle. In the inter detect measurement , E8900A shows the following settings: 8.2.1 Paremeter Set 1. Frequency User can refer to the method of frequency setting in [Summary] measurement. - Page 107 E8900A 5G NR Spectrum Analyzer User Manual 4. Mode Setting User can refer to the method of mode setting setting in [Summary] measurement. 5.Marker In [Inter Detect] measurement, user press [Maker] item to select the setting in right column. This setting only point to the spectrum analyze diagram.
- Page 108 E8900A Spectrum Analyzer User Manual (2) Max Hold < Max Hold >function is show the max value of every spectrum point in current trace. Here can select <On> or <Off>. Figure.8-14 Max Hold On/Off State (3) Select trace <Sel Trace> decide the trace where maker1 and maker2 point to in the diagram.
-
Page 109: Meas Set
E8900A 5G NR Spectrum Analyzer User Manual 8.2.2 Meas Set In [Inter Detect] measurement, user press [Meas set] item to select the setting in right column. This setting correspond to the antenna angle diagram and SS-RSRP in each antenna angle diagram. - Page 110 E8900A Spectrum Analyzer User Manual Figure.8-17 Polarization Setting (2) PvsD Press <PvsD> can select <Clear PVD>, when press this item, the statistics trace in fourth figure will be all clear. Figure.8-18 Clear PVD 2. Measured parameters specification...
- Page 111 E8900A 5G NR Spectrum Analyzer User Manual User can refer to the measurement specification in the form of 5G-NR Summary. 3.Four measurement diagram specification (1) Spectrum Analyze diagram This diagram provide real time spectrum of 5G signals with setting bandwidth. The horizontal axis represent frequency and its unit is GHz or MHz.
-
Page 112: Beam Analyzer
E8900A Spectrum Analyzer User Manual Shows the angle of current directional antenna. Throughout antenna angle and SS-RSRP of each direction angle to analyze the direction of 5G-NR signals source. (4) statistics diagram of antenna angle and SS-RSRP in each antenna... -
Page 113: Parameter Set
E8900A 5G NR Spectrum Analyzer User Manual In the beam analyzer measurement, E8900A shows the following settings: 8.3.1 Parameter Set 1. Frequency User can refer to the method of frequency setting in [Summary] measurement. 2.Amplitude User can refer to the method of amplitude setting in [Spectrum Sweep] measurement. - Page 114 E8900A Spectrum Analyzer User Manual ③Press<Start>, it will show the statistic information in the data form with different cell id or beam id. ③Press<Stop>, it will stop statistic. When press<Start> again,the data in the form will be cleared and statistic renew.
-
Page 115: Power Vs Time
E8900A 5G NR Spectrum Analyzer User Manual Figure.8-21 Beam Detail (2) Return In the mode of statistic ,after starting statistic the cell and select the detail, user can press <Return> back to the data form diagram. (3) PCI Search Physical cell ID Search can be divided into "Auto" mode and "Manu"... -
Page 116: Parameter Set
E8900A Spectrum Analyzer User Manual Figure.8-22 5G-NR Power VS Time This measurement will show the time waveform and the spectrum of the TDD symbol the user set when the 5G signal is synchronization. User can set any PDSCH symbol or servals consecutive symbols in one 10ms frame. -
Page 117: Meas Set
E8900A 5G NR Spectrum Analyzer User Manual User can refer to the method of mode setting in [Summary] measurement. 5.Marker User can refer to the method of Marker setting in [Spectrum Analysis]<Swept SA> measurement. 8.4.2 Meas Set In [Power Vs Time] measurement, user press [Meas set] item to select the setting in right column. - Page 118 E8900A Spectrum Analyzer User Manual Figure.8-24 Slot mode of PVT (2) Allocated Slot ①Press<Meas set>. ②Press< Allocated Slot>, user can enter the slot number from 0 to 9 when SCS is 15KHz, and from 0 to 19 when SCS is 30KHz. The first measurement diagram will show the selected slot spectrum.
-
Page 119: Channel Power
E8900A 5G NR Spectrum Analyzer User Manual When select allocated slot, the first symbol and the last symbol, the second frequency-domain diagram will show the spectrum of selected symbol or several consecutive symbols in this slot. Note: when SCS is 15KHz the number of slot power in measurement parameters table is from 0 to 9 and when SCS is 30KHz the slot power number of slot power is from 0 to 19. -
Page 120: Meas Set
E8900A Spectrum Analyzer User Manual 8.5.2 Meas Set Fig.8-25 Measurement setting 1.Integ BW Sets the integration bandwidth for the channel power measurement. The range of setting bandwidth is from 300kHz to 100MHz. 2 RF Burst User can refer to the method of amplitude setting in [Channel Power] of Spectrum Analysis measurement. -
Page 121: Parameter Set
E8900A 5G NR Spectrum Analyzer User Manual Fig.8-26 5G Occupied bandwidth 8.6.1 Parameter Set 1.Frequency Click [Occ BW] to enter the measurement interface, click [Frequency], and press < Freq > menu to set frequency-related parameters. 2.Amplitude User can refer to the method of amplitude setting in [Swept SA]measurement. -
Page 122: Meas Set
E8900A Spectrum Analyzer User Manual User can refer to the method of amplitude setting in [Swept SA]measurement. 5.Marker Users can refer to the marker function under Swept SA and Channel power measurement. 8.6.2 Meas Set Fig.8-27 Occupied Bandwidth Measurement setting 1.Integ BW... -
Page 123: Adjacent Channel Leakage Ratio (Aclr)
E8900A 5G NR Spectrum Analyzer User Manual 3 X dB: Sets the dB Down level for calculating the occupied BW. 4 RF: Sets the RF trigger to Burst or Continuous (Free Run) mode. The default setting is Continuous. 5 Burst RF: Opens the Burst RF submenu if RF is toggled to Burst. -
Page 124: Meas Set
E8900A Spectrum Analyzer User Manual Users can refer to the marker function under Swept SA and Channel power measurement. 8.7.2 Meas Set Tapping the Meas Set softkey opens up a dialog box enabling the user to setup the ACLR measurement. (See below.) Within this dialog, you can set signal standard, bandwidth values, and other specifications. - Page 125 E8900A 5G NR Spectrum Analyzer User Manual Fig.8-29 5G ACLR Measurement setting Sig Std:The instrument prefabricates the templates of various communication systems. By selecting the communication mode in the template, parameters can be set in one key mode. Carr BW:Set the spectrum width of the carrier frequency signal to be measured.
- Page 126 E8900A Spectrum Analyzer User Manual Use Default: After clicking, the parameter setting will automatically adjust to the default initial state of the signal type of the signal meter. 2 Limit Under ACLR measurement, click the [Meas Set] menu, click the < Limit >...
- Page 127 E8900A 5G NR Spectrum Analyzer User Manual Abs: Absolutely qualified means qualified; Rel: Relatively qualified means qualified; And: Absolute and relatively qualified is qualified; Or: Absolute or relative qualification is qualified. Only the left and right adjacent roads are qualified as the adjacent roads.
-
Page 128: Parameter Set
E8900A Spectrum Analyzer User Manual 9 IQ Click [IQ] to enter the measurement interface, and the instrument can perform IQ capture. Fig.9-1 IQ Capture test 9.1.1 Parameter Set (1)Freq The user can refer to the frequency setting under [Swept SA] measurement. - Page 129 E8900A 5G NR Spectrum Analyzer User Manual Press [Meas set], click <SR> on the right side of the interface, and select the sampling rate required for the test. The options are “122.88MHz”, “61.44MHz”, “30.72MHz”, “15.36MHz”, “ 7.68MHz", "3.84MHz", "1.92MHz". The default is "122.88MHz".
- Page 130 E8900A Spectrum Analyzer User Manual Fig.9-3 Size Set (3)Start Click the "Start" button to start IQ data capture. When the “Step” at the bottom of the interface is displayed as “IQ capture stopped”, the user performs other operations. Note: During the IQ capture process, the “Used time” display is a continuous time from the start of capture to the completion of the save.
-
Page 131: Demodu
E8900A 5G NR Spectrum Analyzer User Manual 10 Demodu 10.1 Analog Select "Demodu" in the main menu, and enter the "Analog" function. This function can demodulate AM, FM or CW analog signals, as shown below: Fig.10-1 Analog The parameter settings are as follows: 1.Frequency... - Page 132 E8900A Spectrum Analyzer User Manual Fig.10-2 Amptd setting 3.Meas set The following steps are required for analog demodulation: Fig.10-3 measurement setting (1) Demodu...
- Page 133 E8900A 5G NR Spectrum Analyzer User Manual Click the "on" button to start the analog demodulation, play the analog demodulation sound at the same time, and click the "off" button to stop the analog demodulation. (2) Record Click "on" to start recording analog demodulation sound, click "off" to stop recording, and the recorded wav audio file is saved locally.
-
Page 134: Digital
E8900A Spectrum Analyzer User Manual Fig.10-5 demodulation bandwidth 10.2 Digital Select "Demodu" in the main menu, and enter the "Digital" function. This function can demodulate ASK, FSK, MSK, PSK or DPSK digital signals, as shown below: Fig.10-6 Digital The parameter settings are as follows: 1.Frequency... - Page 135 E8900A 5G NR Spectrum Analyzer User Manual 2.Amptd Set up attenuators and amplifiers. 3.Meas set The following steps are required for digital demodulation: Fig.10-7 measurement setting (1) Demodu Click the "on" button to start the digital demodulation and display the demodulation data results.
- Page 136 E8900A Spectrum Analyzer User Manual Fig.10-8 demodulation type (3) SR Set the signal symbol rate of digital demodulation in the range of 30-120kbps.
-
Page 137: File Management
E8900A 5G NR Spectrum Analyzer User Manual 11 File Management 11.1 File management Click the file management key " ", files can be stored in the Position of "Local Disk" and "USB Disk". File types includes Status, Results, Report, Image, Trace, Building map, Map, Chan Plan, Audio and IQ files. -
Page 138: File Saving
E8900A Spectrum Analyzer User Manual Fig. 11-3 Load File Load: Users can select a file and click <Load> to automatically load the file. Remove: The files selected by the user can be deleted. refresh: Refresh the files in the current storage location directory. - Page 139 E8900A 5G NR Spectrum Analyzer User Manual Fig. 11-4 File saving When "Trace" is saved, the instrument will save the current setting state and measurement trace. Save types include tra (data type) and CSV (text type). When the tra file is loaded, the instrument loads both the corresponding state and waveform data, and the interface displays a single sweep of the state and waveform.
- Page 140 E8900A Spectrum Analyzer User Manual By default, the path to save the file is "Local Disk", and when the user inserts a USB disk, the "USB Disk" item is highlighted. Click "Local Disk" or "USB Disk", and click "Save" to save to the appropriate path.
-
Page 141: System Setting
E8900A 5G NR Spectrum Analyzer User Manual 12 System Setting 12.1 System information and Setting Click the system setting key " " to enter the system setting menu. The user can view the System Info, view and change the Display, Date & Time, Network, GPS source and Touch Screen. -
Page 142: Common
E8900A Spectrum Analyzer User Manual 12.1.2 Common Fig.12-2 common setting Language: Chinese/English Power On: Select "Last", after shutdown, restart the instrument and still set the parameters from the last test. Select "Preset", boot up again and return to default state. - Page 143 E8900A 5G NR Spectrum Analyzer User Manual Skin: Users can choose Modern, Daytime and Night interface styles according to their needs. Desktop display: Users can select two display modes: Default and Measure. If the desktop display is set as "Default", the user can enter the measurement interface as shown in Figure 11-3 after clicking the home touch key;...
-
Page 144: Date & Time
E8900A Spectrum Analyzer User Manual 12.1.4 Date & Time Date: Click the date input box to enter the date through the virtual keyboard. Date Format: Users can choose three different date display modes, which are "YYYY-MM-DD", "MM-DD-YYYY" and "DD-MM-YYYY". Time: Click the time input box to enter the time through the virtual keyboard. -
Page 145: Network
E8900A 5G NR Spectrum Analyzer User Manual Fig.12-6 Time zone 12.1.5 Network Type: Users can choose the IPV4 or IPV6 network protocol. Mode: Users can choose "DHCP" or "Static IP", the default is "Static IP". In the "Static IP" mode, users can set network parameters such as "IP Address", "Net mask", "Control Port"... -
Page 146: Gps
E8900A Spectrum Analyzer User Manual Fig.12-7 Network 12.1.6 GPS GPS Source: Users can choose "Off", "External GPS", "Built-in GPS", "ET30-USB", "ET30H-AUX", "DF108". External GPS: It is not used now. Built-in GPS: It is used for 5G-NR TimeOffset test, GPS Gate Trig, and also SS/LTE/5G NR Outdoor coverage measurement. -
Page 147: Touch Screen
E8900A 5G NR Spectrum Analyzer User Manual Fig.12-8 12.1.7 Touch Screen Calibrate: Click< Start >, the touch screen can be calibrated and corrected according to the prompts. 12.1.8 Option Users can select option update as needed, and the option list displays information such as the option name and its expiration date. -
Page 148: Technical Index
E8900A Spectrum Analyzer User Manual 13 Technical Index Parameter Specifications Frequency Range 9kHz – 9000MHz ±1/1Hz (0 - +50 ℃) Frequency accuracy ±1×10 Phase noise Typical<-105 dBc/Hz@frequency offset 100kHz Amplifier OFF: ≤-135dBm, 10MHz~3GHz、 ≤-130dBm, 3GHz~6GHz、 ≤-125dBm, 6GHz~9GHz; Average noise display level (normalized 1Hz) Amplifier ON: ≤-155dBm, 10MHz~3GHz、... - Page 149 E8900A 5G NR Spectrum Analyzer User Manual analysis supports patterns Power supply Adapter AC100-240V/50-60Hz DC15V Environment Working temperature 0℃- +50℃ temperature Display 10.1 inches Size 316mm X 228mm X 77mm Weight <4.5kg 3GPP TS38.104 3GPP TS38.141 5G NR test standard 3GPP TS38.211...
- Page 150 E8900A Spectrum Analyzer User Manual Deviser(US) Deviser(China) Address:780 Montague Expressway, Address:No.8,Haitai Chuangxin 3 Road, Suite 701, San Jose, CA 95131, USA Hi-tech Industrial Development Area, Tianjin, China, 300392 Tel:+1408 955 0938 Tel:+86 2764 5003 ext.803 http://www.deviserinstruments.com http://www.deviserinstruments.com E-mail:info@deviserinstruments.com E-mail: overseasbiz@deviser.com.cn...
Need help?
Do you have a question about the E8900A and is the answer not in the manual?
Questions and answers