Advertisement
Quick Links
Advertisement

Related Manuals for CURIOSIS Celloger Mini


Summary of Contents for CURIOSIS Celloger Mini
- Page 1 Automatic Live Cell Imaging System Quick Manual...
- Page 2 Table of contents Device Layout Basic operation 1) Installation 2) Set up 3) Starting Description 1) Set up 2) Scan 3) Album 4) Analysis Operation 1) Set up 2) Vessel Setting & Focusing 3) Image Scan & Time lapse image capture 4) Video recording 5) Confluency &...
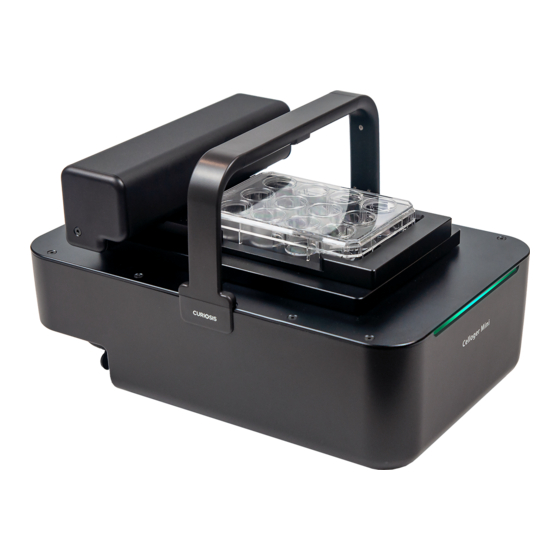
- Page 3 Device Layout...
- Page 4 Front Layout Bright field lamp X-Axis Motor Temperature and humidity sensor Objective Lens Vessel holder X-Y Stage...
- Page 5 Side Layout Rear Layout Bright field lamp Vessel holder X-Axis Motor X-Axis Motor X-Y Stage LAN & Power cable LAN & Power cable connector connector...
- Page 6 Basic Operation...
- Page 7 1. Installation LAN & Power Cable Connect the device to PC Step 1. Unbox and take out the product from the box. Step 2. Connect the cables to device and PC.
- Page 8 2. Set up Cell seeding Step 1. Prepare a sample. Step 2. Put the device inside an incubator for 30min to equalize temperature and humidity . Step 3. Place the sample on the stage. Note: Check the connection between the PC and the device. ...
- Page 9 3. Starting Double Click! Step 1. Double click a Celloger Mini App Step 2. Select the location where to save the images Step 3. Click the icon and press OK Step 4. Press Start streaming button to display the current plate.
- Page 10 Description...
- Page 11 1. Setup Experiment setup including stage, vessel and focus Setup Start Start cell image scanning streaming Stop Stop cell image scanning streaming Temperature Display of current temperature and humidity & Humidity Adjust intensity, brightness, contrast, Image setting autofocusing Frame Select image resolution resolution - Normal / High Image...
- Page 12 1. Setup Experiment setup including stage, vessel and focus Setup Adjust XYZ stage - speed, step, set position Manual Set XYZ stage position manually Position Vessel Select vessel type (see page 13) Set file format, frame resolution, Imaging objective lens, autofocus, align image imaging conditions setting (see page 13) Set range for autofocusing - depth, resolution, ROI (see page 13)
- Page 13 1. Setup Vessel Select vessel type - Custom type - 6 / 12 / 24 / 48 / 96 well plate - 35 / 60 / 100mm dish - 25 / 75 ㎠ flask Imaging Set file format - PNG / JPG / TIFF Select frame resolution - Normal / High Objective lens...
- Page 14 2. Scan Progress control of automatic scan and time-lapse capturing Scan Mode Start, stop and pause cell imaging Folder Set location to save image setting Progress Display of experiment progress Schedule Set period and total schedule Frame Select image resolution resolution - Normal, High Image...
- Page 15 2. Scan Progress Display of experiment progress - Cycle time remaining - Elapsed time - Start date - End date Schedule Set period and total schedule Period: Max 24 hours, 59 minutes Total time: Max 9999 day, 24 hours, 59 minutes Rest time: Min 10 minutes, Max 9999 minutes Total cycle and Req.
- Page 16 3. Album Save scan images as a video Album Select video preview and recording Video (see page 22) Control video speed [Range: 1~30] (frame per second) Folder Import saved images setting Frame Select image resolution resolution - Normal, High Image Display of image information information - pixel, size, zoom(magnification)
- Page 17 4. Analysis Acquire cell confluency data Analysis Run cell confluency analysis (see page 23) Select image type Source - live image, local image, time-lapse images Display of cell confluency data Results - Data (Percentage), Graph (Confluency) Color Adjust color for data analysis Image Display of image information information...
- Page 18 Operation...
- Page 19 1. Set up Imaging set LED intensity Camera brightness Camera contrast Autofocusing Frame Resolution Result Step 1. Press Start streaming button, then image is displayed. Step 2. To adjust illumination, use the LED intensity, camera brightness, camera contrast on the imaging tap. Normal High Step 3.
- Page 20 2. Vessel Setting & Focusing Step 1. Select the Vessel type and image saving format. Step 2. Specify where to capture the images. Step 3. Adjust the focus using the autofocusing button or jog tap. Step 4. After specifying position for each well, press button.
- Page 21 3. Image Scan & Time lapse image capture Step 1. Press the scan tab. Step 2. Select a location to save the captured image. Step 3. Set up total time and period in the schedule, the total cycle and req. storage are calculated automatically. Step 4.
- Page 22 Select the name of image in the data list. The preview window will show the image and movie you selected. Warm up Celloger Mini for 1 hour in incubator before making a movie. If not, it might be the cause of uncertain data or unclear videos.
- Page 23 5. Confluency & Growth Curve confluency & growth curve Cell line : HeLa 30.9% Step 1. Press the analysis tab. Step 2. Import an image or a folder. Select Live(current) image (1 image) / Local image (1 image) / Time-Lapse images (folder) in source menu Step 3.
- Page 24 6. Additional setting Measure cell length 28.6㎛ Other settings < Histogram > < Center mark > < Grid line > Step 1. Click the right button of the mouse on display. Step 2. Click “Histogram” or “Center mark” or “Measure” or “Grid line”. Note : Grid line can be set according to user's convenience (default : 3 x 3)
- Page 25 Copyright 2020, by CURIOSIS, Inc. All rights reserved. Published in Korea. Revision History: V.0.0 Date: Dec 2019 V.0.1 Date: Feb 2020 V.0.2 Date: Mar 2020...
- Page 26 4F 10, Teheran-ro 38-gil, Gangnam-gu, Seoul 06221, South Korea Curiosis Inc. T: 82 2 508 5236 F: 82 2 508 5246 www.curiosis.co.kr...
Need help?
Do you have a question about the Celloger Mini and is the answer not in the manual?
Questions and answers