
Related Manuals for THORLABS PMD5000


Summary of Contents for THORLABS PMD5000
- Page 1 Operation Manual Thorlabs Instrumentation Polarization Mode Dispersion Measurement System PMD5000 FIN / HDR 2006...
- Page 2 Version: Date: 04.10.2006 © <2006> Thorlabs © <2006> Thorlabs...
-
Page 3: Table Of Contents
............................49 2nd Order DGD Histogram ............................50 PSP Diagram ............................51 PCD Diagram ............................52 PSP Rotation Rate Diagram ............................53 Data Analysis / Calculations Window ..............................53 Cursor Control ..............................55 Saving Data ..............................58 © <2006> Thorlabs... - Page 4 List of Figures ................................. 77 Addresses ................................. 79 Part VII Application Notes 1 Definitions and Terms ........................... 81 2 Accuracy ........................... 83 3 Measurement of Fibers ........................... 90 4 Measurement of Narrow Bandwidth Components ........................... 96 Index © <2006> Thorlabs...
-
Page 5: Foreword
Therefore, please let us know about possible criticism or ideas. We and our international partners are looking forward to hearing from you. Thorlabs This part of the instruction manual contains every specific information on how to handle and use the PMD5000FIN / HDR. - Page 6 General Information PMD5000 Part...
-
Page 7: Part I General Information
All modules must only be operated with proper shielded connection cables. Only with written consent from Thorlabs may changes to single components be carried out or components not supplied by Thorlabs be used. This precision device is only serviceable if properly packed into the complete original packaging including the plastic foam sleeves. -
Page 8: Parts List - Accessories
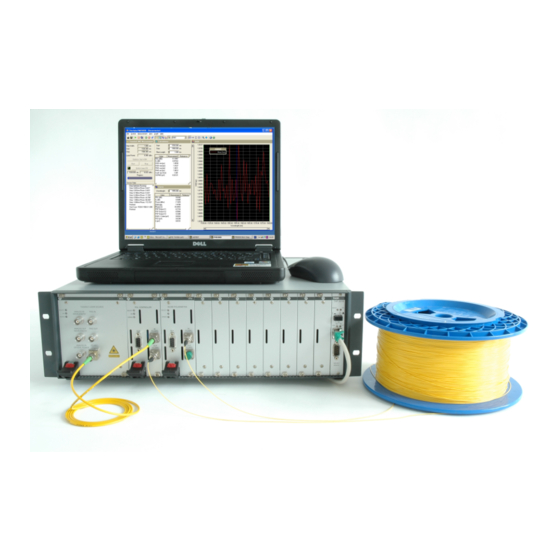
Parts List - Accessories A complete PMD measurement system based on the JME consists of a tunable laser source, a SOP controller and a polarimeter. Thorlabs offers 4 different models of the PMD5000 system. Thorlabs offers an integrated tunable laser source, the ECL5000D, and drivers for external laser sources. -
Page 9: License Key
· Cross Link Cable (CABCRO) License Key To use all features of the PMD5000 software the license key has to be installed. Without the license key you can run the PMD5000 software as evaluation software. That means you can load measurement files (*.pmd) and analyze the data. - Page 10 PMD5000 Key CD-ROM into your CD-ROM drive. Follow the instructions of the installation wizard. The license key is already installed on your preconfigured Laptop for the PMD5000 system. © <2006> Thorlabs...
- Page 11 Getting Started PMD5000 Part...
-
Page 12: Part Ii Getting Started
PMD5000 Getting Started This section is provided for those interested in getting the PMD5000 up and running quickly. The more detailed description and advanced features are described in the following sections. Quick Start-up The system comes with an already preconfigured computer. You can also install the TXP5000 software and the PMD5000 software on your own computer using the supplied installation CDs. - Page 13 12.Press the 'Start' button from the 'Standard JME Measurement' window to perform the measurement. You can also select 'Measurement / Start Scan' by simply pressing the 'F5' key on your keyboard or click on the 'Run New © <2006> Thorlabs...
-
Page 14: Export And Save Data
PMD5000 Measurement' button from the tool bar to run the measurement. 13.During the measurement the result is continuously updated in the diagram. If nothing is shown in the diagram during the scan the view area does not cover the measurement data. Simply click on the button 'Zoom Out to Full View' or press the 'Home' key on your keyboard. -
Page 15: Setup
Setup Description: Tunable Laser Source The Thorlabs ECL5000D tunable laser source is used to generate laser light from 1520nm to 1630nm. The laser output power can be set from 0.5 to 10mW. The tuning step width is variable, which is important for ©... -
Page 16: Theory Of Operation
PMD5000 accurate DGD measurements. An alternative is to use a third party tunable laser source. Ask our Tech Support Team for available lasers. SOP Generator The DPC5500 generates the SOPs necessary to perform Jones Matrix analysis. Device Under Test (DUT) The DUT can be a long fiber of an optical network or a narrow bandwidth device. - Page 17 (result of measurement / in a mathematical sense). SOPMD: The second order PMD is the meanvalue of the second order DGD distribution averaged over the wavelength range. For a more detailed description see Definitions and Terms section. © <2006> Thorlabs...
- Page 18 Hardware Description PMD5000 Part...
-
Page 19: Part Iii Hardware Description
(IL). Passive components like couplers and isolators can be measured as well as active components (EDFAs and PDFAs). The PMD5000 system is modular. Each module can be used by its own. The measurement system can also be upgraded to measure already installed fibers or to monitor the DGD of one channel of an in-use DWDM system. -
Page 20: Installing And Removing Cards
All Slots of the TXP must be occupied, either by a card or by a blind module to maintain proper air flow for internal cooling! NOTE The PMD5000 application has to be stopped before you remove a card. After a card is exchanged the application has to be restarted. For more information refer to the TXP5016 manual. - Page 21 Operating Instruction PMD5000 Part...
-
Page 22: Part Iv Operating Instruction
An installation panel appears. Following the instructions of the installation wizard. 3. Proceed as described above depending on your PMD5000 system. The TXP system is now ready for operation and you can start the PMD5000 graphical user interface (GUI). © <2006>... -
Page 23: The Graphical User Interface (Gui)
4.2.1 Start the GUI The PMD5000 software can be started by clicking on the desktop icon. You can also select 'Programs' via the START button in the Windows task bar and then choose 'All Programs / TXP Series / TXP PMD5000'. The graphical user interface (GUI) appears. -
Page 24: Laser Configuration
PMD5000HDR-1 are equipped with the ECL5000. The systems PMD5000FIN-2 and PMD5000HDR-2 work with external tunable laser sources. Currently the Agilent 8164A system and the Ando AQ4320D are available. Contact Thorlabs for the latest information about the supported laser sources. Select Laser Type Select the laser you want to use in your PMD system. - Page 25 ECL5000D Configuration Window IP / Hostname Contains the IP address of the TXP mainframe. The PMD5000 system consists of a TXP5016. This mainframe has a fixed IP address by default for example 192.xxx.xxx.xxx. Please refer to the operating manual of the TXP5016 for more information about the IP address.
- Page 26 PMD5000 Figure 14 Agilent 8164A Configuration Window Check Box If the external tunable laser source is used with a different computer which acts as a VISA Remote Server set the check box 'Use VISA Remote Server'. The controls 'IP / Hostname' and 'Port' will be enabled and can be altered.
-
Page 27: Visa Remote Server
4.2.2.2 VISA Remote Server The PMD5000 system offers the possibility to use external tunable laser sources (TLS) from third party manufacturer. Most of these TLS have a GPIB interface. It is not absolute necessary to connect the external laser to the computer where the PMD5000 software is running but to another computer next to the PMD5000 system. - Page 28 Configure the VISA Remote Server To configure a VISA server the full version of the VISA runtime engine 3.0 or later from National Instruments which is not supplied with the PMD5000 software is required. 1. Start the NI Measurement & Automation software by clicking the 'START' button from the left lower corner of your desktop and selecting 'All Programs / National Instruments / Measurement &...
-
Page 29: Sop Controller Configuration
5. Depending on your NI MAX version you may have to apply or save your changes. 4.2.2.3 SOP Controller Configuration The SOP Controller is the DPC5500. Analog to the tunable laser the default connection data are automatically loaded during the start up. Currently there is only the DPC5500 polarization controller available. © <2006> Thorlabs... - Page 30 IP / Hostname Contains the IP address of the TXP mainframe. The PMD5000 system consists of a TXP5016. This mainframe has a fixed IP address by default for example 192.xxx.xxx.xxx. Please refer to the operating manual of the TXP5016 for more information about the IP address.
-
Page 31: Polarimeter Configuration
4.2.2.4 Polarimeter Configuration The receiver is a polarimeter module. Depending on your PMD5000 system you can have the fast in-line polarimeter (IPM5300) or (PAX5720IR3). From the 'Select Polarimeter Type' selection you can make your choice. Figure 21... - Page 32 PMD5000 IP / Hostname Contains the IP address of the TXP mainframe. The PMD5000 system consists of a TXP5016. This mainframe has a fixed IP address by default for example 192.xxx.xxx.xxx. Please refer to the operating manual of the TXP5016 for more information about the IP address.
- Page 33 As smaller the index as faster is the polarization measurement and therefore the PMD measurement process. If the laser source has a small power or is unstable a higher 'Speed Index' should be used. The following table shows the relation between index and average time. © <2006> Thorlabs...
-
Page 34: Connection
PMD5000 Speed Index Average Time 10µs 30µs 100µs 300µs 10ms 30ms 100ms 300ms Table 2 Speed Index IPM Average Type You can choose between 'Current' and 'DOP' mode. The 'Current' mode is the standard mode. All polarization states are averaged which can yield a DOP less than 100% if there is a large SOP variance. -
Page 35: Measurement
See Cursor Control section for details. All parameters which effect the measurement as well as the control buttons are placed in the window 'Standard JME Measurement'. The following figure shows the PMD5000 GUI with the graph selection. © <2006> Thorlabs... -
Page 36: Measurement Configuration
PMD5000 Figure 25 Selection of the Graph 4.2.4.1 Measurement Configuration The 'Standard JME Measurement' window is shown in the following figure. This window can be hidden. Select 'View / Measurement Configuration' from the menu or the button 'View Measurement Configuration Panel' from the tool bar to show or hide the 'Standard JME Configuration' window. - Page 37 DGD distributions. Fibers with a strong mode coupling have a broad distribution (like the Maxwellian) and a saftx factor of 8 should be used. For detailed information about step width and accuracy refer to the application note: Accuracy. © <2006> Thorlabs...
- Page 38 PMD5000 Wavelength Step Size 1550nm Wavelength Range [nm] Maximum measurable Safely measured PMD [ps] with DGD [ps] mode coupling weak strong 0.01 50.00 0.02 25.00 0.05 80.0 40.0 12.50 0.10 40.0 20.0 10.00 0.20 20.0 10.0 2.500 0.50 8.00 4.00 1.000...
-
Page 39: Start A Single Measurement Scan
4.2.4.3 Repeated Measurement Scans The PMD5000 system offers the feature to perform repeated DGD measurement scans over a long period of time with an optional interlaced loop. If connected select 'Measurement / Repeated Scan...' from the menu. The following panel appears. - Page 40 PMD5000 Figure 27 Repeated Scan Setup Target Directory The target directory specifies the directory where the result files with the measurement data are stored. You can change the target directory by clicking the browse button Target File Prefix This string defines the prefix of the data files. In the example above the name of a data file would be RepMeasFile_0000000000.pmd.
- Page 41 Here you can add a certain comment to the file. Timer The PMD5000 application offers the feature of two interlaced timer loops for repeated measurement scans. This means it is not only possible to arrange repeated measurements with a certain time frame but also to perform several measurements with a certain time frame then have another longer time frame for all these measurements and start it again.
- Page 42 PMD5000 immediately. Repetitions This control sets the numbers of single measurement scans for one cycle. Up to 65500 repetitions are possible. Start next Scan immediately This check box enables / disables the 'Start Time Raster'. If checked, a single scan will be immediately started after the previous scan has finished.
-
Page 43: Measurement Results
Only the values in the range defined by 'Start' and 'Stop' are considered. Please refer to the Data Analysis section for more details. Figure 30 Calculations Window © <2006> Thorlabs... - Page 44 PMD5000 Recall that the PMD value is either the mean average ('Avg') or the RMS average ('RMS') of the DGD distribution. Both values are given for convenience. The RMS PMD value is a measure for the width of the DGD distribution, whereas the mean PMD value is the average of the distribution.
-
Page 45: Diagrams
4.2.5.1.1 PDL Diagram The PDL graph shows the measurement data of the polarization dependent loss vs. wavelength. It is given in [dB]. For each wavelength point exists a measured PDL value. Figure 31 PDL Diagram © <2006> Thorlabs... -
Page 46: Il Diagram
PMD5000 4.2.5.1.2 IL Diagram The graph IL shows the measurement data of the insertion loss vs. wavelength. It is given in [dB]. For each wavelength point a measured IL value exists. You can enter an additional 'System Loss' which will be subtracted from the measured IL. -
Page 47: Power Diagram
4.2.5.1.3 Power Diagram The graph Power shows the measurement data of the detected power vs. wavelength at the polarimeter. It is given in [dBm] or [Watt]. For each wavelength point a measured power value exists. Figure 33 Power Diagram © <2006> Thorlabs... -
Page 48: Dgd Diagram
PMD5000 4.2.5.1.4 DGD Diagram The graph DGD shows the Differential Group Delay vs. wavelength. It is given in [ps]. To obtain a single DGD value two Jones matrices are necessary. The resulting DGD value is then displayed for the mean value of both wavelength points. -
Page 49: Dgd Histogram
The number of columns can be set selecting 'View / Preferences / Display Options ...'. See Display Options for more information. The occurrence is given in % of all DGD values within the calculation range. Figure 35 DGD Histogram © <2006> Thorlabs... -
Page 50: Phase Diagram
PMD5000 4.2.5.1.6 Phase Diagram The Phase graph shows the phase difference between the fast and slow principal state in degrees. The phase range is limited mathematically to 0 ... 180°. You must ensure that the phase shift remains in this range by selecting a suitable wavelength step. -
Page 51: 2Nd Order Dgd Diagram
Since two DGD values are used to calculate a single SODGD value and two Jones matrices are necessary to calculate a single DGD value Jones matrix measurement at three different wavelengths has to be done. Scanning N wavelength points yield N-2 SODGD values. Figure 37 2nd Order DGD Diagram © <2006> Thorlabs... -
Page 52: 2Nd Order Dgd Histogram
PMD5000 4.2.5.1.8 2nd Order DGD Histogram The SODGD histogram shows the statistical distribution of the measured SODGD values. The range of the x- axis is set to the minimum and maximum value of the data set defined by the calculation range. The x- axis is split into a fixed number of columns equally spaced. -
Page 53: Psp Diagram
Operating Instruction 4.2.5.1.9 PSP Diagram The graph PSP Stokes graph shows the fast Principal State of Polarization vs. wavelength. The PSP is given as normalized Stokes parameter. Figure 39 PSP Diagram © <2006> Thorlabs... -
Page 54: Pcd Diagram
PMD5000 4.2.5.1.10 PCD Diagram The second order DGD is the derivative of the DGD vector. It consists of two parts the polarization dependent chromatic dispersion (PCD) and the PSP rotation rate (k). Please refer to the Definitions and Terms section for more information. -
Page 55: Psp Rotation Rate Diagram
4.2.5.2 Data Analysis / Calculations Window The PMD5000 is based on the Jones Matrix Eigenanalyzis (JME). The 'raw' data of a JME measurement is the Jones matrix. This is the base for all calculations to determine the PDL, DGD, PMD etc. Once the Jones matrices for several wavelengths are measured all these data can be calculated. - Page 56 PMD5000 Figure 42 Calculations Window The 'Calculation' window can be hidden. Select 'View / Calculation Window' from the menu or click the button 'View Calculation Panel' from the tool-bar to enable or disable the display of the 'Calculations' window. The controls 'Start' and 'Stop' define the boundaries of the mean value calculations.
-
Page 57: Cursor Control
'Calculations' panel or by drag and drop them with the mouse cursor inside the diagram when working in the 'Move Cursor Mode'. The 'Calculations' panel can be hidden or shown clicking the button 'View Calculations Panel' Figure 43 Boundary Cursor © <2006> Thorlabs... - Page 58 PMD5000 Figure 44 Calculations Window Data Cursor The data cursor represents a measurement value at a single wavelength. You can manually enter a wavelength in nm in the control 'Wavelength' in the 'Cursor' panel. In the field below you will see the values for this single wavelength point for the actual measurement as well as for the reference.
- Page 59 Now release the mouse button. This zoom function will affect both the range of the y-axis and the x-axis. Zoom Out You can zoom out of the graph either by selecting 'Graph / Zoom out' from the © <2006> Thorlabs...
-
Page 60: Saving Data
Saving Data The measurement data can be saved for later use with third party software like Microsoft Excel™ or Mathlab™. The PMD5000 software offers two different kinds of data handling. The first one saves the *.pmd data which includes the Jones matrices for all wavelength points but no measurement results like PDL and DGD. - Page 61 The scanner name is also listed which is the 'Standard JME Scan' as the only available scanner at this time. Furthermore, there are the numbers of the measurement sample values and a user defined comment. © <2006> Thorlabs...
- Page 62 PMD5000 Figure 48 Export File Header The next part contains the minimum and maximum values of the complete measurement range. This includes the IL, power, PDL, DGD and second order DGD. You will also find the average values for each of these parameters for the selected wavelength range.
- Page 63 - Absolute value of the element 10 of the Jones matrix. JM10Phi - Phase of the element 10 of the Jones matrix given in radiant. JM11R - Absolute value of the element 11 of the Jones matrix. © <2006> Thorlabs...
-
Page 64: Program Navigation
- Rotation rate of the PSPs. 4.2.6 Program Navigation The PMD5000 software offers different possibilities to navigate through its extensive functions. The toolbar features several shortcuts for function which of course can also be accessed via the menu bar. Furthermore, there are controls ©... -
Page 65: Menu Bar
Figure 52 File Menu System Menu In the 'System' menu you find all functions regarding your actual PMD5000 system. You can configure your system and connect / disconnect the complete system. Refer to the Configuration section for further information. - Page 66 PMD5000 Figure 54 Measurement Menu View Menu The 'View' menu contains all functions to configure the display. The 'Standard JME Measurement', 'Calculations', 'Cursor' and the 'Graph Legend' windows as well as the reference graph can be shown or hidden. Furthermore the data which are shown in the graph can be selected.
-
Page 67: Tool-Bar
You will find the online help in the menu 'Help'. Furthermore, there is a convenient way to visit the Thorlabs Web page to check for the latest drivers or software versions for example. You can also check the current version by selecting 'About...'. -
Page 68: Display Functions
Zooms out by factor 2. Zooms out to full view. Opens an information window about the program. Opens the windows help for the PMD5000. 4.2.6.3 Display Functions All functions to manipulate the diagram display can also be easily accessed by a right click on the diagram area. -
Page 69: Display Configuration
4.2.7 Display Configuration The GUI of the PMD5000 is divided into the menu and tool-bar and the panel section which is subdivided into several windows. All functions for configuration and control can be accessed via the menu bar. See the Program Navigation section for more information. -
Page 70: Color Setup
PMD5000 4.2.7.1 Color Setup The colors of the graph and its curves can be adjusted by selecting 'View / Preferences / Color...' from the menu. The following window appears and you can set the colors to the desired value. If you click on the button 'Default' the factory default will be valid. - Page 71 2dB only 1dB insertion loss is shown in the IL diagram. Power Unit You can choose the power unit in dBm or Watt [W]. Wave Unit The wave unit can be displayed in wavelength [nm], frequency [THz] or wavenumber [1/cm]. © <2006> Thorlabs...
- Page 72 Service and Maintenance PMD5000 Part...
-
Page 73: Part V Service And Maintenance
Excel sheet : · The decimal separator in your Microsoft Excel may be set to ',' instead to '.'. The *.csv files generated by this program requires that Excel interprets '.' as © <2006> Thorlabs... -
Page 74: Service
In normal operation the PMD5000 system does not need any service. For highest precision of the measurement it is recommended to recalibrate the TXP cards of the PMD5000 every two years. You can see the due date of calibration in the card info-menu of the card driver to determine the recalibration date. -
Page 75: Part Vi Appendix
Appendix PMD5000 Part... -
Page 76: Warranty
Appendix Warranty Thorlabs warrants material and production of the PMD5000 for a period of 24 months starting with the date of shipment. During this warranty period Thorlabs will see to defaults by repair or by exchange if these are entitled to warranty. -
Page 77: Technical Data
3) For PMD <0.3ps WEEE As required by the WEEE (Waste Electrical and Electronic Equipment Directive) of the European Community and the corresponding national laws, Thorlabs offers all end users in the EC the possibility to return "end-of-life" units without incurring disposal charges. -
Page 78: Waste Treatment On Your Own Responsibility
6.3.1 Waste Treatment on your own Responsibility If you do not return an "end-of-life" unit to Thorlabs, you must hand it to a company specialized in waste recovery. Do not dispose of the unit in a litter bin or at a public waste disposal site. -
Page 79: Listings
Thorlabs Extended Platform Universal Serial Bus WEEE Waste Electrical and Electronic Equipment Directive 6.4.2 List of Figures Figure 1 PMD5000 Graphical User Interface Figure 2 Connect to the System Figure 3 Standard JME Measurement Window Figure 4 Measurement Scan finished... - Page 80 PMD5000 Figure 7 Jones Matrix Eigenanalyzis Figure 8 PMD5000FIN Figure 9 PMD5000HDR Figure 10 PMD5000 Graphical User Interface Figure 11 System Configuration Figure 12 Main Configuration Window Figure 13 ECL5000D Configuration Window Figure 14 Agilent 8164A Configuration Window Figure 15...
-
Page 81: Addresses
Email: sales@thorlabs.jp Web: http://www.thorlabs.com Our company is also represented by several distributors and sales offices throughout the world. Please call our hotline, send an Email to ask for your nearest distributor or just visit our homepage http://www.thorlabs.com © <2006> Thorlabs... - Page 82 Application Notes PMD5000 Part...
-
Page 83: Part Vii Application Notes
(PCD) and the perpendicular part (W w^ ) represents a frequency dependent rotation of the PSP (k). SOPMD The second order PMD is the meanvalue of the distribution averaged over the wavelength range. It is calculated © <2006> Thorlabs... - Page 84 PMD5000 according to the following formula: The factor of 0.5 is due to theory. The PSP vector S the above formula is the normalized unit vector pointing into the direction of the fast principal state. N is the number of wavelength points at which the Jones matrix is measured.
-
Page 85: Accuracy
Obviously, this has an impact on the PMD accuracy of random mode coupled devices (see below). Question 2: What is the accuracy of the PMD5000 for a single DGD measurement? Answer 2: There are different parameters which influence the accuracy of the determined DGD. - Page 86 PMD5000 measurement data. The function 'Optimize Step Width' determined the step width of 0.5nm which has a minimum safety factor of 2. Therefore it is possible to increase the step width to 1.0nm. The phase has a maximum of about 109° at the start wavelength. The phase is doubled with a step width of factor 2.
- Page 87 0.1nm. The phase is in the range of 10° and has a high noise. The single DGD values are erroneous whereas the PMD is the same as for the reference data with a step width of 0.5nm. It can be clearly © <2006> Thorlabs...
- Page 88 Correlating Phase of a PMF measured with a step width of 0.5nm and 0.1nm You will find these measurement files in the directory 'C:\Program Files\TXP Series\TXP PMD5000\OnlineHelp\Examples'. The file names are 'PMF StepWidth 0.1nm.pmd', 'PMF StepWidth 0.5nm.pmd', 'PMF StepWidth 1.0nm Scan 01.pmd' and 'PMF StepWidth 2.0nm.pmd'.
- Page 89 (TLS). Since the PMD5000 system does not measure the wavelength increment it relies on the stepping accuracy of the TLS. A 10% error on Dl resp.
- Page 90 One would have to extend to a 100nm wavelength window to achieve the 10% accuracy. Compared to that the error of the PMD5000 for measuring a single DGD value (<10fs) is almost negligible if the tunable laser is behaving well while stepping.
- Page 91 Application Notes Maxwellian distribution. For a deterministic component the DGD distribution is normal and the accuracy is given by the standard error of an average value with N the number of samples. © <2006> Thorlabs...
-
Page 92: Measurement Of Fibers
PMD5000 Measurement of Fibers The results of a PMD measurement of fibers depends strongly on the measurement configuration. The effect of PMD is shown in the following picture. Figure PMD Effect Standard single mode fibers (SMF), polarization maintaining fibers (PMF) and combinations of them show different behaviors and therefore yield different results. - Page 93 20nm whereas the current measurement scan was taken with 5nm. Figure DGD of a SMF A typical behavior of a SMF is the relatively smooth change of the PSP as it can be seen in the diagram below. © <2006> Thorlabs...
- Page 94 Figure PSP of a SMF You will find these measurement files in the directory 'C:\Program Files\TXP Series\TXP PMD5000\OnlineHelp\Examples'. The file names are 'SMF StepWidth 5.0nm.pmd' and 'SMF StepWidth 20.0nm.pmd'. Polarization Maintaining Fibers A polarization maintaining fiber has a large difference of the refractive index in x- and y- direction.
- Page 95 See the Accuracy section for more details. Also the Stokes parameter for a PMF patch-cord is nearly constant over wavelength as it can be seen in the diagram below. © <2006> Thorlabs...
- Page 96 PSP of a PMF Patch-Cord You will find these measurement files in the directory 'C:\Program Files\TXP Series\TXP PMD5000\OnlineHelp\Examples'. The file names are 'PMF StepWidth 1.0nm Scan 01.pmd' and 'PMF StepWidth 1.0nm Scan 02.pmd'. Combination of Single Mode and Polarization Maintaining Fibers If SMFs and PMFs are connected to each other the DGD and PSPs are completely different to the smooth graphs shown above.
- Page 97 PSP of a Combination of SMF and PMF Patch-Cords You will find these measurement files in the directory 'C:\Program Files\TXP Series\TXP PMD5000\OnlineHelp\Examples'. The file names are 'SMF and PMF StepWidth 0.5nm Scan 01.pmd' and 'SMF and PMF StepWidth 0.5nm Scan 02.pmd'.
-
Page 98: Measurement Of Narrow Bandwidth Components
PMD5000 Measurement of Narrow Bandwidth Components The difficulty of DGD (differential group delay) measurement for narrow band components like filters arises from the conflict of measuring small DGD values with small wavelength resolutions (step width) due to the band structure of the filtering device. - Page 99 1555.5nm which is marked by the green cursors. It gives only a rough idea about the measurement data over wavelength. The second scan was done with 0.05nm step width which provides 40 measurement points. It is drawn as red curve and gives a better overview about this FBG. © <2006> Thorlabs...
- Page 100 PMD5000 Figure IL of a FBG in Reflection Figure DGD of a FBG in Reflection © <2006> Thorlabs...
- Page 101 Therefore it is recommended to use a large wavelength step width which is still small enough to obtain a reasonable amount of DGD data within the bandwidth. Figure IL of a FBG in Reflection © <2006> Thorlabs...
- Page 102 PMD5000 Figure DGD of a FBG in Reflection You will find these measurement files in the directory 'C:\Program Files\TXP Series\TXP PMD5000\OnlineHelp\Examples'. The file names are 'FBG StepWidth 0.01nm.pmd', 'FBG StepWidth 0.05nm.pmd' and 'FBG StepWidth 0.1nm.pmd'. © <2006> Thorlabs...
-
Page 103: Index
CSV File 37, 58 Help Menu 63 Current Mode 27, 29 Histogram Columns 68 Cursor 53, 55 Hostname 22, 27, 29 - D - - I - Data Cursor 55 IL Diagram 44 Data Export 12, 58 Insertion Loss 44 © <2006> Thorlabs... - Page 104 PMD5000 Installing TXP Cards 18 - P - Interlace Timer 37 Interlaced Measurement Scans 37 Part List 6 IP 22, 27, 29 Patchcords 20 IPM5300 29 PAX5720IR3 29 - J - PCD 81 PCD Diagram 52 JME 14 PDL 14...
- Page 105 System Menu 63 - T - Target Directory 37 Target File Prefix 37 Technical Data 75 Theory of Operation 14 Thorlabs ECL5000D 22 Timeout 22, 29 Timer 37 TLS 22 Tool Bar 65 Troubleshooting 71 Tunable Laser Source 13, 22...
Need help?
Do you have a question about the PMD5000 and is the answer not in the manual?
Questions and answers