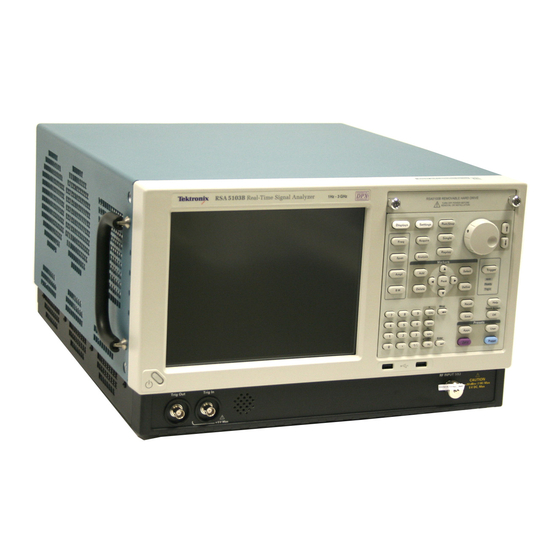
Tektronix RSA5103B RSA5106B RSA5115B RSA5126B Quick Start User Manual
Real-time spectrum analyzers
Hide thumbs
Also See for RSA5103B RSA5106B RSA5115B RSA5126B:
- Technical reference (153 pages) ,
- Declassification and security instructions (17 pages) ,
- Instructions manual (16 pages)

Related Manuals for Tektronix RSA5103B RSA5106B RSA5115B RSA5126B


Summary of Contents for Tektronix RSA5103B RSA5106B RSA5115B RSA5126B
- Page 1 RSA5100B Series Real-Time Spectrum Analyzers Quick Start User Manual *P071322411* 071-3224-11...
- Page 3 RSA5100B Series Real-Time Spectrum Analyzers Quick Start User Manual www.tek.com 071-3224-11...
- Page 4 Copyright © Tektronix. All rights reserved. Licensed software products are owned by Tektronix or its subsidiaries or suppliers, and are protected by national copyright laws and international treaty provisions. Tektronix products are covered by U.S. and foreign patents, issued and pending. Information in this publication supersedes that in all previously published material.
- Page 5 Warranty Tektronix warrants that this product will be free from defects in materials and workmanship for a period of one (1) year from the date of shipment. If any such product proves defective during this warranty period, Tektronix, at its option, either will repair the defective product without charge for parts and labor, or will provide a replacement in exchange for the defective product.
-
Page 7: Table Of Contents
Table of Contents Table of Contents Important safety information ......................General safety summary.. - Page 8 Table of Contents Index RSA5100B Series Quick Start User Manual...
-
Page 9: Important Safety Information
Important safety information Important safety information This manual contains information and warnings that must be followed by the user for safe operation and to keep the product in a safe condition. To safely perform service on this product, additional information is provided at the end of this section. (See page v, Service safety summary.) General safety summary Use the product only as specified. - Page 10 The product is heavy. To reduce the risk of personal injury or damage to the device get help when lifting or carrying the product. Use only the Tektronix rackmount hardware specified for this product. RSA5100B Series Quick Start User Manual...
-
Page 11: Service Safety Summary
Important safety information Service safety summary The Service safety summary section contains additional information required to safely perform service on the product. Only qualified personnel should perform service procedures. Read this Service safety summary and the General safety summary before performing any service procedures. To avoid electric shock. -
Page 12: Compliance Information
EN 61000-3-2:2006. AC power line harmonic emissions EN 61000-3-3:1995. Voltage changes, fluctuations, and flicker European contact. Tektronix UK, Ltd. Western Peninsula Western Road Bracknell, RG12 1RF United Kingdom This product is intended for use in nonresidential areas only. Use in residential areas may cause electromagnetic interference. -
Page 13: Safety Compliance
Compliance information Australia / New Zealand Declaration of Conformity – EMC Complies with the EMC provision of the Radiocommunications Act per the following standard, in accordance with ACMA: CISPR 11:2003. Radiated and Conducted Emissions, Group 1, Class A, in accordance with EN 61326-1:2006 and EN 61326-2-1:2006. - Page 14 Compliance information Pollution degree descriptions A measure of the contaminants that could occur in the environment around and within a product. Typically the internal environment inside a product is considered to be the same as the external. Products should be used only in the environment for which they are rated.
-
Page 15: Environmental Considerations
This symbol indicates that this product complies with the applicable European Union requirements according to Directives 2012/19/EU and 2006/66/EC on waste electrical and electronic equipment (WEEE) and batteries. For information about recycling options, check the Support/Service section of the Tektronix Web site (www.tektronix.com). -
Page 16: Preface
Preface Preface This manual describes the installation and basic operation of the RSA5100B Series Real-Time Signal Analyzers. For more detailed information, see the instrument help. RSA5103B RSA5106B RSA5115B RSA5126B Key Features The RSA5100B Series is a family of high-performance real-time signal analyzers. Key features include: Reduce Time-to-Fault and increase design confidence with Real-time Signal Processing Swept DPX spectrum enables unprecedented signal discovery over full frequency range Advanced DPX including swept DPX, gap-free DPX spectrograms, and DPX zero span with real-time amplitude,... -
Page 17: Documentation
Preface Documentation The following documentation is available for your Tektronix RSA5100B Series Signal Analyzers. For the most current documentation, refer to the Tektronix Web site. To read about Use these documents Installation and operation Quick Start User Manual (overviews) The quick start user manual contains general information about how to put your instrument into service and guides to user interface controls. -
Page 18: Software Upgrades
To check for upgrades: 1. Use your Web browser to go to www.tektronix.com/software. 2. Enter the product name (for example RSA5126B) to find available software upgrades. Conventions Used in This Manual... -
Page 19: Installation
Before Installation Unpack the instrument, and check that you received all items listed as Standard Accessories. Optional accessories and instrument options are also listed in this section. Check the Tektronix Web site (www.tektronix.com) for the most current information. Standard Accessories Your instrument comes with the following accessories: product documentation (listed below), power cord, USB keyboard, USB mouse, and instrument front cover. -
Page 20: Optional Accessories
SignalVu-PC – Offline analysis software based on the RSA5000/6000 Series platform. RSAVu – Offline analysis software based on the RSA3000 platform for analysis supporting 3G wireless standards Planar Crown 3.5 mm female connector, Tektronix part number 131-9062-00. Planar Crown 3.5 mm male connector, Tektronix part number 131-8822-00. - Page 21 Installation Option B25 - Adds 25 MHz real-time capture bandwidth (no cost option). Option B40 - Adds 40 MHz real-time capture bandwidth. Option B85 - Adds 85 MHz real-time capture bandwidth. Option B16x - Adds 165 MHz real-time capture bandwidth. Option 50 - Adds 1 MHz to 3/6.2 GHz Pre-Amplifier (RSA5103B/RSA5106B only).
-
Page 22: Upgrades
Installation Upgrades Windows 7 RSA5BUP Option SSD; Adds an additional removable solid-state drive for units equipped with Option 56. The Windows 7 operating system and instrument software is preinstalled. RSA5BUP Option 56; An internal solid-state drive. The Windows 7 operating system and instrument software is preinstalled. -
Page 23: Operating Considerations
Installation Operating Considerations Power supply requirements Source voltage and frequency Power consumption 100 – 240 V , 50/60 Hz 450 W maximum (all models) 115 V , 400 Hz Environmental requirements Characteristic Description Operating temperature +10 °C to +40 °C Non-operating temperature -20 °C to +60 °C Humidity... -
Page 24: Connecting To The Instrument
Installation Connecting to the Instrument Connecting to a Network Connect your keyboard, mouse, printer, and other accessories to your instrument before applying power. (Accessories with USB connectors can be connected before or after applying power.) You can connect your instrument to a network for printing, file sharing, Internet access, and other functions. -
Page 25: Powering On The Instrument
Installation Powering On the Instrument Powering Off the Instrument Removing the Power CAUTION. Do not remove the power cord while the instrument is running. Power off the instrument first, allowing the instrument to completely shut down before removing the power cord. The fans stopping is a good indicator. RSA5100B Series Quick Start User Manual... -
Page 26: Adding An External Monitor
Installation Adding an External Monitor Use the following procedure to add an external monitor for dual monitor configuration. Both the analyzer and the second monitor must have the color set to True Color. NOTE. The Windows navigation in the following procedure is based on the Windows 7 operating system. Navigation may vary from these procedures if you have a Windows 10 operating system installed. - Page 27 Installation 4. Open the Windows Control Panel. 5. Double-click Intel(R) Graphics and Media to open the Intel Graphics and Media Control Panel. 6. Set the Display setting to Built-in Display. RSA5100B Series Quick Start User Manual...
- Page 28 Installation 7. Click Multiple Displays. 8. Set the Operating Mode to Clone Displays or Extended Displays as preferred. 9. If you select Extended Desktop, be sure to set the Positioning to align the two desktop displays. RSA5100B Series Quick Start User Manual...
- Page 29 Installation Adjusting the Windows Display Settings To change the instrument display settings, use the Intel Graphics Driver instead of the default Windows display properties. The Intel Graphics Driver provides additional capabilities that are not accessible from the Windows display properties dialog box.
-
Page 30: Inspecting The Instrument
Installation NOTE. You can attach a second monitor after the analyzer is powered on; however, after connecting, you will still need to enable the Extended Desktop from the Intel Extreme Graphics 2M control panel. Inspecting the Instrument Run the diagnostics application (Tools > Diagnostics). If failures occur, perform the following steps to get more information about them. -
Page 31: User Maintenance
Installation User Maintenance Caring for the Planar Crown RF Input Connector (RSA5115B/RSA5126B Only) The Planar Crown input connector consists of two parts. The first part is the Planar Bulkhead, which is mounted in the instrument front panel. The second part of the input connector is the Planar Crown, which mates to the Planar Bulkhead. The Planar Crown can be easily changed should the connector become damaged or a different connector type be required. - Page 32 Software upgrades are available by downloading them from the Tektronix Web site www.tektronix.com/software. To add additional software options or features, you will need an option key from Tektronix. When you receive the option key from Tektronix, follow the installation instructions provided with the upgrade.
-
Page 33: Operation
Operation Operation Getting Acquainted with Your Instrument Controls and display elements are shown in the following illustrations and tables. Front Panel Controls Most front panel controls are shortcuts for opening control panels. Ref number Item Description Menu equivalent Media Optional removable solid-state hard drive. Displays Opens the Displays dialog box to select measurement Setup >... - Page 34 Operation Ref number Item Description Menu equivalent Run (Stop) Push to start and stop acquisitions. Run > Run Markers, Peak Moves the active marker to the maximum peak of the trace in the selected display. If markers are turned off, the MR (marker reference) marker will appear at the maximum peak.
- Page 35 Operation Ref number Item Description Menu equivalent Keypad Enters values in controls. Enter Completes the data entry in controls. Same as pressing the Enter key on the keyboard. RSA5100B Series Quick Start User Manual...
- Page 36 Operation Ref number Item Description Menu equivalent Recall File > Recall Opens the Recall dialog box. Save Saves working file using the same user selections as for the File > Save previous Save action. Touch Screen Off Turns the touch screen on and off. Help Displays the online help.
- Page 37 Operation Front Panel Connectors Ref number Item Description Trig Out Trigger output connector. 50 Ω, BNC, High > 2.0 V, Low < 0.4 V, (output current 1 mA) Trig In External Trigger input connector, –2.5 V to +2.5 V range, trigger level is user adjustable USB port USB 2.0 connector...
- Page 38 Operation Rear Panel Ref number Connector, Description AC Input, main power connector GPIB Zero Span Analog Out (Option 66) 4, 5 Real Time I and Q Out (Option 65) +28 VDC output, switched Microphone in; Headphone, audio output; and Line In connectors (Line In not supported) External Trigger 2 Input COM 2, serial port for connecting peripherals VGA external monitor output (resolution not limited to VGA)
- Page 39 Operation Interface and Display Elements Commonly-used buttons and controls are located in the tool bar. Most of the buttons open control panels for changing the instrument setups. The contents of the control panels vary depending on the selected display. You can also access the control panels from the front panel buttons or from the keyboard.
- Page 40 Operation Setting Description number Acquire Opens the Acquire control panel, which displays the Sample Rate and Record length of the recalled waveform file. Analysis Opens the Analysis control panel so that you can define the analysis settings such as frequency, analysis time, and units. Amplitude Opens the Amplitude control panel so that you can define the Reference Level, configure internal attenuation, and specify external gain/loss corrections.
- Page 41 Operation The Edit Favorites icon allows you access the below menu, which allows you to edit the contents of the Favorites bar. Reference Level Displays the reference level. To change the value, click the text and enter a number using a keyboard, or use a mouse scroll wheel. Frequency Displays the frequency at which measurements are made.
- Page 42 Operation Display-Specific Controls Most displays have commonly-used controls arranged around the graph. They provide quick access to common settings; the full control set for the display is in the Settings control panel. The following illustration and table show some of the common icons that appear in most displays.
-
Page 43: Basic Concepts
Real Time Analyzers Tektronix real-time analyzers have a frequency mask trigger. The frequency mask trigger allows you to set up a spectral mask to capture a signal when a spectral anomaly occurs. This allows the analyzer to check 100% of the input signal before acquiring, and then capture precisely the intermittent RF event of interest. - Page 44 Operation This example shows the window with two displays, a Spectrum display and a DPX spectrum display. When you have more than one display open, the display with the check mark icon has control over the acquisition hardware. To give a display priority over any others, click its title bar.
-
Page 45: Navigating Displays
Operation Navigating Displays The analyzers use multiple displays to keep operations simple, and yet provide advanced functionality when needed. Some of the display categories include: General Signal Viewing displays. These displays show graphs for basic signal parameters such as amplitude, phase, and frequency plotted against frequency or time. - Page 46 Operation Return loss. Available with Option 60. Provides return loss, VSWR, cable loss, and distance to fault measurements. Noise Figure. Available with Option 14. These displays measure the noise contributions in a system. Displays include Noise Figure, Gain, Y-factor, Noise Temperature, Uncertainty Calculator, and tabular results. Single-frequency metering and swept-trace results are available, as well as support for industry-standard noise sources.
-
Page 47: Selecting Displays
Operation Selecting Displays The analyzer provides an easy way to select displays. 1. Click the Displays icon to open the Select Displays dialog box. There are two ways to select displays: choose any combination of displays or use an Application Preset. Choose any Combination of Displays. - Page 48 Operation Use an Application Preset. Select displays from the presets for your application. 1. Click Application Presets in the Select Displays dialog box. 2. Use the pull down list to display the presets. NOTE. Some presets appear only if the associated instrument option is installed.
- Page 49 Operation 4. The default displays for the selected preset are shown. 5. Click OK to close the dialog box. The preset displays will open. (See Table 2.) Table 2: Application presets Presets Displays Time-Frequency Analysis Frequency vs Time, Spectrogram, Spectrum, Time Overview Spectrum Analysis Spectrum Modulation Analysis (Option 21 only)
- Page 50 Operation Use a Standards Preset. When you select a specific standard from the Standards presets, the analyzer automatically loads the displays and settings that are optimal for analysis of signals based on that standard. 1. Select Presets > Standards from the main menu bar.
- Page 51 Operation Quick Tips Push the Displays button on the front panel to open the Select Displays dialog box. To add a display, double-click the icon. To remove displays, do one of the following: Select a display icon in the Selected Displays list, and then click Remove. Double-click a display icon in the Selected Displays list.
- Page 52 Operation Changing Measurement Settings The displays have settings that control how signals are acquired and processed. The settings that you can change depend on the selected display. To access the settings (in this case, for the Spectrum display): RSA5100B Series Quick Start User Manual...
- Page 53 Operation 1. Click Settings to open the Settings control panel. 2. Adjust the controls as needed for your signal or test. For example, use the Freq & Span tab to set frequency and span. Most of the control panels have tabs that provide easy access to other related controls.
- Page 54 Operation Quick Tip If you have multiple displays on the screen, click anywhere inside one of the other displays to change to the control panel for that display. You can adjust many of the parameters of your measurement by clicking on the readout in the display. For example, in the spectrum display, dB/div, RBW, VBW, Span, and Center Frequency can all be accessed on the display without bringing up the Settings panel.
- Page 55 Operation Presetting the Instrument You can preset the instrument to restore the setups to their default values. 1. To start with the default instrument settings, push the Preset button on the front panel or select Preset from the toolbar. Quick Tip Preset does not change any of the settings specified from the Setup >...
-
Page 56: Connecting A Signal
Operation Connecting a Signal The analyzer has a single RF signal input located on the front panel. Make sure that you observe the input signal requirements before connecting a signal to the input. CAUTION. To prevent static damage to the instrument or to any instrument accessories, discharge to ground any electrostatic charge that may be present on the center and outer conductors of cables, before attaching the cables to the instrument inputs. -
Page 57: Starting And Stopping Acquisitions
Operation To connect an RF signal: Connect the signal to the RF INPUT connector on the front panel. NOTE. On RSA5115B and RSA5126B instruments, you can change the RF input connector type by using a different Planar Crown connector. Quick Tip If the source signal exceeds the specified maximum input rating, connect the source signal to an attenuator. - Page 58 Operation 2. Click the Stop button again to stop an acquisition. If an analysis is in process, it will finish its sequence and then stop. Quick Tip Push the front panel Run button to start and stop acquisitions. Run Control The Run menu provides access to commands that control the acquisition and the measurement sequence.
-
Page 59: Markers
Operation Markers Use markers to measure time, frequency, power and other results. Markers measure absolute values and can also measure the difference between markers. Using Markers to Measure Frequency and Power The following procedure shows how to use markers in the Spectrum display to measure frequency and power. The example assumes that all markers are turned off and that a signal is on the screen. - Page 60 Operation Markers Display Reference Marker: This marker type is labeled MR in the graph. It makes absolute measurements and is also used for calculating differences when Delta or Power readouts are enabled. Delta Markers: This marker type is labeled M1 to M4 in the graph. It is used to measure other points on the trace or the difference between the Marker Reference and the Delta marker.
- Page 61 Operation Marker Toolbar The Marker toolbar has several controls to work with markers. (See Table 5.) Some of these controls are similar to those on the front panel. Table 5: Marker toolbar Icon Description Opens the Define Markers control panel. Use the control panel to add and remove markers and to set marker parameters.
-
Page 62: Touchscreen Actions
Operation Defining Markers Use the Define Markers control panel to define the marker settings. 1. Click Define to open the Define Markers control panel. Alternately, press the front panel Markers Define button. Use the control panel to: Add or delete markers. Turn markers off. - Page 63 Operation Table 6: Touchscreen actions menu Icon Menu item Description Select Selects markers and adjusts their position. Span Zoom Zooms the graph area about the selected point. Touch the graph display at a point of interest and drag to increase or decrease the span about the point of interest. Span Zoom adjusts the span control and can affect the acquisition bandwidth.
-
Page 64: Printing
Operation Printing You can print a copy of the screen and its contents (a screen shot) to a printer or a file. 1. Push the Print button on the front panel or select Print from the File menu. 2. Fill out the details in the Print dialog box, and then click OK. - Page 65 Operation Ink Saver Mode You can print screen images with a white background. 1. Select Options from the Tools menu. 2. Select the Prefs tab in the control panel. 3. Set the Color Scheme to Blizzard. The background color changes from black to white in the graphs.
-
Page 66: Saving Data
Operation Saving Data You can save different types of data for future use. 1. Select Save As. from the File menu to open the Save As dialog box. 2. Navigate to the folder where you want to save the setups, or use the default location. - Page 67 Operation Table 7: File types for save (cont.) File types Description Acq Data (acquisition data Saves data for reanalysis by the analyzer (.TIQ) or as CSV (comma-separated value) or and acquisition data export) MAT (Matlab) format to use with external software. Measurement Saves a list of settings relevant to the selected measurement to a TXT (text file).
-
Page 68: Recalling Data
Operation Recalling Data You can recall and reanalyze acquisition data and setup files previously saved by an RSA6100 Series, RSA5100 Series, or SPECMON Series analyzer. 1. Push the Recall button on the front panel or select Recall from the File menu. 2. -
Page 69: Advanced Techniques
Operation Advanced Techniques This section contains advanced operating techniques. For examples of practical applications, see the RSA5100B Series Real-Time Signal Analyzers Application Examples Manual. Setting Up Triggering The analyzers offer real-time power-level triggers, frequency mask trigger, frequency edge trigger, line trigger, runt trigger, DPX density, and external triggers. - Page 70 Operation the Trigger On This™ feature, you can draw a box around the area of interest in the graph, set a Density threshold, and the instrument will trigger when the measured Density exceeds your threshold. Runt Triggering. Runt triggering defines a trigger event based on a pulse amplitude that crosses one threshold but fails to cross a second threshold before recrossing the first.
- Page 71 Operation Accessing Trigger Parameters 1. Click Trig to open the Trigger control panel. Alternately, press the front panel TRIGGER button. 2. As shown in the following steps, click one of the tabs in the Trigger control panel to define the trigger parameters. 3.
- Page 72 Operation Quick Tip Other ways to access the Trigger control panel: Push the Trigger button on the front panel. Select Trigger. from the Setup menu. Setting Up a DPX Density Trigger The DPX Density trigger enables you to capture transient events that may be partially obscured by other higher-amplitude or more frequent signals.
- Page 73 Operation If your expected signal is a continuous tone and you want to capture events when it hops to a different frequency or drops to a lower amplitude, move the Density measurement box to surround the peak of the signal, select Lower in the Density control, and set Threshold to 100%.
- Page 74 Operation Creating a Frequency Mask Use the Mask Editor to create a Frequency Mask. The mask is a set of points defined by frequency and amplitude. Access the Mask Editor from the Trigger control panel. (This procedure uses the Spectrum display.) You can create a Frequency Mask by using either the manual or Auto Draw method.
- Page 75 Operation 7. Click any point in the mask to select it. The frequency and amplitude of the selected point are highlighted in the graph. 8. Edit the point by doing one of the following: Drag and drop the point with the mouse.
- Page 76 Operation Table 8: Trigger violations Violation Description The instrument triggers whenever the signal violates the mask (above the line). The instrument triggers whenever the signal has no points in the mask. T > F One transition defines the trigger event. The signal must go out of the mask (no violation) after being inside of the mask (violation).
- Page 77 Operation Measurements with Conflicting Acquisition Requirements The analyzers let you open any combination of measurements. You can select the displays that you are interested in and the instrument will automatically set up the appropriate analysis and acquisition parameters. If measurements place conflicting requirements on the acquisition parameters, the current selected display takes priority. The following example shows incompatible measurement settings when one display needs real-time data (such as the Amplitude vs Time measurement) while another display requires swept data (such as a Spectrum graph with a very wide span).
- Page 78 Operation 8. Increase the span in the Spectrum display to 200 MHz. Because Spectrum is the selected display, the acquisition parameters adjust automatically to meet the needs of the display. The 200 MHz span exceeds the real-time bandwidth of the instrument.
- Page 79 Operation 11. Decrease the span to 25 MHz in the Spectrum display. Now the acquisitions are real time again. 12. Check the status bar readout to verify that the acquisition is real-time. Both of the displays can run now. RSA5100B Series Quick Start User Manual...
- Page 80 Operation Mask Testing The analyzer lets you test many trace results for changes in level. You can identify matches crossing a power level or you can create a mask that specifies power level and frequency range limits. You can select which trace to test and specify an action to take when a test condition is met for traces in the Spectrum, DPX, Noise Figure, Spurious, and Setting Time displays.
- Page 81 Operation 5. Verify that the trace you selected in the Search in list is the selected trace and that the Show box is checked. 6. Click the Actions tab to specify what actions the analyzer should take when a match occurs. The analyzer can take up to five actions when a match occurs, depending on the run mode.
- Page 82 Operation To perform a Greater Than/ Less Than mask test. 1. Specify what to test for by making a selection from the Test for drop-down list. To test for signal levels above or below a specified level, select either is greater than or is less than.
- Page 83 Operation To perform an Outside/Inside mask test. If you specify a mask-based test, then you need to edit the mask to specify the levels that define a violation. You can do this as follows. 1. Select is outside mask or is inside mask from the Test for menu. 2.
- Page 84 Operation b. To add a new point, check the box next to the target mask (located below the Auto draw button). c. Select Add points located below the Open button. d. Select the target mask (Upper Mask Table or Lower Mask Table) from the drop-down menu. e.
- Page 85 Operation NOTE. Masks are saved in XML format with a .msk extension. 8. To dismiss the Mask Test Editor window, click Done. Mask Test result examples. The following figure shows the results of a Spectrum is outside mask test with Upper Mask enabled.
- Page 86 Operation The following figure shows the results of a failing Noise Figure is outside mask test with Lower Mask and Upper Mask enabled. The red area highlights the area of failure, which occurs at the lower mask. Markers are also in use. RSA5100B Series Quick Start User Manual...
- Page 87 Operation Using Correction Tables The analyzers let you correct the signal displays and measurement results to account for gains and losses in external equipment. You can specify a single gain value or you can use an external loss table to adjust the gain/loss value based on frequency.
- Page 88 Operation 6. Edit the contents of the table to match the loss characteristics of the equipment you are correcting for. Click OK when you are finished. NOTE. You can enter either positive or negative values into the table. But in contrast to the External Gain value setting, positive values represent a loss and negative values represent a gain.
- Page 89 Operation When choosing whether to correct sample data or traces, keep the following in mind: If sample data is acquired while data correction is enabled, that data record is permanently corrected. If the acquisition is saved and recalled, the recalled acquisition includes corrections. Corrections are not saved separately from the raw data;...
- Page 90 Operation Using Audio Demodulation The analyzers can demodulate AM and FM signals, which can help you to analyze known and unknown radio signals. You access the Audio Demod tab from the Settings control panel of the DPX Spectrum plot display. To demodulate an audio signal: 1.
- Page 91 Operation 8. Click the On button to enable audio demodulation. 9. To specify the demodulation type, click either the AM or FM button. NOTE. Note that the AM and FM buttons select only the demodulation type; they do not specify a frequency band. 10.
- Page 92 Operation 13. Click the Define button in the Marker toolbar to display the Define Markers control panel. 14. Click Add to add markers as needed. 15. Click the Settings button to return to the Audio Demod control panel. 16. Set the required receiver bandwidth by entering a value into the Receiver BW value entry box.
- Page 93 Operation 17. Set the receiver frequency. If you specified a marker with the Tune with setting, drag the marker to the required frequency. Fine tune the marker position with the front-panel knob or your mouse wheel. If you selected Frequency control in the Tune with setting, press the front-panel FREQ button, then turn the front-panel knob or use the Freq setting in the toolbar to set...
- Page 94 Operation RSA5100B Series Quick Start User Manual...
- Page 95 59 selecting, 29 network connections, 6 controlling, 58 Documentation, xi is inside mask (Mask Test), 65 data source, 26 Tektronix part numbers, 1 is outside mask (Mask Test), 65 starting, 39 DPX Density Italicized numbers, 24 stopping, 39 triggering, 51...
- Page 96 Index Select Trigger Touchscreen actions menu, 44 control panel, 53 Optional accessories, 2 Selected window, 58 mask, 56 Options Selecting displays, 29 violations, 58 Power cords, 1 Settings Trigger Event parameters, 52 changing, 34 accessing, 53 default, 37 Triggered trigger mode, 51 preset, 37 Triggering Setups...
Need help?
Do you have a question about the RSA5103B RSA5106B RSA5115B RSA5126B and is the answer not in the manual?
Questions and answers