
Subscribe to Our Youtube Channel
Related Manuals for Tektronix RSA6114A


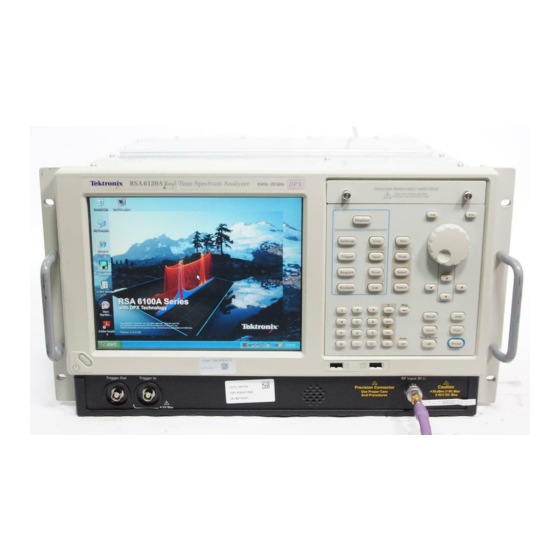
Summary of Contents for Tektronix RSA6114A
- Page 1 RSA6100A Series Real-Time Spectrum Analyzers RSA5100A Series Real-Time Signal Analyzers Quick Start User Manual *P071283800* 071-2838-00...
- Page 3 RSA6100A Series Real-Time Spectrum Analyzers RSA5100A Series Real-Time Signal Analyzers Quick Start User Manual www.tektronix.com 071-2838-00...
- Page 4 Copyright © Tektronix. All rights reserved. Licensed software products are owned by Tektronix or its subsidiaries or suppliers, and are protected by national copyright laws and international treaty provisions. Tektronix products are covered by U.S. and foreign patents, issued and pending. Information in this publication supersedes that in all previously published material.
- Page 5 Warranty Tektronix warrants that this product will be free from defects in materials and workmanship for a period of one (1) year from the date of shipment. If any such product proves defective during this warranty period, Tektronix, at its option, either will repair the defective product without charge for parts and labor, or will provide a replacement in exchange for the defective product.
-
Page 7: Table Of Contents
Table of Contents Table of Contents General Safety Summary ......................Compliance Information .. - Page 8 Table of Contents RSA6100A Series & RSA5100A Series Quick Start User Manual...
-
Page 9: General Safety Summary
General Safety Summary General Safety Summary Review the following safety precautions to avoid injury and prevent damage to this product or any products connected to it. To avoid potential hazards, use this product only as specified. Only qualified personnel should perform service procedures. While using this product, you may need to access other parts of a larger system. - Page 10 General Safety Summary Terms in This Manual These terms may appear in this manual: WARNING. Warning statements identify conditions or practices that could result in injury or loss of life. CAUTION. Caution statements identify conditions or practices that could result in damage to this product or other property. Symbols and Terms on the Product These terms may appear on the product: DANGER indicates an injury hazard immediately accessible as you read the marking.
-
Page 11: Compliance Information
EN 61000-3-2:2006. AC power line harmonic emissions EN 61000-3-3:1995. Voltage changes, fluctuations, and flicker European Contact. Tektronix UK, Ltd. Western Peninsula Western Road Bracknell, RG12 1RF United Kingdom This product is intended for use in nonresidential areas only. Use in residential areas may cause electromagnetic interference. -
Page 12: Safety Compliance
Compliance Information Australia / New Zealand Declaration of Conformity – EMC Complies with the EMC provision of the Radiocommunications Act per the following standard, in accordance with ACMA: CISPR 11:2003. Radiated and Conducted Emissions, Group 1, Class A, in accordance with EN 61326-1:2006 and EN 61326-2-1:2006. -
Page 13: Environmental Considerations - Rsa6100A
This symbol indicates that this product complies with the applicable European Union requirements according to Directives 2002/96/EC and 2006/66/EC on waste electrical and electronic equipment (WEEE) and batteries. For information about recycling options, check the Support/Service section of the Tektronix Web site (www.tektronix.com). -
Page 14: Environmental Considerations - Rsa5100A
This symbol indicates that this product complies with the applicable European Union requirements according to Directives 2002/96/EC and 2006/66/EC on waste electrical and electronic equipment (WEEE) and batteries. For information about recycling options, check the Support/Service section of the Tektronix Web site (www.tektronix.com). -
Page 15: Preface
Seamless capture of signals in up to 110 MHz spans (RSA6100A Series) or 85 MHz spans (RSA5100A Series) Documentation The following documentation is available with your Tektronix RSA6100A Series Spectrum Analyzer or RSA5100A Series Signal Analyzers. For the most current documentation, refer to the Tektronix Web site. -
Page 16: Software Upgrades
To check for upgrades: 1. Use your Web browser to go to www.tektronix.com/software. 2. Enter the product name (for example RSA6120A or RSA5106A) to find available software upgrades. Conventions Used in This Manual... -
Page 17: Installation
Before Installation Unpack the instrument, and check that you received all items listed as Standard Accessories. Optional accessories and instrument options are also listed in this section. Check the Tektronix Web site (www.tektronix.com) for the most current information. RSA6100A Series Standard Accessories Your instrument comes with the following accessories: quick start user manual (languages are listed below), programmer manual (on CD), specifications and performance verification manual (on CD), declassification and security instructions... - Page 18 Installation Power Cords The RSA6100A Series Real-Time Spectrum Analyzers are shipped with one of the following power cord options. Power cords for use in North America are UL listed and CSA certified. Cords for use in areas other than North America are approved by at least one authority acceptable in the country to which the product is shipped.
-
Page 19: Rsa5100A Series Standard Accessories
Japanese, Tektronix part number 071-2840-XX. Russian, Tektronix part number 071-2841-XX. RSA6100A Series, RSA5100A Series Product Documentation CD, Tektronix part number 063-4314-XX. The Product Documentation CD contains PDF versions of the following manuals: RSA6100A Series Real-Time Spectrum Analyzers, RSA5100A Series Real-Time Signal Analyzers Quick Start User Manual, in English, Japanese, Russian and Simplified Chinese. -
Page 20: Optional Accessories
RSA-IQWIMAX, and RSALTE from LitePoint – Third-party solutions that enable WiMax and LTE analysis with the RSA000 Series. 065-0xxx-00 – Additional Removable Hard Drive for use with Opt. 56 (Windows 7 and instrument software pre-installed). Transit Case – Tektronix part number 016-1963-00. RSA6100A Series & RSA5100A Series Quick Start User Manual... -
Page 21: Rsa6100A Series Options
Installation RSA6100A Series Options You can add the following options to your analyzer: Option 01 - Adds 10 MHz to 3 GHz Pre-Amplifier Option 02 - Adds frequency mask triggering and RAM expansion Option 05 - Adds digital IQ output and 500 MHz analog IF output Option 06 - Adds a removable hard disk drive (not compatible with Option 07 or Option 08) Option 07 - Adds a DVD±RW drive, no-cost option (not compatible with Option 06 or Option 08) Option 08 - Adds a removable solid-state hard drive (not compatible with Option 06 or Option 07) -
Page 22: Rsa5100A Series Options
Installation RSA5100A Series Options You can add the following options to your analyzer: Option 11 - Adds Phase Noise and Jitter Measurement. Option 12 - Adds Settling Time Measurement (Frequency and Phase). Option 20 - Adds advanced signal analysis (including pulse measurements). Option 21 - Adds general-purpose digital modulation analysis. -
Page 23: Operating Considerations
Installation Operating Considerations Power supply requirements Source voltage and frequency Power consumption 100 – 240 V , 50/60 Hz 450 W maximum (all models) 115 V , 400 Hz Environmental requirements Characteristic Description RSA6100A Series Operating temperature +5 °C to +50 °C (+5 °C to +40 °C; when accessing the DVD drive or optional removable hard-disk drive) RSA5100A Series Operating temperature +10 °C to +40 °C... -
Page 24: Connecting To The Instrument
Installation CAUTION. To ensure proper cooling, do not operate the instrument on its side. Operate the instrument only when it is resting on its feet, located on the bottom of the case. Maintain at least 2 inches (5 cm.) clearance around ventilation openings. WARNING. -
Page 25: Powering On The Instrument
Installation Powering On the Instrument Powering Off the Instrument Removing the Power RSA6100A Series & RSA5100A Series Quick Start User Manual... -
Page 26: Adding An External Monitor
Installation Adding an External Monitor Use the following procedure to add an external monitor for dual monitor configuration. Both the analyzer and the second monitor must have the color set to True Color. 1. Power off the analyzer and the external monitor. - Page 27 Installation 4. Open the Windows Control Panel. 5. Double-click Intel(R) Extreme Graphics 2 M to open the properties page. RSA6100A Series & RSA5100A Series Quick Start User Manual...
- Page 28 Installation 6. Click Intel(R) Dual Display Clone to show internal screen (Notebook) content on an external monitor (Monitor). 7. Adjust the settings as necessary and then click OK to apply the settings and to close the properties page. RSA6100A Series & RSA5100A Series Quick Start User Manual...
- Page 29 Installation Adjusting the Windows Display Settings To change the instrument display settings, use the Intel Graphics Driver instead of the default Windows display properties. The Intel Graphics Driver provides additional capabilities that are not accessible from the Windows display properties dialog box.
-
Page 30: Inspecting The Instrument
If you want to check the accuracy specifications of your instrument, see the RSA6100A Series Real-Time Spectrum Analyzers Specifications and Performance Verification Technical Reference manual PDF (Tektronix part number 077-0251-XX) or RSA5100A Series Real-Time Signal Analyzers Specifications and Performance Verification Technical Reference manual PDF (Tektronix part number 077-0520-XX) located on the Product Documentation CD. -
Page 31: User Maintenance
Upgrading the Instrument Software Software upgrades are available from Tektronix. They can either be downloaded from the Tektronix Web site or they can be ordered from your local Tektronix representative. To add additional software options or features, you will need an option key from Tektronix. -
Page 32: Operation
Operation Operation Getting Acquainted with Your Instrument Controls and display elements are shown in the following illustrations and tables. Front Panel Controls Most front panel controls are shortcuts for opening control panels. Left: RSA6100A series, right: RSA5100A series Ref number Item Description Menu equivalent... - Page 33 Operation Ref number Item Description Menu equivalent BW (Spectrum) Adjust the resolution bandwidth (RBW). Setup > Settings > BW tab Applicable only when the selected display is Spectrum, DPX Spectrum, or Spectrogram. Press and hold for one second to open the associated control panel. Left: RSA6100A series, right: RSA5100A series Ref number Item...
- Page 34 Operation Ref number Item Description Menu equivalent Keypad Enters values in controls. Enter Completes the data entry in controls. Same as pressing the Enter key on the keyboard. Left: RSA6100A series, right: RSA5100A series Ref number Item Description Menu equivalent Recall Opens the Recall dialog box.
- Page 35 Operation Ref number Item Description Menu equivalent Print Opens the Print dialog box. Printouts are a screen capture File > Print of the analyzer application window. Application Opens the Application preset dialog box. You can change Setup > Preset the effect of pressing Application using the settings at Setup >More presets >...
- Page 36 Operation Front Panel Connectors Ref number Item Description Trig Out Trigger output connector. 50 Ω, BNC, High > 2.0 V, Low < 0.4 V, (output current 1 mA) Trig In External Trigger input connector, –2.5 V to +2.5 V range, trigger level is user adjustable USB port USB 1.1 mouse connector on RSA6100A, USB 2.0 on RSA5100A...
- Page 37 Operation Rear Panel RSA6100A series Ref number Connector, Description AC Input, main power connector GPIB IF output (Option 05) 4, 5 Real Time IQ Out (Option 05) Ref In, reference frequency input Ref Out, reference frequency output Headphone, audio output connector External Trigger 2 Input COM 2, serial port for connecting peripherals VGA, external monitor output (resolution not limited to VGA)
- Page 38 Operation Ref number Connector, Description +28 VDC Output, (switched) LAN, Ethernet network connector RSA5100A series Ref number Connector, Description AC Input, main power connector GPIB LAN, Ethernet network connector USB2 ports for mouse and other USB2 devices PS2 Keyboard input VGA, external monitor output (resolution not limited to VGA) COM 2, serial port for connecting peripherals External Trigger 2 Input...
- Page 39 Operation Interface and Display Elements Commonly-used buttons and controls are located in the tool bar. Most of the buttons open control panels for changing the instrument setups. The contents of the control panels vary depending on the selected display. You can also access the control panels from the front panel buttons or from the keyboard.
- Page 40 Operation Ref number Item Description Displays Opens the Select Displays dialog box so that you can select measurement displays. Markers Opens or closes the Marker toolbar at the bottom of the window. Settings Opens the Settings control panel for the selected display. Each display has its own control panel.
- Page 41 Operation Ref number Item Description Starts and stops data acquisitions. When the instrument is acquiring data, the button label has green lettering. When stopped, the label has black lettering. You can specify the run conditions in the Run menu. For example, if you select Single Sequence in the Run menu, when you click the Run button, the instrument will run a single measurement cycle and stop.
- Page 42 Operation Display-Specific Controls Most displays have commonly-used controls arranged around the graph. They provide quick access to common settings; the full control set for the display is in the Settings control panel. The following illustration and table show some of the common icons that appear in most displays.
-
Page 43: Basic Concepts
Real Time Analyzers Tektronix real-time analyzers, such as the RSA6100A Series Analyzers and RSA5100A Series Real-Time Analyzers, have an optional frequency mask trigger. The frequency mask trigger allows you to set up a spectral mask to capture a signal when a spectral anomaly occurs. - Page 44 Operation This example shows the window with two displays, a Spectrum display and a DPX spectrum display. When you have more than one display open, the display with the check mark icon has control over the acquisition hardware. To give a display priority over any others, click its title bar.
-
Page 45: Navigating Displays
Operation Navigating Displays The RSA6100A Series and RSA5100A Series analyzers use multiple displays to keep operations simple, and yet provide advanced functionality when needed. Some of the display categories include: General Signal Viewing displays. These displays show graphs for basic signal parameters such as amplitude, phase, and frequency plotted against frequency or time. -
Page 46: Selecting Displays
Operation Selecting Displays The analyzer provides an easy way to select displays. 1. Click Displays to open the Select Displays dialog box. There are two ways to select displays: choose any combination of displays or use an Application Preset. Choose any Combination of Displays. Select displays one by one as needed. - Page 47 Operation Use an Application Preset. Select displays from the presets for your application. 1. Click Application Presets in the Select Displays dialog box. 2. Select one of the presets. NOTE. Some presets appear only if the associated instrument option is installed. 3.
- Page 48 Operation Quick Tips Push the Displays button on the front panel to open the Select Displays dialog box. To add a display, double-click the icon. To remove displays, do one of the following: Select a display icon in the Selected Displays list, and then click Remove. Double-click a display icon in the Selected Displays list.
- Page 49 Operation Changing Measurement Settings The displays have settings that control how signals are acquired and processed. The settings that you can change depend on the selected display. To access the settings (in this case, for the Spectrum display): 1. Click Settings to open the Settings control panel.
- Page 50 Operation Presetting the Instrument You can preset the instrument to restore the setups to their default values. 1. To start with the default instrument settings, push the Preset button on the front panel or select Preset from the Setup menu. Quick Tip Preset does not change any of the settings specified from the Config In/Out control panel or from the Tools menu, such as GPIB address, Save/Export preferences, or the Auto Alignment setting.
-
Page 51: Connecting A Signal
Input impedance 50 Ω Input frequency range 9 kHz to 6.2 GHz RSA6106A 9 kHz to 14 GHz RSA6114A 9 kHz to 20 GHz RSA6120A 9 kHz to 3 GHz (RF Band) RSA5103A 9 kHz to 6.2 GHz (RF Band) -
Page 52: Starting And Stopping Acquisitions
Operation To connect an RF signal: 1. Connect the signal to the RF INPUT connector on the front panel. Quick Tip If the source signal is greater than 1 Watt (+30 dBm), connect the source signal to an attenuator. Connect the attenuator output to the RF Input connector. -
Page 53: Markers
Operation Markers Use markers to measure time, frequency, power and other results. Markers measure absolute values and can also measure the difference between markers. Using Markers to Measure Frequency and Power The following procedure shows how to use markers in the Spectrum display to measure frequency and power. The example assumes that all markers are turned off and that a signal is on the screen. - Page 54 Operation Markers Display Rectangular markers show absolute values in the readout. The readout of the selected marker appears in the upper left corner of the display and in the Marker toolbar. Diamond markers show delta values (relative to the reference marker). The delta readout of the selected marker appears in the upper right corner of the display and in the Marker toolbar.
- Page 55 Operation Marker Toolbar The Marker toolbar has several controls to work with markers. (See Table 4.) Some of these controls are similar to those on the front panel. Table 4: Marker toolbar Icon Description Opens the Define Markers control panel. Use the control panel to add and remove markers and to set marker parameters.
-
Page 56: Touchscreen Actions
Operation Defining Markers Use the Define Markers control panel to define the marker settings. 1. Click Define to open the Define Markers control panel. Use the control panel to: Add or delete markers. Turn markers off. Assign markers to specific traces. Set the marker readouts to absolute or delta. - Page 57 Operation Table 5: Touchscreen actions menu Icon Menu item Description Select Selects markers and adjusts their position. Span Zoom Zooms the graph area about the selected point. Touch the graph display at a point of interest and drag to increase or decrease the span about the point of interest. Span Zoom adjusts the span control and can affect the acquisition bandwidth.
-
Page 58: Printing
Operation Printing You can print a copy of the screen and its contents (a screen shot) to a printer or a file. 1. Push the Print button on the front panel or select Print from the File menu. RSA6100A Series & RSA5100A Series Quick Start User Manual... - Page 59 Operation 2. Fill out the details in the Print dialog box, and then click OK. The Print dialog box is the standard Microsoft Windows Print dialog box. The printer controls are dependent on your printer. Ink Saver Mode You can print screen images with a white background. 1.
-
Page 60: Saving Data
Operation Saving Data You can save different types of data for future use. 1. Select Save As. from the File menu to open the Save As dialog box. 2. Navigate to the folder where you want to save the setups, or use the default location. -
Page 61: Recalling Data
Operation Quick Tips Select File > Save or press the Save button to save the information to a file using the same name, path, and data type as the last time that you saved. If the file already exists, the file name suffix number will increment if you previously selected that option in the Tools >... - Page 62 Operation 2. In the Open dialog box, browse to the location of the file. 3. If you do not see the file, select the type of file under Files of Type. 4. Double click the file name to load the file. Quick Tip If you recall a trace that has an x-axis range that does not fall within the x-axis range of the current graph, the trace will not be visible.
-
Page 63: Advanced Techniques
Operation Advanced Techniques This section contains advanced operating techniques. For examples of practical applications, see the RSA6100A Series Real-Time Spectrum Analyzers and RSA5100A Series Real-Time Signal Analyzers Application Examples Manual. Setting Up Triggering The RSA6100A Series Real-Time Analyzers and RSA5100A Series Real-Time Analyzers offer real-time frequency domain triggering (options 02 and 52) and frequency edge triggering in addition to power-level triggers, line trigger, runt trigger, and external triggers. - Page 64 Operation except you also need to set a power threshold to avoid triggering on the apparent frequency fluctuations that occur at low amplitude. You can select the time-domain bandwidth and trigger on the rising or falling edge. Frequency Mask Triggering. Frequency Mask Triggering allows you to trigger the instrument when a signal in the frequency domain violates the mask.
- Page 65 Operation Accessing Trigger Parameters 1. Click Trig to open the Trigger control panel. 2. As shown in the following steps, click one of the tabs in the Trigger control panel to define the trigger parameters. 3. Use the Event tab to set parameters that define trigger events.
- Page 66 Operation The quickest way to set up a DPX Density trigger is to use a mouse and right-click on a signal of interest in the DPX graph, or press on the screen and hold with your finger for one second. A menu will pop up. Select Trigger On This. This action performs several tasks: Places the density measurement box at the click point Sets the measurement box to its default size...
- Page 67 Operation Creating a Frequency Mask Use the Mask Editor to create a Frequency Mask. The mask is a set of points defined by frequency and amplitude. Access the Mask Editor from the Trigger control panel. (This procedure uses the Spectrum display.) You can create a Frequency Mask by using either the manual or Auto Draw method.
- Page 68 Operation 7. Click any point in the mask to select it. The frequency and amplitude of the selected point are highlighted in the graph. 8. Edit the point by doing one of the following: Drag and drop the point with the mouse.
- Page 69 Operation Table 7: Trigger violations Violation Description The instrument triggers whenever the signal violates the mask (above the line). The instrument triggers whenever the signal has no points in the mask. T > F One transition defines the trigger event. The signal must go out of the mask (no violation) after being inside of the mask (violation).
- Page 70 Operation Measurements with Conflicting Acquisition Requirements The RSA6100A Series Real-Time Spectrum Analyzers and RSA5100A Series Real-Time Signal Analyzers let you open any combination of measurements. You can select the displays that you are interested in and the instrument will automatically set up the appropriate analysis and acquisition parameters.
- Page 71 Operation 8. Increase the span in the Spectrum display to 200 MHz. Because Spectrum is the selected display, the acquisition parameters adjust automatically to meet the needs of the display. The 200 MHz span exceeds the real-time bandwidth of the instrument.
- Page 72 Operation 11. Decrease the span to 25 MHz in the Spectrum display. Now the acquisitions are real time again. 12. Check the status bar readout to verify that the acquisition is real-time. Both of the displays can run now. RSA6100A Series & RSA5100A Series Quick Start User Manual...
- Page 73 Operation Searching Signals The RSA6100A Series Real-Time Spectrum Analyzers and RSA5100A Series Real-Time Signal Analyzers let you search the Spectrum display’s trace results for changes in power level. You can identify matches crossing a power level or you can create a mask that specifies power level and frequency range limits. You can select which trace to search and specify an action to take when a search match occurs.
- Page 74 Operation 6. Specify what to search for by making a selection from the Search for drop-down list. To search for signal levels above or below a specified level, select either is greater than or is less than. To search for signal levels that vary with frequency, select either is outside mask or is inside mask.
- Page 75 Operation 7. Click the Actions tab to specify what actions the analyzer should take when a match occurs. The analyzer can take up to five actions when a match occurs, depending on the run mode. In Run mode, the analyzer can sound a beep, stop acquisitions, save acquisition data, save trace data, and save a picture of the display.
- Page 76 Operation Using Correction Tables The RSA6100A Series Real-Time Spectrum Analyzers and RSA5100A Series Real-Time Signal Analyzers let you correct the signal displays and measurement results to account for gains and losses in external equipment. You can specify a single gain value or you can use an external loss table to adjust the gain/loss value based on frequency. To specify external gain/loss corrections: 1.
- Page 77 Operation 6. Edit the contents of the table to match the loss characteristics of the equipment you are correcting for. Click OK when you are finished. NOTE. You can enter either positive or negative values into the table. But in contrast to the External Gain value setting, positive values represent a loss and negative values represent a gain.
- Page 78 Operation When choosing whether to correct sample data or traces, keep the following in mind: If sample data is acquired while data correction is enabled, that data record is permanently corrected. If the acquisition is saved and recalled, the recalled acquisition includes corrections. Corrections are not saved separately from the raw data;...
- Page 79 Operation Using Audio Demodulation The RSA6100A Series Real-Time Spectrum Analyzers and RSA5100A Series Real-Time Signal Analyzers can demodulate audio signals, which can help you to identify unknown radio signals. You access the Audio Demod tab from the Settings control panel of the DPX Spectrum plot display. To demodulate an audio signal: 1.
- Page 80 Operation 8. Click the On button to enable audio demodulation. 9. To specify the demodulation type, click either the AM or FM button. NOTE. Note that the AM and FM buttons select only the demodulation type; they do not specify a frequency band. 10.
- Page 81 Operation 13. Click the Define button in the Marker toolbar to display the Define Markers control panel. 14. Click Add to add markers as needed. 15. Click the Settings button to return to the Audio Demod control panel. 16. Set the required receiver bandwidth by entering a value into the Receiver BW value entry box.
- Page 82 Operation 17. Set the receiver frequency. If you specified a marker with the Tune with setting, drag the marker to the required frequency. Fine tune the marker position with the front-panel knob or your mouse wheel. If you selected Frequency control in the Tune with setting, press the front-panel FREQ button, then turn the front-panel knob or use the Freq setting in the toolbar to set...
-
Page 83: Index
RF measurement, 29 controlling, 53 selecting, 30 data source, 28 Documentation, ix starting, 36 Key features, ix Tektronix part numbers, 1, 3 stopping, 36 Analysis window, 27, 29 Application presets, 31 audio demodulation, 63 Maintenance Environmental specifications, 7 cleaning procedures, 15... - Page 84 Index Select Trace legend, 33 Touchscreen actions menu, 40 Trigger Selected window, 53 control panel, 49 Touchscreen actions menu, 40 Selecting displays, 30 mask, 51 Part numbers, manuals, 1, 3 Settings violations, 53 Power cord options, 2, 3 changing, 33 Trigger Event parameters, 48 Power level triggering, 48 default, 34...
Need help?
Do you have a question about the RSA6114A and is the answer not in the manual?
Questions and answers