Table of Contents
Advertisement
Quick Links
Advertisement
Table of Contents

Related Manuals for Tektronix WVR52003G


Summary of Contents for Tektronix WVR52003G
- Page 1 WVR5200 Waveform Rasterizer User Manual *P077053203* 077-0532-03...
- Page 3 WVR5200 Waveform Rasterizer User Manual www.tektronix.com 077-0532-03...
- Page 4 Copyright © Tektronix. All rights reserved. Licensed software products are owned by Tektronix or its subsidiaries or suppliers, and are protected by national copyright laws and international treaty provisions. Tektronix products are covered by U.S. and foreign patents, issued and pending. Information in this publication supersedes that in all previously published material.
- Page 5 Tektronix, with shipping charges prepaid. Tektronix shall pay for the return of the product to Customer if the shipment is to a location within the country in which the Tektronix service center is located. Customer shall be responsible for paying all shipping charges, duties, taxes, and any other charges for products returned to any other locations.
-
Page 7: Table Of Contents
Table of Contents General safety summary ..................Preface ......................Where to Find More Information ................Conventions Used in This Manual ................Getting Started ...................... Key Features ....................Options......................Connecting Power ..................... Network Installation ................... Incoming Inspection ................... Getting Acquainted with Your Instrument ..............Front-Panel Controls .................. - Page 8 Table of Contents Functions ......................Gain, Sweep, and Magnification ................Cursors ......................Capture......................Line Select..................... Headphone Volume and Source Adjustment............... Presets......................Software Upgrades ................... Checking Chroma/Luma Delay (Lightning Display) ............Checking Gamut ....................To Set Up Gamut Checks ..................Checking RGB Gamut ..................Checking Composite Gamut................
- Page 9 List of Figures Figure 1: Connecting the instrument to a PC..............Figure 2: Instrument online help................. Figure 3: Display quadrants and related tile numbers ............Figure 4: Changing from 4-tile to full-tile view ............... Figure 5: Status bar....................Figure 6: Two SDI signal connection ................Figure 7: Dual Link information placement in waveform display ...........
-
Page 10: Figure 36: Auxiliary Data Status Display
Table of Contents Figure 37: Dolby Status display ................. Figure 38: Audio display ..................Figure 39: 16-Channel audio bars display ..............Figure 40: Picture display showing color bars ..............Figure 41: VChip, CC-Display, Teletext, and Safe Area Graticule in Picture display..... Figure 42: Using cursors in a waveform display............... - Page 11 Table of Contents List of Tables Table i: Product documentation.................. Table 1: Service options ................... WVR5200 Waveform Rasterizer User Manual...
-
Page 12: General Safety Summary
General safety summary General safety summary Review the following safety precautions to avoid injury and prevent damage to this product or any products connected to it. To avoid potential hazards, use this product only as specified. Only qualified personnel should perform service procedures. To avoid fire or personal Use proper power cord. - Page 13 General safety summary Terms in this manual These terms may appear in this manual: WARNING. Warning statements identify conditions or practices that could result in injury or loss of life. CAUTION. Caution statements identify conditions or practices that could result in damage to this product or other property.
- Page 14 General safety summary viii WVR5200 Waveform Rasterizer User Manual...
-
Page 15: Preface
Preface Preface This manual contains information to help you use the Tektronix WVR5200 Waveform Rasterizer. This information includes the following: How to set up various waveform displays for monitoring SD-SDI, HD-SDI, and 3 Gb/s SDI video signals. How to set up audio displays to monitor embedded AES/EBU audio signals. -
Page 16: Conventions Used In This Manual
077-0551-XX Service Manual instrument Detailed information about how to service the instrument at the module level. Available on the Web at www.tektronix.com/downloads. Conventions Used in This Manual The following icon is used throughout this manual: Sequence step or item WVR5200 Waveform Rasterizer User Manual... -
Page 17: Getting Started
Your instrument shipped with a CD containing various user documents and a printed manual with power-on, installation, and accessories information. That manual is also available online at www.tektronix.com/downloads. This User manual contains information about operating your instrument. This chapter will help you set up and begin to use the instrument. It is divided... - Page 18 Getting Started Item Description Multi-Input Display The Multi-Input Display mode allows you to simultaneously view up to four SDI inputs of the same format. The feature is available in Waveform, Vector, Lightning, Diamond, Split Diamond, Arrowhead, and Spearhead displays. If you are monitoring a 2xHD Level B 3 Gb/s signal, you can select to view the streams of that signal individually.
-
Page 19: Options
ARIB standards and CEA608, CEA708, AFD, and CGMS-A. DATA) Timing display A Tektronix proprietary display that simplifies measuring the timing difference between two signals. Using the Timing display enables you to easily compare and correct the timing between two signals. - Page 20 Getting Started Option AUD: 16-channel embedded AES/EBU audio simultaneous monitoring support with Multichannel Surround Sound display and flexible Lissajous display. Option LOUD (requires Option AUD): Audio Loudness monitoring to ITU-R BS.1770-3/1771, EBU R 128, and ATSC A/85 recommendations. Option CAM: 4-SDI channel simultaneous monitoring (SIM) allows for quick and easy setup of multiple cameras during content acquisition for OB van and production studio applications.
-
Page 21: Connecting Power
Getting Started Connecting Power AC Adapter The instrument operates from an external AC adapter with a line frequency of 50 or 60 Hz, over the range of 100-240 Volts, without the need for configuration, except the power cord. The typical power draw is 22 Watts. Refer to the WVR5200 Specifications and Performance Verification Technical Reference on the Product Documentation CD for additional information on power and environmental requirements. -
Page 22: Figure 1: Connecting The Instrument To A Pc
Getting Started Figure 1: Connecting the instrument to a PC Connecting to a Network The following topics cover configuring the IP settings so that you can use your instrument over a network, and configuring SNMP, which is required if you are using commands to control the instrument. - Page 23 SNMP OIDs and can be downloaded from the instrument Web page. You can also download a printable version of a MIB manual from www.tektronix.com/downloads. The procedure to set SNMP settings is similar to the procedure for IP settings. (See page 6, Connection and IP settings.) This table shows the parameters that you can set.
-
Page 24: Incoming Inspection
Getting Started Incoming Inspection The incoming inspection procedures are optional procedures to check the functionality of your instrument. These procedures require no equipment other than an external monitor or display. For a more robust inspection, see the performance verification procedures in the WVR5200 Specifications and Performance Verification Technical Reference that is included on the Product Documentation CD that shipped with your instrument. - Page 25 Getting Started 6. Press the MAIN button, highlight Tile Display, and then press the SEL button to change the view to full tile. 7. Press each of the front panel buttons, one at a time, except for the power button and the HELP button. Each button should flash as you press it.
- Page 26 Getting Started WVR5200 Waveform Rasterizer User Manual...
-
Page 27: Getting Acquainted With Your Instrument
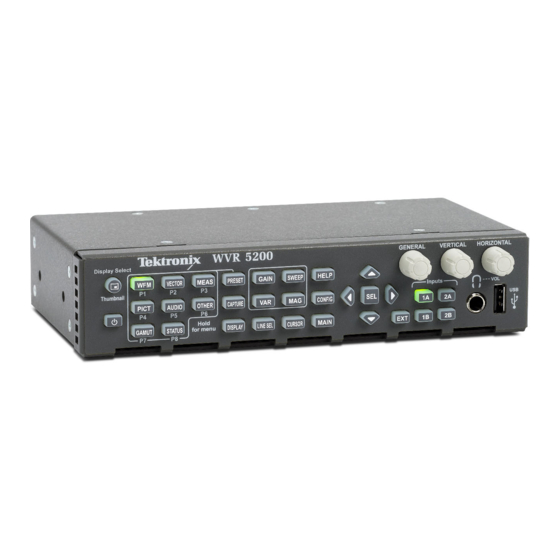
Getting Acquainted with Your Instrument Front-Panel Controls NOTE. Some of the controls that are covered in this section are option-dependent. For a list of the options that are installed on your instrument, press the CONFIG button. In the configuration menu, select the Utilities submenu. The View Instrument Options entry lists the options installed on your instrument. - Page 28 Getting Acquainted with Your Instrument Layout and Usage The primary front panel elements shown below are described in the table that follows. The Usage procedure column in the table refers you to a procedure in this manual that explains how to use the element. If there is no page reference, the information given explains the basic function of the element.
-
Page 29: Instrument Online Help
Getting Acquainted with Your Instrument Control element or group Usage procedures Power button Press to turn the instrument on or off. Note that this button does not remove power from the mains. Display button Access to waveform and graticule intensity, Infinite Persistence mode, and save display to USB function. -
Page 30: Figure 2: Instrument Online Help
Getting Acquainted with Your Instrument Figure 2: Instrument online help To Navigate Online Help 1. Press the HELP button. 2. Press the right arrow key to navigate to the one of the three panes: Help Contents, Help Index, or the right-side pane that contains the topic content related to the front panel button you press while help is activated or the links in the help files and menus you use. -
Page 31: Instrument Display
Getting Acquainted with Your Instrument Instrument Display This instrument uses Quad Tile, which is a flexible, four-tiled display that can show four tiles at one time or a single, full-screen sized tile. The instrument also provides the flexibility to configure each of the four display tiles independently, enabling you to quickly check the integrity of a signal. -
Page 32: Figure 4: Changing From 4-Tile To Full-Tile View
Getting Acquainted with Your Instrument You can change from 4-tile to full-screen mode two ways: press and hold the Display Select button until the view changes; or press the MAIN button, select Tile Display from the pop-up menu, and then press the SEL button to select FULL. - Page 33 Getting Acquainted with Your Instrument Status display element Description Input Format Text indicating the format of the signal on the selected input or whether signal is missing or unlocked. EDH Error A one-line area that is visible if EDH errors are present. RGB Gamut Error A one-line area that is visible if RGB gamut errors are present.
- Page 34 See the WVR5200 Waveform Rasterizer Safety and Installation Instructions that shipped with your instrument for rear-panel specifications. It is also available in electronic format on the Product Documentation CD and on the Tektronix Web site at www.tektronix.com/downloads. WVR5200 Waveform Rasterizer User Manual...
-
Page 35: Signal Inputs And Outputs
Signal Inputs and Outputs Signal Inputs and Outputs After you have connected a signal source or a cable for a signal output to the rear panel of your instrument, there are several menus to use to set up your signal: NOTE. -
Page 36: Sdi Signals
Signal Inputs and Outputs SDI Signals Connect one or more 3G-SDI, HD-SDI, or SD-SDI signals to the SDI inputs on the rear panel of the instrument. After that is finished, use the front panel buttons to set the parameters for monitoring the signals, such as thresholds, alarms monitored, and audio source. -
Page 37: Reference Loop
Signal Inputs and Outputs Figure 7: Dual Link information placement in waveform display Reference Loop Reference signals can be Black Burst or Tri-level sync. After you connect the appropriate reference signal, press the EXT REF button the on the front panel of the instrument. -
Page 38: Signal Generation
Signal Inputs and Outputs Signal Generation If this instrument has Option GEN installed, it can generate SD-SDI and HD-SDI signals. With Option 3G and Option GEN installed, it can also generate a 3 Gb/s test signal. (See Figure 9.) Three types of signals can be generated in SD (525,625), HD (720, 1080), and 3G Level A and Level B formats: 75% bars 100% bars... -
Page 39: Display Information
Display Information Display Information This instrument can support the following displays: NOTE. Some displays require a specific option to be installed. For example, the Audio display is not accessible unless you have Option AUD. (See page 3, Options.) Waveform: YPbPr, YRGB, RGB, SDI → Composite or XYZ Vector: Normal, SDI →... -
Page 40: Figure 10: Navigate Menus Using The Arrow Keys And Select Button
Display Information Pop-Up Menus All pop-up menus are displayed by pressing and holding the specified display button for three seconds. To hide a pop-up menu, press the specified button again. Pop-up menus appear in the active tile and, in general, control only settings specific that tile. -
Page 41: Multi-Input Display Mode
Display Information Multi-Input Display Mode The Multi-Input Display mode is available when Option CAM is installed. This mode supports the simultaneous display of up to four SDI inputs of the same format. You can choose to view a specific stream of a multi-stream signal (such as a 2xHD Level B 3 Gb/s signal) or both streams together. - Page 42 Display Information Selecting an input to be displayed does not change the inputs being monitored. For example, if you have two SDI signals connected, one to Input 1A and the other to Input 1B, pressing the 1B button so that it is not lit will eliminate the channel from a trace display, but not stop the channel from being monitored for status or alarms.
- Page 43 Display Information To Select Streams to View You can select to view one or both streams simultaneously of a 2xHD Level B 3 Gb/s SDI signal from an input button pop-up menu. When you press and hold an input button, the pop-up menu that appears allows you to select to view stream 1, stream 2, or both streams of that signal.
-
Page 44: Simultaneous Input Monitoring
Display Information Figure 11: Waveform display in Multi-Input mode showing multiple channels To Customize Input Labels You can name the input labels from the CONFIG > Graticules and Readouts > Input Labels menu. Once you are in the Input Labels menu, select an input and then press the SEL button. -
Page 45: 3D Input Monitoring
Display Information 3D Input Monitoring Your instrument can monitor stereoscopic 3D content in production and post production applications with Option S3D installed. A 3D image is comprised of a Left Eye and Right Eye view as two separate HD-SDI signals or combined within a 3G Level B format. -
Page 46: Figure 12: Simultaneous 3D Display Of Left Eye And Right Eye Signals
Display Information SyncVu™ and SIM SIM is ideal for by simultaneously monitoring the Left Eye signal and the Right Eye signal. You can use SyncVu™ in conjunction with SIM when input A is Monitoring of 3D used for the Left Eye and input B is used for the Right Eye. When SyncVu™ is enabled, the Left and Right tile displays are synchronized, so that if a Picture display is selected for Tile 1, Tile 2 will automatically show a Picture display in exactly the same mode as Tile 1. -
Page 47: Figure 13: 3D Left And Right Eye Images Showing A Difference Map And Red/Cyan Anaglyph Using
Display Information Difference Map and When 3D input is enabled from the Main button, you can use the Difference Map display in the selected measurement button menu to see the difference between Red/Cyan Anaglyph left and right images. The difference map is a subtraction of the two luma video signals L-R or R-L to produce a grayscale difference map image. -
Page 48: Figure 14: 3D Left And Right Eye Images Showing Green/Magenta Anaglyph And Checkerboard Display
Display Information Green/Magenta Anaglyph The Checkerboard display shows a block of the image from the left eye and then the next block shows the image from the right eye in a 16×9 checkerboard and Checkerboard pattern. This helps you compare the levels and color of the signal between the left and right images. -
Page 49: Syncvu
Display Information Disparity Grid and Cursors A Disparity Grid can be used to measure the depth of an object within an image. The grid can be overlaid over the picture with a horizontal disparity between 1 to 15% of screen width and a vertical disparity of 50%, 25%, or 10% (user selectable). -
Page 50: Waveform Display
Display Information 1. Press the MAIN button. 2. Select SyncVu. 3. Select Enable. How to Change Settings This instrument can display four tiles. When you are viewing two inputs simultaneously in SIM mode, the tiles on the left side of the display show the first Using SyncVu™... - Page 51 Display Information 3. This readout lists the currently selected field and line (when in Line Select mode). 4. This readout lists the current sweep rate for tile. 5. This readout lists the Mag rate if MAG is on. Waveform Pop-Up Menu The Waveform pop-up menu enables you to choose the display style and display mode used in the active tile (SDI inputs only), to select a filter to apply to the and Settings...
-
Page 52: Vector Display
Display Information To turn on the Multi-Input display mode, select Multi-Input Display and press SEL. Next, press and hold the Display Select button to view the display full-tile and activate the Multi-Input view. NOTE. The Multi-Input menu option is only available in the WFM pop-up menu when the feature is enabled from the MAIN button menu. -
Page 53: Figure 17: Lightning Display
Display Information Figure 17: Lightning display Elements of the Vector The following elements appear on the display. Some elements may only appear on one display type: Display V Gain. Press and hold the GAIN button to select V Gain settings. Then select the gain to 1X, 2X, 5X, 10X, or Variable. - Page 54 Display Information To choose the display type (SDI inputs only), use the pop-up menu to choose: Vector – The Vector display shows a plot of the R-Y signal on the vertical axis and the B-Y signal on the horizontal axis. This display is useful for looking at hue and amplitude of the colors, but does not show luminance information.
-
Page 55: Tandemvu® (Overlay) Display
Display Information TandemVu® (Overlay) Display TandemVu® is a patented display that allows you to overlay the Waveform and Vector or Waveform and Lightning displays, plus Picture Thumbnail, in a single, full-tile display. You can then view Waveform and Vector displays, or Waveform and Lightning displays, at the same time. -
Page 56: Gamut Display
Gamut Display Pressing the GAMUT button calls one of the Gamut displays. The Gamut display provides four proprietary Tektronix display types to enable you to check the gamut of an SDI signal. Set the thresholds for gamut displays from the CONFIG menu. - Page 57 Display Information Spearhead: shows lightness, color value, and saturation of the RGB color space (requires Option PROD) Diamond: provides a reliable method of detecting invalid colors WVR5200 Waveform Rasterizer User Manual...
- Page 58 Display Information Split Diamond: provides a reliable method of detecting invalid colors Quad Diamond (Option S3D): provides disparity histogram of the left and right channels of a 3D signal. The black of the signal is at the bottom of the diamond, with white at the top of the diamond.
- Page 59 Display Information Elements of the Gamut High threshold: Shows the currently specified high threshold (Diamond High or Arrowhead Max). Display Low threshold: Shows the currently specified low threshold (Diamond Low). Gamut display type: Shows the selected Gamut display type - Diamond, Split Diamond, Quad Diamond, Spearhead, or Arrowhead.
-
Page 60: Timing Display
Display Information Timing Display Pressing the MEAS button displays a Tektronix proprietary display that simplifies measuring the timing difference between two signals as the timing is corrected. Using the Timing display enables you to easily compare and correct the timing between two signals. - Page 61 Display Information Measure Pop-Up Menu The Measure pop-up menu enables you to save a timing setting for comparison with another signal and specify the zero point of the timing display. To save the timing of the current input as an offset to the timing display, use the Save Offset menu entry.
-
Page 62: Figure 20: Timing Display Of Integer Multiples Of Reference Rates
Display Information Timing Displays for Simple The number of circles, with each representing a time offset, varies with the complexity of the timing between the reference and input signals. Versus Complex Timing Integer multiples of reference rates. If you are timing input signals with rates that are integer multiples of the reference rates, the instrument can measure the timing deterministically and displays the relationship as one circle (offset) relative to the cross-hair. -
Page 63: Figure 21: Timing Display Of Non-Integer Multiples Of Reference Rates
Display Information Non-integer multiples of reference rates. If you time input rates that are not integer multiples of the reference rates, the instrument cannot measure the timing deterministically, so it displays the relationships as several circles. Each circle represents a possible timing offset measurement relative to the reference cross-hair. -
Page 64: Datalist Display
Display Information Datalist Display The Datalist Display is accessed from the MEAS button when Option DATA is installed. This display allows you to see SD, HD, or 3 Gb/s data without any interpolation. The Datalist tool examines the contents of all digital formats, structures, and transports (SD, HD, dual-link, 3 Gb/s, 4:2:2, 4:4:4, and others). - Page 65 Display Information Datalist Color Coding Different fields of the data stream are shown in different colors: Green: Active video data. Blue: Data in horizontal or vertical blanking intervals. White: EAV and SAV packets; other reserved values such as the XYZ word. Yellow: Data outside the nominal allowed values.
-
Page 66: Bowtie Display
Display Information Bowtie Display The Bowtie Display is accessed from the MEAS button. This display allows you to look at inter-channel timing between Y Pb and Y Pr. The left side of the display compares Y and Pb; the right side compares Y and Pr. The Bowtie Display requires a test signal with signals of slightly differing frequencies on the chroma channels than on the luma channel. -
Page 67: Ltc Display
The REMOTE connector is a 15-pin D-type connector with socket contacts. For pin information, see the Safety and Installation manual or the System Integration manual on the Product Documentation CD that shipped with your instrument and the Web at www.tektronix.com/downloads. Figure 24: LTC display Elements of the LTC Display: Shows the display type as LTC. -
Page 68: External Reference Waveform Display
Display Information External Reference Waveform Display The External Waveform Display is accessed from the OTHER button. This display allows you to check the external reference signal integrity, including its shape and amplitude. This display is independent of the input video signal. (See Figure 25.) The input of external reference waveform is through the EXT REF connector on the rear panel of the instrument. -
Page 69: Diagnostics Monitor Display
Display Information Diagnostics Monitor Display The Diagnostics Monitor Display is accessed from the OTHER button. This multiple page display allows you to view system diagnostics information such as temperature, fan speed, and power supply readings. This display is independent of the input video signal. -
Page 70: Ancilliary (Anc) Data Display
Display Information Ancilliary (ANC) Data Display The ANC Data Display is available with Option DATA. It allows you to more closely examine all of the ANC data in a signal. The ANC Data Inspector is part of the ANC Data Display. This ancillary monitoring feature allows you to see all ancillary data present in a signal. - Page 71 Display Information DBN: Data Block Number of the acquired packet; values range from 0 to 0xFF; the "actual value" (with parity bits added) is displayed in parenthesis (mutually exclusive with SDID field). DC: Data Count word of the acquired packet; the number of User Data words is displayed in decimal;...
-
Page 72: Status Displays
Display Information Status Displays Pressing the STATUS button calls up the Status display, which provides several views of signal status. Status displays are text displays that show signal status. You can view current alarms and errors (those occurring now and within the last few seconds), a history of errors and alarms (up to 10,000 entries), video error statistics or audio error statistics. - Page 73 Display Information The Error Log is also divided into the following four columns: Source: Shows the inputs on which the errors have occurred. Error Status: Shows the current state of the entry: White items are informational and identify a change in instrument state; Green items are errors that have cleared;...
-
Page 74: Figure 29: Alarm Status Display
Display Information Alarm Status View current alarm status. (See Figure 29.) Figure 29: Alarm Status display Elements of the Alarm Status display. Alarm: Shows alarms that occurred. Status: Shows whether an error occurred but has cleared (green), whether an error has appeared in the last five seconds but has cleared (yellow), or whether an error is ongoing (red). -
Page 75: Figure 30: Video Session Display Of Hd Signal
Display Information Video Session The Video Session display contains several performance parameters that you can view to get an overview of the video input signal. This instrument maintains a running video status session. (See Figure 30.) Figure 30: Video Session display of HD signal SDI elements of the Video Session display. - Page 76 Display Information instrument uses the SMPTE RP165 standard for error checking. For HD and 3 Gb/s signals, the CRCs change on every video line. F2 AP CRC: For SD signals only, calculates and displays the active picture CRC (Cyclical Redundancy Check) for field two in hexadecimal. The instrument uses the SMPTE RP165 standard for error checking.
- Page 77 Display Information Black Events: Shows when a black frame has occurred within the video image. Settings configured in the CONFIG > Measurement Settings menu. Frozen Events: Shows when a frozen frame has occurred within the video image. Settings configured in the CONFIG > Measurement Settings menu. Changed Since Reset: Indicates if either the F1 or F2 AP CRC values have changed since the last reset.
-
Page 78: Figure 31: Audio Session Display
Display Information Audio Session With Option AUD, you can access the Audio Session display, which contains several performance parameters that you can display to see an overview of the audio input signal. This instrument maintains a running audio status session. (See Figure 31.) Figure 31: Audio Session display Elements of the Audio Session display. - Page 79 Display Information Peak (dBFS): The True Peak signal level measured on the channel. High (dBFS): The highest signal level measured by the signal level meter. The level meter response is based on the Ballistics setting. If ballistics is set to True Peak, this readout is the same as the Peak readout. Active Bits: The number of active bits in the channel.
- Page 80 Display Information Audio Session pop-up menu. NOTE. To reset, stop, or start an individual audio or video session, select the tile in which it is displayed and use the SEL button, right arrow key, and left arrow key, respectively. Remember that the STATUS pop-up menu must be closed; otherwise, the button and key presses will navigate through that menu.
-
Page 81: Figure 32: Audio Loudness Session Display
Display Information Audio Loudness Session The Audio Loudness Session display is available when Option LOUD and Option AUD are installed. This display allows you to view an audio loudness chart and the values associated with audio loudness measurements. This instrument maintains a running audio loudness session. - Page 82 Display Information Short Loud: The displayed value is the short duration loudness measurement based on the short duration period. Infinite: The displayed value is the loudness measurement average based on the duration of the audio session. True Peak: The displayed value is the maximum true peak value recorded by the audio meters.
-
Page 83: Figure 33: Audio Control Packet Format
Display Information Audio Control The Audio Control Packet Display allows you to view information on audio frame number, sampling frequency, active channels, and relative audio-to-video delay of each channel, as encoded in the audio control packet metadata. (See Figure 33.) Figure 33: Audio Control Packet format For SD signals, transmission of audio control packets is optional for 48 kHz synchronous operation and required for all other modes of operation (since... -
Page 84: Figure 34: Audio Control Packet Structure
Display Information Figure 34: Audio Control Packet structure Figure 35: Audio Control display Elements of the Audio Control display. Group 1 through n: Shows the audio group number of the audio control packet to be used for decoding. DID: Shows the Data Identifier of the ancillary data packet for the audio control packet. - Page 85 Display Information Data Block: Always 200h for HD. If SD is present, this increments by 1 when consecutive data for each DID is present, or when data blocks within a common data ID are to be linked. Data Count: 10Bh for HD. For SD, the data count represents the number of user data words to follow, up to a maximum of 255 words.
- Page 86 Display Information Aux Data Status The Aux Data Status Display allows you to view closed-caption, teletext, video index, AFD, WSS, V-chip related status, and other ancillary data present on monitored signals. (See Figure 59.) Figure 36: Auxiliary Data Status display Elements of the Aux Data Status display.
- Page 87 Display Information V-Chip Rating: Detects ratings from: MPAA (US), TV (US), Canadian English, and Canadian French systems. Transmission Signal Identifier (TSID): Indicates if the TSID is present in the SDI stream. If missing, "Not Detected" will display; otherwise, the TSID is displayed as a hexadecimal number.
- Page 88 Display Information Dolby Status When your instrument is equipped with Option AUD, you can view Dolby metadata from the currently monitored SDI input. You can view Dolby VANC data (SMPTE 2020) from the Dolby Status Display. (See Figure 37.) Figure 37: Dolby Status display Elements of the Dolby Status display.
- Page 89 Display Information Program Configuration: Determines how the audio channels are grouped within a Dolby E bitstream. Up to eight channels can be grouped together in individual programs, where each program contains its own metadata. Dolby Source: Indicates the instrument input from which the Dolby Content is sourced.
-
Page 90: Audio Display
Display Information Audio Display Pressing the AUDIO button brings up the Audio Display if the instrument has Option AUD installed. This display provides level meters and a phase display for monitoring audio signals. The Audio display always shows the level meters and correlation meters. - Page 91 Display Information in positions matching their place in a surround-sound listening environment, and the Loudness display, where loudness targets are shown. (See page 121, To Check Audio Phase.) (See page 124, Elements of the Surround Sound Display.) (See page 65, Audio Loudness Session.) Audio source/setup: Displays the selected audio input and related setup information, such as Listening Mode when in Surround display.
- Page 92 Display Information Above-Bar Warning This instrument displays warning messages above the level meter bars. The warning messages that can appear above the bars as follows: Messages Clip. The number of consecutive samples equals or exceeds the # Samples for Clip setting. Over.
- Page 93 Display Information Audio Display Pop-Up The Audio pop-up menu enables you to select the audio input source and specify whether a phase display or a surround-sound displays appears in a subtile to the Menu right of the level meter display. To select the source for the Audio display, select Audio Input in the menu and set a source.
- Page 94 Display Information To add a multi-channel surround sound display to the audio tile, set Aux Display to Surround Sound in the Audio pop-up menu. You can also enable either or both of the following entries: Dominance Indicator. When on, indicates the location of the dominant sound in the surround sound image using a cross-hairs pointer (surround display only).
- Page 95 Display Information The following functions are not supported for 16-Channel audio: Audio input to bar mapping Audio output mapping Correlation meters Lissajous and phase displays Headphone NOTE. You cannot modify the input and output mapping because the mappings are fixed for 16-Channel audio. Selecting Audio Input for 1.
-
Page 96: Picture Display
Display Information Quick Selection of 1-8 1. Select a tile. or 9-16 Channels of 2. Press and hold the Audio button to open the Audio display in a tile and view Embedded Audio the Audio pop-up menu. 3. Select Audio Input and then select Emb. 1-8 or Emb. 9-16. Picture Display Pressing the PICT button calls up the Picture display, which lets you see the picture generated by the video signal. - Page 97 Display Information Elements of the Picture In full-screen mode, there is no cropping. Pictures are decimated horizontally or vertically to obtain the correct aspect ratio. This decimation may cause some Display artifacts. This behavior may be evident on a sweep signal. Also see the online help for the Picture Aspect Ratio for related information.
- Page 98 Display Information Picture Display Pop-Up When monitoring to ensure that branding or other elements do not overlay essential text or video action, use the PICT pop-up menu to select a Safe Action Menu and Safe Title graticule. The Safe Action Area is the maximum image area within which all significant action should be contained, and the Safe Title Area is the maximum image area within which all significant titles should be contained.
-
Page 99: Functions
Functions Functions Gain, Sweep, and Magnification Set the gain, sweep mode, and sweep rate using the GAIN, SWEEP, and MAG buttons. A lit front-panel button indicates that the function is active. NOTE. Gain, Sweep, and Magnification do not apply to all display types. To Set Gain Use Gain with the WFM, VECTOR, and Bowtie displays. -
Page 100: Cursors
Functions To Set Magnification Use Magnification with the WFM, VECTOR, and Bowtie displays. Select a trace display. Press and hold the MAG button to display the Magnification pop-up menu. Select a magnification setting, such as Best View, x10, x20, x25, or x30. In the Vector displays, the magnification is called H Gain (horizontal gain). -
Page 101: Capture
Functions 6. Read the cursor measurement in the Cursors readout. Figure 42: Using cursors in a waveform display Capture The capture function has a Freeze mode. Freeze mode can freeze a single tile, or all tiles simultaneously, and saves it to memory while other displays and information continue to be live. -
Page 102: Line Select
Functions Line Select Line Select allows you to select lines in the waveform display. This function is accessible from the front panel of your instrument by pressing the LINE SEL button. 1. Select the tile containing the display for which you want to set Line Select Mode. -
Page 103: Headphone Volume And Source Adjustment
Functions Headphone Volume and Source Adjustment WARNING. To avoid damaging your hearing, always turn the volume down to the minimum before you put on headphones, and then turn the volume up slowly. The headphone jack is located on the front panel of your instrument. You can adjust the volume to the headphones from the Audio menu as follows: 1. - Page 104 Functions Display settings Readout setting Graticule settings To Save Presets The instrument can store up to 32 separate instrument presets. The presets are divided into four groups, A through D, with each group containing 8 preset storage locations. The default preset names are A1 – A8, B1 – B8, C1 – C8, and D1 – D8. Quick access to presets 1 –...
- Page 105 Functions Importing Presets from a You can also save presets to the USB drive so that you can load them onto multiple WVR5200 instruments in your system. To import presets to a USB USB Device memory device: 1. Insert a USB memory device into the USB drive located in the front of the instrument.
-
Page 106: Software Upgrades
Installation procedure. Obtain the Latest Software Download the latest version of software available for your instrument. 1. Use the Web browser on your PC to navigate to the following Tektronix Web site: http://www.tektronix.com/downloads 2. On the Downloads Web page, search by model number (for example, WVR5200) and filter by software and software type to locate the latest... - Page 107 Functions WfmUpgrd NOTE. To avoid upgrade problems, remove all pre-existing files and directories from the USB flash drive. Be sure to create the WfmUpgrd directory exactly as shown. 4. Open the directory (from the extracted archive) and copy the firmware.pkg file to the WfmUpgrd directory on the USB flash drive.
- Page 108 Functions 12. After the instrument finishes restarting, use the Configuration menu to verify the correct software version installed. 13. Press the MAIN button and navigate to USB Unmount and press the SEL button. This electrically unmounts the flash drive so that it can be safely removed from the instrument.
- Page 109 Functions 4. Prepare the instrument for the software upgrade: a. Press the CONFIG front panel button. b. Navigate to Utilities > System Upgrade > Upgrade Options > Network Upgrade. c. Press the SEL front panel button. This displays the System Software Upgrade window.
- Page 110 7. Start the upgrade process. When it is complete, the instrument should reboot. If it does not, cycle the power. If you continue to experience a problem, contact your Tektronix sales representative for assistance. WVR5200 Waveform Rasterizer User Manual...
-
Page 111: Checking Chroma/Luma Delay (Lightning Display)
Checking Chroma/Luma Delay (Lightning Display) The Lightning display can be used for interchannel timing measurements. If the color-difference signal is not coincident with luma, the transitions between the color dots will deviate from the center mark of a delay scale. The amount deviated represents the relative signal delay between luma and the color-difference signal. - Page 112 Checking Chroma/Luma Delay (Lightning Display) Figure 45: Determining transition intersections in the Lightning display The + tic marks on the graticule indicate the following timing errors: 1080p 50, 59.94, 60, 3Gbps (3 Gb/s and dual link formats) Timing error Tic mark SD Timing error (ns) HD Timing error (ns) (ns)
-
Page 113: Checking Gamut
Checking Gamut Checking Gamut Signals that are legal and valid in one signal representation may not be legal in another representation. Specifically, signals which are legal in the Digital YCbCr representation may not be legal if transcoded to RGB or encoded to NTSC / PAL. Any signal that fails this test is considered out of gamut. -
Page 114: Checking Rgb Gamut
Checking Gamut Quad Diamond (Requires Option S3D)– Use to show the disparity between the left and right channels of a 3D signal. (See page 40, Gamut Display.) Arrowhead – Use to detect composite gamut errors, without employing a composite encoder. Spearhead –... - Page 115 Checking Gamut For a signal to be in gamut, all signal vectors must lie within the G-B and G-R diamonds. Conversely, if a signal vector extends outside the diamond, it is out of gamut. The direction of an excursion out of gamut indicates which signal is excessive.
- Page 116 Checking Gamut B > 700 mV Example C: R - Ok G - Ok, 350 mV B < 0 mV Figure 47: Out-of-gamut examples Usage Notes As with the lightning display, bending of the transitions indicates timing delays. When a color bar signal is applied, the vertical axis becomes an indicator of delay errors.
-
Page 117: Checking Composite Gamut
Checking Gamut Checking Composite Gamut The Arrowhead gamut display plots luminance (Y) against chrominance (C) to check if the composite signal adheres to standard gamut. NTSC and PAL Arrowhead displays (75% Color bars) and indicates the values of the graticule lines. -
Page 118: Checking Luma Gamut
Checking Gamut Usage Notes To automate this check, do the procedure Automating Gamut Checks. (See page 102.) Checking Luma Gamut Luma limit thresholds can be configured for identifying luma exceeding threshold limits. They apply to both the incoming SDI and to the Arrowhead representation of the SDI input as a composite signal. -
Page 119: Arib Displays
ARIB Displays ARIB Displays Your instrument supports conformance to ARIB data standards contained in the signal source. You will need to enable the ARIB displays from the Configuration menu in the Aux Data Settings submenu. ARIB information is contained in the following status screen displays: ARIB Status ARIB STD-B.39 Display... -
Page 120: Arib Status
ARIB Displays ARIB Status The ARIB Status display is a status summary screen for the signal. (See Figure 49.) Figure 49: ARIB Status display, showing no data present Use the ARIB Status display with the other specific ARIB Display screens to quickly determine if the data you are interested in is present in the signal. -
Page 121: Arib Std-B.39 Display
ARIB Displays Also, the status of the following ITU standard is shown: ITU.R BT-1685 (inter-stationary Control Data conveyed by ancillary data packets). ARIB STD-B.39 Display The ARIB STD-B.39 display shows the decoded data for video signals using ancillary data compliant with ARIB STD-B.39. (See Figure 50.) When this display is selected, the instrument searches the signal for ARIB STD-B.39 packets using the DID/SDID combinations defined by either the ITU or ARIB standards organizations. - Page 122 ARIB Displays The decoded ancillary data includes the following: DID - Data Identifier of the requested inter-stationary control packet; can be any of the following: ARIB specification - 0x5F ITU Specification - 0x43 Type - Type of the ANC Data packet. For ARIB B.39, this is always a Type 2 packet (DID less than 0x80), as defined by SMPTE 291M.
- Page 123 ARIB Displays Next Downmix/Audio Mode - Indicates the audio downmix and soundstage configuration of the next scheduled program. Audio Mode Countdown - A countdown timer indicating an upcoming change in audio mode, which counts down from 254 (0xFE). A value of 0xFF indicates that no format change is pending within the next several seconds.
-
Page 124: Arib Std-B.37 Display And Status Screens
ARIB Displays ARIB STD-B.37 Display and Status Screens The ARIB STD-B.37 display shows the decoded data for video signals using ancillary data compliant with ARIB STD-B.37. (See Figure 51.) When this display is selected, the instrument searches the signal for ARIB STD-B.37 packets using the DID/SDID combinations defined by ARIB. - Page 125 ARIB Displays The decoded ancillary data includes the following: DID - Data Identifier of the requested closed captioning packet; can be any of the following: Analog signal - 0x5F SD Signal - 0x5 HD Signal - 0x5F SDID - Secondary Data Identifier of the requested packet; can be any of the following: Analog signal - 0xDD SD Signal - 0xDE...
- Page 126 ARIB Displays CC Data ID - Indicates the CC Data ID of the packet. Can be one of the following: Exchange Format CC Exchange Format PMI Exchange Format Page 1 Exchange Format Page 2 Short Form Management Data Short Form Text Undefined or Dummy Data Set Mode - Mode can be either Sequential or Buffer.
-
Page 127: Arib Std-B.35 Display And Status Screens
ARIB Displays ARIB STD-B.35 Display and Status Screens The ARIB STD-B.35 display shows the decoded data for video signals using ancillary data compliant with ARIB STD-B.35. (See Figure 52.) When this display is selected, the instrument searches the signal for ARIB STD-B.35 packets using the DID/SDID combinations defined by ARIB. - Page 128 ARIB Displays DC - Data Count word of the acquired packet. The number of User Data words is displayed in decimal. The actual value (with parity bits added) is displayed in parenthesis, in hexadecimal. Field - The field of the video from which the packet was acquired. Displays 1 for progressive formats.
-
Page 129: Arib Tr-B.23 (1) Display And Status Screens
ARIB Displays ARIB TR-B.23 (1) Display and Status Screens The ARIB TR-B.23 (1) display shows the decoded data for video signals using ancillary data compliant with ARIB TR-B.23 (1). (See Figure 53.) When this display is selected, the instrument searches the signal for ARIB TR-B.23 (1) packets using the DID/SDID combinations defined by ARIB. - Page 130 ARIB Displays DC - Data Count word of the acquired packet. The number of User Data words is displayed in decimal. The actual value (with parity bits added) is displayed in parenthesis, in hexadecimal. Field - The field of the video from which the packet was acquired. Displays 1 for progressive formats.
-
Page 131: Arib Tr-B.23 (2) Display And Status Screens
ARIB Displays ARIB TR-B.23 (2) Display and Status Screens The ARIB TR-B.23 (2) display shows the decoded data for video signals using ancillary data compliant with ARIB TR-B.23 (2). (See Figure 54.) When this display is selected, the instrument searches the signal for ARIB TR-B.23 (2) packets using the DID/SDID combinations defined by ARIB. - Page 132 ARIB Displays DC - Data Count word of the acquired packet. The number of User Data words is displayed in decimal. The actual value (with parity bits added) is displayed in parenthesis, in hexadecimal. Field - The field of the video from which the packet was acquired. Displays 1 for progressive formats.
-
Page 133: Arib Tr-B.22 Display And Status Screens
ARIB Displays ARIB TR-B.22 Display and Status Screens The ARIB TR-B.22 display shows the decoded data for video signals using ancillary data compliant with ARIB TR-B.22. (See Figure 55.) When this display is selected, the instrument searches the signal for ARIB TR-B.22 packets using the DID/SDID combinations defined by ARIB. - Page 134 ARIB Displays DC - Data Count word of the acquired packet. The number of User Data words is displayed in decimal. The actual value (with parity bits added) is displayed in parenthesis, in hexadecimal. Field - The field of the video from which the packet was acquired. Displays 1 for progressive formats.
-
Page 135: Audio Monitoring
Audio Monitoring Audio Monitoring Your instrument can monitor embedded audio signals if it has Option AUD installed. It can measure levels, monitor phase, display phase correlation, and monitor surround-sound audio. You can specify meter ballistics and scales, set test and peak program indicator levels, and specify how phase is displayed. NOTE. -
Page 136: To Check Audio Level And Phase
Audio Monitoring 3. Use the Arrow Keys and SEL button to make selections in the steps that follow. 4. Select Audio Input and then select one of the audio input options shown. NOTE. The available selections depend on the installed audio option. Selecting Follows Video selects the audio to video mapping set in the configuration menu. - Page 137 Audio Monitoring Figure 56: Audio levels To Check Audio Phase 1. Select Aux Display. 2. Select Phase Display to turn it on. 3. Select the Phase Style. Choose either a Lissajous Soundstage or X-Y orientation for the Lissajous signal. 4. Select the phase pair to be displayed, or select Custom and select independent channels using the Phase Channel A and Phase Channel B entries.
- Page 138 Audio Monitoring Figure 57: Checking for phase correlation Usage Notes The Lissajous or phase display is a plot of one channel against another on an orthogonal pair of axes. Soundstage plots the two channels at 45 degree angles, with the mono combination appearing on the vertical axis–...
-
Page 139: To Check Surround Sound
Audio Monitoring To Check Surround Sound Your instrument can also display the surround sound listening environment. The following procedures help you get started. 1. Open the audio display in one tile and select the input containing the surround audio. (See page 119, To Set Up an Audio Input.) 2. - Page 140 Audio Monitoring Figure 58: Surround sound indicators NOTE. The Audio Surround Sound display is courtesy of Radio-Technische Werkstaetten GmbH & Co. KG (RTW) of Cologne, Germany. Elements of the Surround Level Indicators – indicate the audio level balance among the left (L), right (R), left-surround (Ls), and right-surround (Rs) channels as cyan lines on the Sound Display Loudness Grid.
- Page 141 Audio Monitoring the correlation between the adjacent channels. A short-to-medium length green bar indicates positive correlation between the channels, forming a localized phantom sound source located at the white tic mark. The bar grows to full length and changes color to yellow as the correlation moves to zero, indicating a wide, non-localized sound image.
- Page 142 Audio Monitoring Usage Notes The displays shown here are examples of how the surround sound waveform appears for some typical signal types. Uncorrelated signals: same level in the L, C, R, Ls, and Rs channels. Sine wave test tone: same level in the L,C, R, Ls, and Rs channels.
-
Page 143: Closed Captioning (Cc), Teletext, Afd, And Safe Area Compliance
Closed Captioning (CC), Teletext, AFD, and Safe Area Compliance Closed Captioning (CC), Teletext, AFD, and Safe Area Compliance With Option DATA installed, this instrument can monitor for CC data (including V-Chip ratings) present in the selected signal and display that data overlaid on the Picture display. - Page 144 Closed Captioning (CC), Teletext, AFD, and Safe Area Compliance 5. Select VBI Timing and select Normal, Early, or Late. 6. If required services is set to Yes, select Req Services and press the SEL button. This will show a dialog box that allows you to select CC and Text required channels.
- Page 145 Closed Captioning (CC), Teletext, AFD, and Safe Area Compliance Figure 59: Auxiliary Data Status display To Display CC 1. Select a tile. 2. Press and hold the PICT button to display the Picture pop-up menu. 3. Select CC/Teletext Format and select the CC type, if any, you want to display.
-
Page 146: Monitoring For Safe Area Compliance
Closed Captioning (CC), Teletext, AFD, and Safe Area Compliance Usage Notes PICT displays in individual tiles allow their Services and Pages to be selected independently. CC text is not captured with the Picture image when using Freeze. CC/Teletext setups are also stored when saved with Presets and restored at power on. - Page 147 Closed Captioning (CC), Teletext, AFD, and Safe Area Compliance 4. Select one of the following: Auto to let the instrument automatically select the size and offsets of the safe area. 4x3, 14x9, or 16x9 to set the safe area size and offsets appropriate for these aspect ratios based on the selected standard.
-
Page 148: Monitoring For Afd Compliance
Closed Captioning (CC), Teletext, AFD, and Safe Area Compliance Monitoring for AFD Compliance To display graticules for monitoring for AFD compliance, you must turn the graticules on from the pop-up menu in the Picture Display. View information about AFD graticules on the Auxiliary Data Status display. To Configure AFD 1. -
Page 149: Application Example
Application Example Application Example Timing a Studio Your instrument supports multiple methods and techniques for timing a studio, all of which require an external reference to your instrument. Timing a studio involves adjusting the references going to different sources so that their output feeds have the same timing when they arrive at a common point, such as a production switcher. - Page 150 field rate displays without Mag active to show the location of significantly mistimed signals. Using the Timing-Display The Tektronix Timing Display provides a quick, easy way to measure the timing of an input relative to the external reference: Method The rectangular display automatically scales to match the input signal. For progressive signals, the display represents one field;...
- Page 151 Application Example To use the Timing display to time a signal to a reference. 1. Select a tile in which to time the active input. 2. Apply the input signal to be timed to the appropriate input, terminate it properly and select it. 3.
- Page 152 Application Example To time the inputs to a router. 1. Perform steps 1 through 5 of the previous procedure. 2. Route the signal you want as the master to the appropriate input, SDI or Composite, and terminate properly. 3. Route the reference signal to the reference input and terminate appropriately. 4.
- Page 153 Application Example The Serial (0H) setting, uses the methodology implied in appendix A of SMPTE RP168. In this mode timing is considered to be zero when the 0H sample of the serial stream aligns with the reference edge of the analog sync. Note that this timing is actually at the scrambled interface which is slightly different than timing to the parallel data into the serializer or the parallel data out of the deserializer due to delays in those functions.
- Page 154 Application Example WVR5200 Waveform Rasterizer User Manual...
-
Page 155: Index
Index Symbols and Numbers Audio Above-bar warnings, 76 2xHD Level B 3 Gb/s signal, 27 Bar Targets AUDIO button, 74 3D, 2, 28, 29 Vector pop-up menu, 38 checking surround sound, 123 additional settings in CONFIG Basic operation, 23 configuring and menu, 33 Black events, 61 monitoring, 119... - Page 156 Index Documentation Gamut, 2 Inputs purposes of, ix 3D Quad Diamond, 2 selecting, 19, 25 Dolby arrowhead display, 101 Inspection status display, 72 Arrowhead display, 40 incoming, 8 timing, 74 button, 40 Instrument displays, 23 Dominance indicator checking, 97 Instrument options, 3 how to display, 123 Diamond display, 41 checking installed, 4...
- Page 157 Index Monitoring CC and safe area Picture display, 80 Safety Summary, vi compliance Pop-up menus SAV and EAV task description, 127 Audio, 77 finding in the active video Multi-Input Display mode, 2, 13, Gamut, 43 stream, 49 Measure, 45 Save to select inputs, 25 Vector, 37 Measure pop-up menu, 45...
- Page 158 Index Vector Waveform display, 95 Center Waveform, 36 Tally Display, 36 Display, 34 camera, 18 Pop-up menu, 37 Display, elements of, 34 TandemVu®, 1 VECT button, 36 Filter, 35 TandemVu® (Overlay), 13, 39 Vector pop-up menu, 36 Filter:Flat, 35 Teletext, 127 Vector pop-up menu Filter:Low Pass, 35 Tile...
Need help?
Do you have a question about the WVR52003G and is the answer not in the manual?
Questions and answers