
Related Manuals for THORLABS BC207UV


Summary of Contents for THORLABS BC207UV
- Page 1 Thorlabs Camera Beam Profiler Beam Analyzing Software BC207UV(/M), BC207VIS(/M), with M2MS(-AL) Operating Manual 2022...
- Page 2 Version: Date: 10-Jan-2022 Copyright © 2022 Thorlabs...
-
Page 3: Table Of Contents
Table of Contents Foreword 1 General Information Ordering Codes and Accessories Requirements 2 Getting Started Parts List BC207UV(/M) and BC207VIS(/M) 3 Operating Elements BC207 Series Operating Elements BC207 Series 3.1.1 Filter Wheel 3.1.1.1 CMOS Sensor Protective Glass Window 3.1.1.2 Trigger Input 3.1.1.3... - Page 4 Intensity Threshold 5.5.1.5 Beam Profiler Information 5.5.2 Camera Beam Profiler Parameter 5.5.3 Binning 5.5.3.1 Exposure Control 5.5.3.2 Gain Control 5.5.3.3 Hot Pixel Correction 5.5.3.4 Trigger 5.5.3.5 Region of Interest 5.5.3.6 Calculation Parameter 5.5.4 Calculation Area 5.5.4.1 Averaging Mode 5.5.4.2 Clip Level 5.5.4.3 Hold Maximum 5.5.4.4...
- Page 5 Pass/Fail Test 6.2.2 Save Measurement Results 6.2.3 Export Device Data 6.2.3.1 Print Windows 6.2.3.2 Save Test Protocol 6.2.3.3 Beam Quality (M²) Measurement General 6.3.1 M2MS Operating Principle 6.3.2 Beam Diameter Requirements 6.3.3 M² Meter Extension Set 6.3.4 M² Meter Set with BC207 Series Camera Beam Profiler 6.3.5 Setup M2MS 6.3.6...
- Page 6 Ellipse (Fitted) X-Y-Profile Measurement Gaussian Fit Measurement Bessel Fit 10 Appendix 10.1 Technical Data BC207x 10.2 Dimensions BC207UV(/M) and BC207VIS(/M) 10.3 Filter Wheel 10.4 Technical Data M2MS Extension Sets 10.5 Wavelength Response 10.6 Power Ranges 10.7 Initial Settings 10.8 Compatibility with Older Hardware 10.9 List of Acronyms...
- Page 7 Paragraphs preceded by this symbol explain hazards that could damage the instrument and the connected equipment or may cause loss of data. Note This manual also contains "NOTES" and "HINTS" written in this form. Please read this advice carefully! © 2022 Thorlabs...
-
Page 8: General Information
2D analysis of the beam's power density distri- bution. The Thorlabs BC207UV(/M) and BC207VIS(/M) camera beam profilers are suited for use within the UV range or visible light range, respectively. The high resolution in a relatively large field of view and the thermal stability make the BC207 Series Camera Beam Profilers a superior product. -
Page 9: Requirements
1.2 Requirements These are the requirements for the PC intended to be used for operation of the BC207UV(/M) or BC207VIS(/M) using the Thorlabs Beam Software V8.0 or higher. Please find the BEAM Software for download from the Beam Software website. -
Page 10: Getting Started
Verify that you have received the following items within the package: 2.1 Parts List BC207UV(/M) and BC207VIS(/M) BC207UV(/M) or BC207VIS(/M) Beam Profiler 1. 1 BC207UV(/M) or BC207-VIS(/M) Beam Profiler Instrument with Mounted Filter Wheel 2. 6 Mounted Attenuation Filters, see Section Filter Wheel for further information 3. -
Page 11: Operating Elements
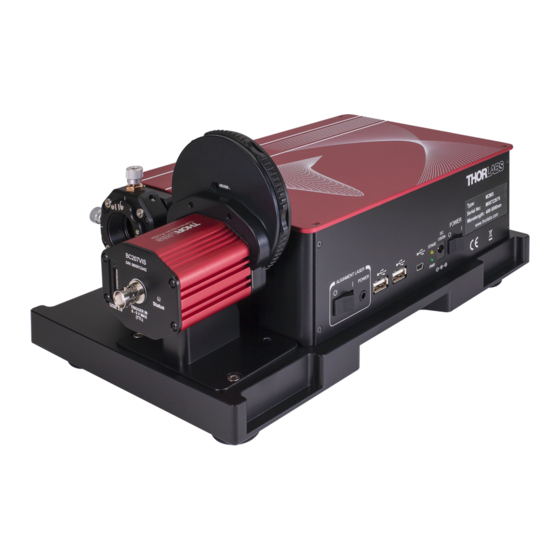
3.1 BC207 Series 3.1.1 Operating Elements BC207 Series The components of the BC207UV are labeled in the image below. Aside from the mounting thread, BC207UV and BC207UV/M are identical. BC207VIS and BC207VIS/M outer dimensions and components look identical to BC207UV and BC207UV/M. BC207VIS(/M) differs in the mounted filters and the protection glass. -
Page 12: Filter Wheel
Chapter 3: Operating Elements 3.1.1.1 Filter Wheel The Thorlabs BC207UV(/M) and BC207VIS(/M) Camera Beam Profilers are equipped with a fil- ter wheel containing six different neutral density (ND) optical attenuation filters. The filter wheel is designed to quickly and easily adapt the light source power to a power level within the dy- namic range of the CMOS camera. - Page 13 BC207 Series Beam Profiler. In this case additional means for external beam attenuation in front of the beam profiler are required. The prism based Thorlabs ATT30x laser beam attenuators are particularly suitable as they preserve the polarization, size, and shape of the beam.
-
Page 14: Cmos Sensor Protective Glass Window
The appropriate BNC connector to connect to a trigger out of a laser driver is located on the back side of the instrument body, see the chapter Operating Ele- ments BC207UV(/M) and BC207VIS(/M) . More Information on how to use the trigger input is described in the chapter Trigger in the software section of the manual. - Page 15 BC207 Series Chapter 3: Operating Elements Mount the BC207UV(/M) or BC207VIS(/M) Camera Beam Profiler to your optical system using a Thorlabs post, post holder and a base or clamping fork. Sensor Position on BC207UV(/M) and BC207VIS(/M) The sensor is centered with respect to the mounting thread holes on the bottom of the device.
-
Page 16: Bc207 Series With M2Ms Extension Set
Please use the mounting adapter for BC207 Series to M2MS in order to mount the BC207UV(/M) or BC207VIS(/M) beam profiler to the M2MS Measurement Extension. For a mounting adapter for BC207 onto a preexisting M2MS Extension Set, please contact Thorlabs. - Page 17 Chapter 3: Operating Elements Bottom View BC207 Series M2MS Adapter for BC207UV(/M) and BC207VIS(/M) 2. Hold the BC207 Series device to the mounting adapter and turn both together upside down. Insert the 8mm long M4 x 0.7 cap screw into the mounting how on the bottom of the moun- ting adapter and secure the BC207 Series device on the adapter.
- Page 18 BC207 Series Chapter 3: Operating Elements 4. Secure the adapter with the two enclosed M4 cylinder head screws onto the M2MS Mea- surement Extension. The BC207UV(/M) or BCVIS(/M) is now securely mounted to the M2MS Measurement Exten- sion. Page 11 MTN026962-D02...
-
Page 19: M2Ms With Bc207Uv(/M) And Bc207Vis(/M)
BC207 Series Chapter 3: Operating Elements 3.2.2.1 M2MS with BC207UV(/M) and BC207VIS(/M) The operating elements of the combined setup with BC207 Series Camera Beam Profiler mounted to the M2MS Extension Setup for full M measurements are as follows: Page 12 Rev: 8.1, 10-Jan-2022... -
Page 20: Installation
· Windows Security will ask your confirmation to install the Thorlabs USB driver. · You may check the box "Always trust software from "Thorlabs GmbH".This will shorten the in- stallation. However, if you do not want to do that, please click the "Install" button. You will then be asked to confirm the installation of further Thorlabs software components. -
Page 21: Start The Application
BC207 Series Chapter 4: Installation 4.3 Start the Application Click the "Programs" g "Thorlabs" g "Thorlabs Beam Application" entry, or simply click the ap- propriate icon added to your desktop. When the application is started, the following start screen appears:... - Page 22 BC207 Series Chapter 4: Installation Click on 'Refresh Device List' for an update if you have very recently connected or removed a Beam Profiler instrument from your PC. If an expected instrument is still missing check if the USB driver is properly installed (see chapter Troubleshooting After selecting a Beam Profiler it will be connected and displayed in the Beam Settings Panel...
-
Page 23: The Graphics User Interface (Gui)
5.1 Menu Bar All user activities can be done using the menu bar items 5.1.1 File Menu These menu entries deal with files or printing. Page 16 Rev: 8.1, 10-Jan-2022 © 2022 Thorlabs... -
Page 24: Control Menu
BC207 Series Chapter 5: The Graphics User Interface (GUI) The entries in the first block, Import and Export Configuration, are related to XML files which contain information about the chosen Beam Profiler device and its settings, file export paramet- ers and application settings. In order to copy the GUI appearance and Beam Profiler settings to another PC you need to save the configuration file, copy it and load it on the target system. -
Page 25: Options Menu
(Distributed System Manager, NI CVI Runtime Engine). 5.1.3 Options Menu These entries allow changing the device (Beam Profiler) and application (GUI) specific settings and let you choose a language. Beam Settings Page 18 Rev: 8.1, 10-Jan-2022 © 2022 Thorlabs... - Page 26 To do so a few things need to be considered. When starting the software, the application loads valid *.lut files from the folder: ...\My Documents\Thorlabs\Thorlabs Beam\LUT A valid *.lut file must fulfill the following criteria: ·...
- Page 27 BC207 Series Chapter 5: The Graphics User Interface (GUI) Linear Scale Logarithmic Scale Quad Scale "..." stands for the intermediary values. Page 20 Rev: 8.1, 10-Jan-2022 © 2022 Thorlabs...
- Page 28 BC207 Series Chapter 5: The Graphics User Interface (GUI) Reset Application Settings to Defaults This button resets all BEAM application settings to defaults: Application Setting Default Value Explanation Intensity Threshold Disabled Auto Exposure Enabled Exposure time set to automatic Trigger Mode No Trigger Instrument set to continuous data acquisition Region of Interest...
-
Page 29: Windows Menu
"Save Current / Load Workspace" saves your Beam Software GUI appearance to a ini-file that can be loaded at any time. "Recent Files" lists recently used workspace files so that you can quickly load often used workspaces. Page 22 Rev: 8.1, 10-Jan-2022 © 2022 Thorlabs... -
Page 30: Help Menu
Check for Update searches for available software updates. About Thorlabs displays device information and software versions details: If you have trouble with the software, please submit the version of the application to Thorlabs. This can help to resolve your problem. -
Page 31: Tool Bar
Toggle auto scale to peak on/off Toggle max hold on/off Change ROI (drop down) Open child window Manual Vergence Measurement Open child window Tuning View Open child window Beam Overlapping Page 24 Rev: 8.1, 10-Jan-2022 © 2022 Thorlabs... -
Page 32: Status Bar
BC207 Series Chapter 5: The Graphics User Interface (GUI) 5.3 Status Bar The status bar displays important status information about the Camera Beam Profiler concern- · Errors and warnings, see chapter Warnings and Errors · Plot Data Point Status, see section Plots ·... -
Page 33: Beam Settings
GUI frame. The panel view can be customized easi- ly by expanding or hiding topics. Beam Settings BC207 Series Please read this section carefully and follow the setup instructions in order to maximize the ac- curacy of your measurements. Page 26 Rev: 8.1, 10-Jan-2022 © 2022 Thorlabs... -
Page 34: Optical Setup
Power. It enables consideration of the known response curve stored within the Beam Profiler instrument. The correct wavelength is important for accurate Beam Quality (M²) results as well. The available range is limited to 245 - 400 nm for BC207UV(/M) and 350 - 1100 nm for BC207VIS(/M), respectively. -
Page 35: Attenuation
Click the "Start" button - the Power Correction Dialog appears. The "Current Power Value" is the power as actually measured by the integrated Beam Profiler power meter. Enter the power meter reading from the external power meter into the "Power Page 28 Rev: 8.1, 10-Jan-2022 © 2022 Thorlabs... -
Page 36: Ambient Light Correction
BC207 Series Chapter 5: The Graphics User Interface (GUI) Meter Value" control. Click "Apply" and both values will coincide. Click "Close'" to leave the panel. The difference between the power measured externally and measured by the Beam Profiler will be displayed as an offset in [dB]. This offset (in dB) is stored in the Beam Profiler and is read out and activated automatically each time after connecting this instrument. -
Page 37: Intensity Threshold
Click OK and close the Ambient Light Correction window. The Ambient Light Correction ap- pears enabled, and the correction factor will be displayed. Note · Thorlabs Beam Software uses a unique approach for Ambient Light Correction - please see details in section Application Notes ·... -
Page 38: Beam Profiler Information
BC207 Series Chapter 5: The Graphics User Interface (GUI) The threshold is shown in the X and Y profiles as a dot-and-dashed line with a label, if the op- tion Auto Scale to Peak is disabled - in this case, the intensity scale of the X or Y profile displays the percentage of the ADC maximum output level: If Auto Scale to Peak ist enabled, the intensity scale displays the percentage of the peak level, and thus, the Intensity Threshold label cannot be displayed. -
Page 39: Binning
Please be aware that the spatial ac- curacy is reduced by binning. Further, binning is very useful for weak signal to reduce the noise thereof. Page 32 Rev: 8.1, 10-Jan-2022 © 2022 Thorlabs... -
Page 40: Exposure Control
BC207 Series Chapter 5: The Graphics User Interface (GUI) 5.5.3.2 Exposure Control Exposure time is the period of time when the CMOS global shutter is open and the image sensor is exposed. For CW sources there is a linear dependency between exposure time and mean image brightness. -
Page 41: Hot Pixel Correction
M² beam quality measurements, and may impact the baseline definition during ambient light correction. Thorlabs Beam offers a hot pixel correction feature. To reduce or eliminate hot pixels from influencing the measurement, set the hot pixel correction to Weak, Moderate or Strong (maximum suppression of hot pixels). This function can be used to get the current threshold value for hot-pixel correction. - Page 42 BC207 Series Chapter 5: The Graphics User Interface (GUI) 10 Hz: The BC207 Series Camera Beam Profiler together with the Beam Software can discrimi- nate each single pulse in the beam profile analysis when the pulse frequency is at maximum 10 Hz.
- Page 43 0.0 V and +5.5 V. Higher or lower voltages may damage the trigger in- put. See section Trigger Input for details. The TTL Trigger input parameters are listed in the table below: Page 36 Rev: 8.1, 10-Jan-2022 © 2022 Thorlabs...
- Page 44 BC207 Series Chapter 5: The Graphics User Interface (GUI) Parameter Value Save Static Voltage Level 0.0V 5.5V Trigger Input Low 0 to 0.5 V Trigger Input High 2.4 V to 5.5 V Input Impedance > 100 kΩ Pulse Width (Min) 100 µ...
-
Page 45: Region Of Interest
Please enlarge the ROI when the beam under test does not fit to the selected ROI area. The ROI height and width should be at least two times the beam width. Note Page 38 Rev: 8.1, 10-Jan-2022 © 2022 Thorlabs... - Page 46 BC207 Series Chapter 5: The Graphics User Interface (GUI) Do not forget to click the button, as soon as it becomes highlighted green! Note The Beam Profiler's point of origin (X = 0, Y = 0) is always fixed to the center of the entire sensor area so that X and Y coordinates have a bipolar range.
-
Page 47: Calculation Parameter
Six presets are provided to choose a Calculation Area. Auto Rectangle: The software will analyze every image from the BC207 Series automati- cally and determine the area in which a measurable amount of power is Page 40 Rev: 8.1, 10-Jan-2022 © 2022 Thorlabs... - Page 48 BC207 Series Chapter 5: The Graphics User Interface (GUI) present. Areas with a power level lower than the clip level will be ex- cluded from further calculations. Auto Rectangle ISO: The rectangular calculation area is calculated according to ISO11146-1 using multiple iteration steps. The clip level is determined during the calculation.
-
Page 49: Averaging Mode
In comparison to the software trigger function of the Beam Software, Hold Maximum will only store and analyze maximum values, while in software trigger, a threshold can be set. Page 42 Rev: 8.1, 10-Jan-2022 © 2022 Thorlabs... -
Page 50: Approximate Ellipse
BC207 Series Chapter 5: The Graphics User Interface (GUI) 5.5.4.5 Approximate Ellipse Enable the Approximate Ellipse check box in order to get the best fitted beam ellipse. This setting provides more stable and reliable ellipse results. Otherwise, ellipse data are retrieved from single minimum and maximum diameters of the ellip- tical beam cross section. -
Page 51: Unit
The Beam Software allows to show different plots of beam measurements: Plot Positions Plot Power Plot Diameters Plot Gaussian Fit Plot Orientation Plot Environment Data Beam Stability The section Plot Over Time Parameter is used to configure these plots: Page 44 Rev: 8.1, 10-Jan-2022 © 2022 Thorlabs... -
Page 52: Translation Stage Control
"Translation Stage Control" and "M set" appear as the last two topics of the Beam Settings panel. The description in this section assumes a Thorlabs DDS100 Linear Translation Stage, as it is used in the M2MS Extension Set This panel allows the user to manually control the translation stage. - Page 53 Optical Setup The focus position is then determined based on internal M2MS parameters, the type of beam profiler, the focus offset and the determined focal length. Page 46 Rev: 8.1, 10-Jan-2022 © 2022 Thorlabs...
-
Page 54: Child Windows
"Windows". Additional child windows are accessible through the menu bar The appearance of the Thorlabs Beam Software can be arranged according to your require- ments and taste. All child windows can be re-sized and flexibly positioned. Here is an example... -
Page 55: Projection
Displays the approximated Beam Ellipse in yellow color. The Ellipse ellipse is drawn corresponding to fitted or unfitted numerical data. See Beam Settings to enable/disable the ellipse fit. Page 48 Rev: 8.1, 10-Jan-2022 © 2022 Thorlabs... - Page 56 BC207 Series Chapter 5: The Graphics User Interface (GUI) Toolbar Icon Associated Action The distance measurement editor opens a table beside the projection image. When drawing lines into the projection Distance Measurement Mode image, the distance is inserted into the table. A maximum of 10 distances can be drawn.
- Page 57 ), the origin of the coordinate system is the selected reference position. Hori- zontal axis is X and vertical axis is Y. Both axes are also labeled on the Beam Profiler housing. Page 50 Rev: 8.1, 10-Jan-2022 © 2022 Thorlabs...
-
Page 58: Profile
BC207 Series Chapter 5: The Graphics User Interface (GUI) 5.6.2 3D Profile The 3D Profile illustrates the power density distribution of the measured optical beam. Whereas the beam's cross-section is parallel with the X-Y-plane, the relative power intensity is shown in the Z direction (Pseudo 3D). -
Page 59: And Y Profiles
0 to 100%, where 100% denotes the maximum value in the selected row / column. If the "Autoscale to Peak" function is disabled, the X and Y profiles will show a peak amplitude equal to the AD converter saturation. Page 52 Rev: 8.1, 10-Jan-2022 © 2022 Thorlabs... -
Page 60: Zooming And Panning Diagrams
BC207 Series Chapter 5: The Graphics User Interface (GUI) The amplitude of the Gaussian fit curve may be lower or even higher than the peak intensity of the measured curve. The selected clip level (default 13.5%) is displayed if the "Auto Scale to Peak" function is en- abled (button The horizontal scale is displayed in pixels or µm and its range refers to the selected Region of... -
Page 61: Calculation Results
Click the marked green icon in the table in order to select or deselect parameters to be calculated and displayed. The fewer calculation results are enabled, the higher the speed performance of the software. Page 54 Rev: 8.1, 10-Jan-2022 © 2022 Thorlabs... - Page 62 BC207 Series Chapter 5: The Graphics User Interface (GUI) Note · Even if the Gaussian and / or Bessel Fit calculations are disabled from display in the Cal- culation results panel, the appropriate fitted curves are still shown in the X and Y Profile win- dows, if enabled there.
- Page 63 · Add date, time stamp, index (optional) · Click "Save Calculations" Lock / Unlock Test Parameters; Load / Save Test Parameter Configuration. These functions are related to the configuration of the Pass / Fail Test functionality. Page 56 Rev: 8.1, 10-Jan-2022 © 2022 Thorlabs...
- Page 64 BC207 Series Chapter 5: The Graphics User Interface (GUI) Sequential Saving This feature is used to save sequentially sets of the selected calculation results , e.g for a long term analysis. · Select the destination folder (see the preview pane). ·...
-
Page 65: Manual Vergence Measurement
The Beam Profiler is mounted so that it can slide along the beam propagation trace. This can be done using, for example, a Thorlabs M2 translation stage or a Thorlabs... - Page 66 BC207 Series Chapter 5: The Graphics User Interface (GUI) 3. Move the Beam Profiler, measure the distance again, enter the new distance into the box "Position 2" and press the 2nd icon. 4. The beam width at Position 2 is calculated and based on the entered distance change, the vergence angle in X and Y axes is displayed.
-
Page 67: Tuning View
· Peak Position X · Peak Position Y · Centroid Position X · Centroid Position Y · Ellipse Diameter min. · Ellipse Diameter max. · Beam Width Clip X · Beam Width Clip Y Page 60 Rev: 8.1, 10-Jan-2022 © 2022 Thorlabs... - Page 68 BC207 Series Chapter 5: The Graphics User Interface (GUI) On the scales, the observed minimum and maximum values are shown as blue triangles. They can be reset using the buttons marked above. Page 61 MTN026962-D02...
-
Page 69: Beam Overlapping
The overlay method can be selected in the box "Composite Mode": Overlay "Plus" In "Plus" mode the intensities of the snap shot and the live image are added. This eases the adjustment particularly of regions with lower intensity. Page 62 Rev: 8.1, 10-Jan-2022 © 2022 Thorlabs... - Page 70 BC207 Series Chapter 5: The Graphics User Interface (GUI) Overlay "Lighten" In "Lighten" mode, within the overlapping region only the "pixel" with higher intensity will be dis- played; the intensities of the snapshot and the current beam are not added. Overlay "Difference"...
-
Page 71: Plots
BC207 Series Chapter 5: The Graphics User Interface (GUI) 5.6.9 Plots Thorlabs Beam Software offers several additional plot windows to show the beam behavior: Plot Positions Plot Power Plot Diameters Plot Gaussian Fit Plot Orientation Plot Environment Data Beam Stability All plot windows are accessible via the "Windows"... -
Page 72: Plot Positions
BC207 Series Chapter 5: The Graphics User Interface (GUI) 5.6.9.1 Plot Positions Toolbar: , Menu bar: Windows -> Plot Positions The positions of X and Y peak and of X and Y centroid positions can be displayed vs. time. Toolbar Icon Associated Action Save Diagram or Image: Opens a dialog box to specify the properties of the saved diagram or image. -
Page 73: Plot Power
The total power measured by the Beam Profiler vs. time can be displayed. Note The power indication of Thorlabs Beam Profiler instruments is not calibrated vs. wavelength, it is based on a typical responsivity curve of the used sensor and the manually entered... -
Page 74: Plot Diameters
BC207 Series Chapter 5: The Graphics User Interface (GUI) 5.6.9.3 Plot Diameters Menu bar: Windows -> Plot Beam Diameters The Plot Diameters window displays the beam diameter over time as the user adjusts settings. This allows to easily monitor the behavior of the beam diameter. 5.6.9.4 Plot Gaussian Fit Menu bar: Windows ->... - Page 75 Save Data: Opens a dialog box to specify the properties of the saved calcu- lation data Clear all plots Show or Hide the grid in the diagram: Autoscale ON/OFF Show or hide the cursor Page 68 Rev: 8.1, 10-Jan-2022 © 2022 Thorlabs...
-
Page 76: Plot Orientation
BC207 Series Chapter 5: The Graphics User Interface (GUI) 5.6.9.5 Plot Orientation Menu bar: Windows -> Plot Orientation This window plots the orientation (in degrees) of the ellipse, see Calculation Results Toolbar Icon Associated Action Save Diagram or Image: Opens a dialog box to specify the properties of the saved diagram or image. -
Page 77: Plot Environment Data
Save Data: Opens a dialog box to specify the properties of the saved calcu- lation data Clear all plots Show or Hide the grid in the diagram Autoscale ON/OFF Show or hide the cursor Page 70 Rev: 8.1, 10-Jan-2022 © 2022 Thorlabs... -
Page 78: Beam Stability
BC207 Series Chapter 5: The Graphics User Interface (GUI) 5.6.9.7 Beam Stability , Menu bar: Windows g Beam Stability Toolbar: This feature allows the beam stability vs. time to be recorded in a very versatile way. Accumu- lated data are accessible from the graphic display by enabling several plots: Plots the trace of the centroid positions as a blue line Plots the most recent centroid position as yellow dot Plots the trace of the... - Page 79 The maximum number of data points to be displayed, the handling of data points after reaching the maximum and the time interval between two displayed data points is set in the menu Beam Settings / Plot over Time Parameter Page 72 Rev: 8.1, 10-Jan-2022 © 2022 Thorlabs...
-
Page 80: Operation Instructions
BC207 Series Chapter 6: Operation Instructions 6 Operation Instructions 6.1 Setup BC207 Series This chapter describes the setup for the BC207UV(/M) and BC207VIS(/M). Provide stable mounting of the Beam Profiler as described in the chapter Mounting BC207 Series Download the Beam Software version 8.0 or higher through the software tab on the BC207... -
Page 81: Operating The Instrument
For accurate measurement results (power values, M² results) the correct wavelength must be entered. Thorlabs Beam Profiler instruments are not calibrated for power with respect to the wavelength. The power calculation is based on a typical responsivity curve of the used sensor... - Page 82 BC207 Series Chapter 6: Operation Instructions The child window 2D Projection shows the measured intensity distribution across the sensor area in gray or color scale whereas the 3D Profile is plots the beam intensity with respect to the 3rd dimension (Z scale). Numerical calculation results are displayed in the appropriate Cal- culation Results window.
-
Page 83: Pass/Fail Test
- Minor axis diameter must be between Min. = 2600 and Max. = 2800 µm - Major axis diameter must be between Min. = 2600 and Max. = 2800 µm The test is passed only if both conditions are fulfilled. Page 76 Rev: 8.1, 10-Jan-2022 © 2022 Thorlabs... -
Page 84: Save Measurement Results
Note A password can be entered only once and cannot be changed! In case of troubles, please con- tact Thorlabs for a solution. Load / Save Test Parameter Configuration. The Load and Save buttons in the Calculation Results toolbar allow you to load and save the configuration of the pass/fail test. -
Page 85: Export Device Data
For export to the TIFF format, the camera image is reduced, similar to the *.bmp, to 8bit and saved to the RGB channels, resulting in a 24 bit image. TIFF images are loss-free compressed. Page 78 Rev: 8.1, 10-Jan-2022 © 2022 Thorlabs... - Page 86 BC207 Series Chapter 6: Operation Instructions *.png The PNG format is based on a loss-free compression. PNG uses four channels - RGB and the alpha channel that comprises the transparency information (here: white =255 for each pixel). For this reason, PNG are compressed 32 bit images. *.jpg JPEG images are lossly compressed 24bit images.
- Page 87 Intensity values are saved to a text matrix with a header: The 1st value in the 1st line of the matrix represents the intensity of the left upper pixel in the 2D Projection. Page 80 Rev: 8.1, 10-Jan-2022 © 2022 Thorlabs...
-
Page 88: Print Windows
BC207 Series Chapter 6: Operation Instructions Sequential Saving The export of measurement data described above can be repeated sequentially using the Sequential Saving feature on the bottom of the Export Device Data panel. This feature gener- ates one single file per data set, with extending the file name created by appending an incre- mented index. -
Page 89: Save Test Protocol
The results of the measurement are saved to a compact test protocol. It contains the Beam Profiler data and settings and selected numerical calculation results . If the 2D Projection and the 3D Profile windows were activated, these plots will also be included. Page 82 Rev: 8.1, 10-Jan-2022 © 2022 Thorlabs... -
Page 90: Beam Quality (M²) Measurement
BC207 Series Chapter 6: Operation Instructions 6.3 Beam Quality (M²) Measurement The Beam Quality panel can be opened from the menu bar (Menu Windows) or by clicking icon in the tool bar. 6.3.1 General The M² value is an important measure of the beam quality. It is widely used in the laser industry as a specification, and its method of measurement is defined in the ISO 11146 standard. - Page 91 Beam Profiler does not provide a correct information about the beam quality. Although a single Beam Profiler result is not a measure of beam quality, the Thorlabs Camera Beam Profiler Series can be used to accurately measure the beam quality. For this purpose, a beam propagation measurement is carried out according to the ISO11146 standard.
-
Page 92: M2Ms Operating Principle
For more information about pulsed laser sources read chapter Trigger 6.3.2 M2MS Operating Principle The Thorlabs M2MS M² Meter System is a compact instrument that includes all components re- quired to measure beam quality: Beam Profiler (not shown below) -
Page 93: Beam Diameter Requirements
The following diagram illustrates the requirements for the initial beam diameter de- pending on the wavelength and for M²=1 and M²=2 (lens with a focal length of 250 mm as de- livered with the M2MS system): BC106N Series Beam Diameter Requirements Page 86 Rev: 8.1, 10-Jan-2022 © 2022 Thorlabs... -
Page 94: M² Meter Extension Set
Chapter 6: Operation Instructions 6.3.4 M² Meter Extension Set The M² Meter Extension Set is an automated stage, compatible with all Thorlabs beam profilers of the BP209 and BC207 Series as well as the former BC106N Series, to scan through the light beam in the Z-axis for the beam profiler to acquire an M2 value. -
Page 95: M² Meter Set With Bc207 Series Camera Beam Profiler
BC207 Series Chapter 6: Operation Instructions 6.3.5 M² Meter Set with BC207 Series Camera Beam Profiler The BC207UV(/M) or BC207VIS(/M) in combination with the M2MS extension setup fea- tures: · Accurate M² Measurements · Measures Divergence, Waist Diameter, Rayleigh Range and Astigmatism ·... -
Page 96: Setup M2Ms
BC207 Series Chapter 6: Operation Instructions 6.3.6 Setup M2MS The M2MS Measurement System is factory aligned. The mounting adapter for the Beam Pro- filer provides a secure and reproducible positioning of the Beam Profiler's input aperture to the M2MS. This eases the mechanical setup. Note It is strongly recommended to fix the M2MS properly to the optical table using the four rail clamps that are included in the M2MS Accessory Box. - Page 97 4. Push the platform to the left stop, turn the lock counterclockwise and tighten the lock screw. 5. Place back the top cover and fix it using the 4 screws. Now, the M2MS is ready for trans- portation. Page 90 Rev: 8.1, 10-Jan-2022 © 2022 Thorlabs...
-
Page 98: Mounting The Beam Profiler
BC207 Series Chapter 6: Operation Instructions 6.3.6.1 Mounting the Beam Profiler Please mount your Beam Profiler as described above in chapter Mounting BC207 Series on M2MS(-AL) Page 91 MTN026962-D02... -
Page 99: Connecting M2Ms To The Pc
5. Connect the M2MS to the PC using the supplied 3 m long USB 2.0 cable; do not start the BEAM software yet. 6. The PC's operating system recognizes the connected new hardware and performs the driver installation: Page 92 Rev: 8.1, 10-Jan-2022 © 2022 Thorlabs... -
Page 100: M² Measurement
7. Start the Beam Software. It should automatically connect to the Beam Profiler and to the translation stage. This can be seen in the Beam Settings Panel: 8. Upon starting the Thorlabs Beam Software, the translation stage will be initialized and homed automatically. This means that it is recognized in the tab Stage Selection and moves to the 200 mm position in case it is not there yet. -
Page 101: Beam Alignment
6.3.7.1.1 Coarse Alignment For a coarse alignment, Thorlabs provides an alignment laser that is included with the access- ory box. For this step, the alignment laser is mounted on the M2MS in place of the Beam Pro- filer as described below. - Page 102 BC207 Series Chapter 6: Operation Instructions directed by the two mirrors of the stage into the center of the laser source aperture (see the drawing in section M2MS Operating Principle Warning Be careful when using the Alignment Laser! · Remove the Beam Profiler together with its mounting adapter from the M2MS base. ·...
- Page 103 BC207 Series Chapter 6: Operation Instructions Page 96 Rev: 8.1, 10-Jan-2022 © 2022 Thorlabs...
- Page 104 BC207 Series Chapter 6: Operation Instructions Explanation of indicators and icons Start the Alignment Wizard Start the Focusing Lens Alignment Wizard Z [mm] This box shows the actual stage position; after initialization = 200 mm. Position 1 (2) [mm] The left and right positions for the stage movement can be entered nu- merically.
- Page 105 2 - the centroid is captured, and its crosshair color changes to amber. As the actual beam centroid that is marked by a blue crosshair, is located at the same position, the resulting color is white: Page 98 Rev: 8.1, 10-Jan-2022 © 2022 Thorlabs...
- Page 106 BC207 Series Chapter 6: Operation Instructions Centroid captured at Position 2 · Click to the Position 1 capture button (0 mm). The stage moves to Position 1 and captures the second centroid position: Centroid captured at Position 1 · Now, the beam displacement and the pointing angle are displayed numerically. Page 99 MTN026962-D02...
- Page 107 The stage starts a loop move, dwelling at the stop po- sition for the given time. During the dwelling a realignment can be made. Please keep in mind, that the numeric alignment indicators are being updated only after the next move. Page 100 Rev: 8.1, 10-Jan-2022 © 2022 Thorlabs...
- Page 108 BC207 Series Chapter 6: Operation Instructions Alignment Move Loop · To terminate the loop, click the button. · After finishing, click Next to continue. Page 101 MTN026962-D02...
- Page 109 X-Y translators of the lens holder until the indicators are green or at least yellow. · Then click "Next" to finish the Focusing Lens Alignment. · Select if you want to continue with an M² measurement: Page 102 Rev: 8.1, 10-Jan-2022 © 2022 Thorlabs...
-
Page 110: M² Measurement Panel
BC207 Series Chapter 6: Operation Instructions 6.3.7.2 M² Measurement Panel This section concerns the M measurement and its settings. Click "M2 Measurement" in the Beam Quality Measurement window to enter the M Measurement section. The M² panel is divided into 6 subpanels: 1. - Page 111 Select in the header of this sub-panel the Number of the desired measured data point. For this selected point, the position of stage and the the 2D projection of the beam is displayed. The table Calculation Results of the Selected Point to the right contains the following information: Page 104 Rev: 8.1, 10-Jan-2022 © 2022 Thorlabs...
- Page 112 BC207 Series Chapter 6: Operation Instructions Parameter Explanation Position [mm] The actual Z position of the translation stage for the selected data point. Azimuth Angle [deg] For 4s beam widths the azimuth angle is the absolute azimuth angle, calculated in accordance with ISO11146-1 using 4s beam widths. Note that the rotation range is not identical with the Orientation used for the ellipse.
-
Page 113: M² Settings
Start to Stop positions (or vice versa depending on the position prior to start the measurement). The number of recorded beam widths equates exactly to the entered number of Data Points. Page 106 Rev: 8.1, 10-Jan-2022 © 2022 Thorlabs... - Page 114 BC207 Series Chapter 6: Operation Instructions The Normal Scan pursues an ISO compliant measurements. The ISO standard requires that "... at least 10 measurements shall be taken. Approximately half of the measurements shall be distributed within one Rayleigh Length on either side of the beam waist, and ap- proximately half of them shall be distributed beyond two Rayleigh Lengths from the beam waist."...
- Page 115 Please be aware of the fact that ambient light correction is disabled any time the Beam Soft- ware is started and/or the settings for attenuation (filter wheel) are changed in the software. Page 108 Rev: 8.1, 10-Jan-2022 © 2022 Thorlabs...
-
Page 116: Saving The M² Measurement Results
Chapter 6: Operation Instructions 6.3.7.4 Saving the M² Measurement Results Besides the standard function "Save M² Test Results " the Thorlabs Beam Software offers an automatic saving of beam profile data when an M² measurement is executed. 6.3.7.4.1 Saving M² Test Results The beam quality measurement results can be saved in two different ways: 1. - Page 117 GUI appears as The Data Export remains active until Disable is checked. If the data shall be saved only once, please check the boxes Page 110 Rev: 8.1, 10-Jan-2022 © 2022 Thorlabs...
- Page 118 BC207 Series Chapter 6: Operation Instructions Select Disable after next measurement to stop the automatic export after the first run of the M² measurement. Page 111 MTN026962-D02...
- Page 119 Followed by individual time stamp and automatic index of the appropri- ate stage position M² / Divergence Measurement Results prefix with date, time and manual index "Results" stands for M² test results Page 112 Rev: 8.1, 10-Jan-2022 © 2022 Thorlabs...
-
Page 120: Running The M² Measurement
BC207 Series Chapter 6: Operation Instructions 6.3.7.5 Running the M² Measurement Prior to starting a measurement, make sure that the following conditions are fulfilled: · The beam is aligned properly - it should ideally remain centered with respect to the sensor center over the entire scan range. -
Page 121: M² Measurement Results
Furthermore, the M² value for X' is independent from the one for Y'. For highly elliptical beams, such as those from semiconductor lasers, M X' and M Y' will differ much more than in this example. Diagram Legend Beam Diameter X' Beam Diameter Y' Hyperbolic Fit X' Page 114 Rev: 8.1, 10-Jan-2022 © 2022 Thorlabs... - Page 122 BC207 Series Chapter 6: Operation Instructions Hyperbolic Fit Y' These values can also be found in the listing of the complete results next to the diagram: M² X' and M² Y' are the M² value for X' / Y' axis, calculated from the hyperbolic fit of the meas- ured data points.
- Page 123 1.0 indicate that the beam ellipticity is changing with Z position, for instance when an ellip- tical beam is focussed to a round spot. Note All results are calculated from the applied fit! Page 116 Rev: 8.1, 10-Jan-2022 © 2022 Thorlabs...
- Page 124 BC207 Series Chapter 6: Operation Instructions Display the Results at a Certain Z Position After measurement is finished, the calculated beam diameter, the beam centroid positions (X' and Y'), and the beam ellipticity as well as azimuthal angle can be retrieved for a certain Z posi- tion from the diagram.
- Page 125 Hyperbolic Fit Reference Y' Clicking to the Clear icon deletes the reference data. Please refer to section Saving M² Test Results for details about how to save the results of the beam quality measurement. Page 118 Rev: 8.1, 10-Jan-2022 © 2022 Thorlabs...
-
Page 126: M² Troubleshooting
BC207 Series Chapter 6: Operation Instructions 6.3.7.7 M² Troubleshooting Below are examples of typical problems that may occur and appropriate recommendations for resolving them. q The beam does not hit the sensor at all positions of the stage. Perform a proper Beam Alignment q A timeout error occurs during a measurement. - Page 127 · Rule of the thumb: the beam diameter variation within the scan range should not run be- low a ratio of 1:2.5 at least at one side of the beam waist - see the example below. Page 120 Rev: 8.1, 10-Jan-2022 © 2022 Thorlabs...
- Page 128 BC207 Series Chapter 6: Operation Instructions qError message "The measurement is not ISO compliant, because there are not enough data points inside the Rayleigh Length X (Y)(xx mm) or beyond twice the Rayleigh Length" · The software could not measure with the required resolution. ·...
-
Page 129: Live Adjustment
Panel of this window opened through the icon on the left. Centroid Position: The Centroid position is displayed to maintain knowledge of the beam posi- tion during adjustment. Adjustment in Z is facilitated by the slider on the bottom right. Page 122 Rev: 8.1, 10-Jan-2022 © 2022 Thorlabs... -
Page 130: Divergence Measurement
In most cases the light source is a device with open beam output. In order to direct the beam under test into the M2MS, a combination of two adjustable mirrors is required, Thorlabs offers a variety of such items. The beam alignment is executed in 2 steps, guided by a software wizard:... - Page 131 : Determine the correct location of the Laser Under Test output aperture by means of an auxiliary laser (included). Fine Alignment of the Laser Under Test for minimum beam displacement and pointing angle. Page 124 Rev: 8.1, 10-Jan-2022 © 2022 Thorlabs...
- Page 132 Chapter 6: Operation Instructions 6.3.8.1.1 Coarse Alignment For a coarse alignment, Thorlabs provides an alignment laser that is included with the access- ory box. For this step, the alignment laser is mounted on the M2MS in place of the Beam Pro- filer as described below.
- Page 133 BC207 Series Chapter 6: Operation Instructions Page 126 Rev: 8.1, 10-Jan-2022 © 2022 Thorlabs...
- Page 134 BC207 Series Chapter 6: Operation Instructions Explanation of indicators and icons Start the Alignment Wizard Start the Focusing Lens Alignment Wizard Z [mm] This box shows the actual stage position; after initialization = 200 mm. Position 1 (2) [mm] The left and right positions for the stage movement can be entered nu- merically.
- Page 135 2 - the centroid is captured, and its crosshair color changes to amber. As the actual beam centroid that is marked by a blue crosshair, is located at the same position, the resulting color is white: Page 128 Rev: 8.1, 10-Jan-2022 © 2022 Thorlabs...
- Page 136 BC207 Series Chapter 6: Operation Instructions Centroid captured at Position 2 · Click to the Position 1 capture button (0 mm). The stage moves to Position 1 and captures the second centroid position: Centroid captured at Position 1 · Now, the beam displacement and the pointing angle are displayed numerically. Page 129 MTN026962-D02...
- Page 137 The stage starts a loop move, dwelling at the stop po- sition for the given time. During the dwelling a realignment can be made. Please keep in mind, that the numeric alignment indicators are being updated only after the next move. Page 130 Rev: 8.1, 10-Jan-2022 © 2022 Thorlabs...
- Page 138 BC207 Series Chapter 6: Operation Instructions Alignment Move Loop · To terminate the loop, click the button. · After finishing, click Next to continue. Page 131 MTN026962-D02...
-
Page 139: Divergence Measurement Panel
The buttons Beam Diameter X' (Y') enable / disable the display of the measured data at the individual positions. The buttons Divergence Fit X' (Y') enable / disable the curve fit to the measured data points. Page 132 Rev: 8.1, 10-Jan-2022 © 2022 Thorlabs... - Page 140 BC207 Series Chapter 6: Operation Instructions After the measurement is finished, below the diagram the Divergence results for the X and Y axes are displayed. The indicator to the left shows if the measurement was successful. The red marked button between the toolbar and the diagram expands the diagram over the entire Divergence window.
- Page 141 BC207 Series Chapter 6: Operation Instructions · Delay Line: Measurement range (difference between Start and Stop positions) · Wavelength setting (not relevant for divergence calculation) Page 134 Rev: 8.1, 10-Jan-2022 © 2022 Thorlabs...
-
Page 142: Divergence Measurement Settings
BC207 Series Chapter 6: Operation Instructions 6.3.8.3 Divergence Measurement Settings For a successful and reliable measurement, the appropriate measurement settings are essen- tial. Click to to enter the Divergence Measurement Settings. Beam Width The Beam Width calculation is based on an ellipse-based approximation with two possible clip levels. -
Page 143: Saving The Divergence Measurement Results
(filter wheel) are changed in the software. 6.3.8.4 Saving the Divergence Measurement Results Besides the standard function "Save Divergence Measurement Results" the Thorlabs Beam Software offers an automatic saving of beam profile data when a Divergence measurement is executed. -
Page 144: Divergence Measurement Results
BC207 Series Chapter 6: Operation Instructions While running the measurement, most of the buttons and options are disabled, e.g. the Diver- gence measurement settings and the toolbar. This prevents the modification of settings during a measurement. If necessary, the measurement can interrupted by clicking the Stop button After starting the measurement the X axis of the graph is adapted to the user-defined scan range, for example from 0 to 120 mm. - Page 145 BC207 Series Chapter 6: Operation Instructions Reference Measurement The actual measurement results can be saved and used as reference afterwards, same as for M² Measurement Results Page 138 Rev: 8.1, 10-Jan-2022 © 2022 Thorlabs...
-
Page 146: Live Adjustment
BC207 Series Chapter 6: Operation Instructions 6.3.8.7 Live Adjustment As for the M Measurement, the Divergence Measurement Panel also offers the option for a Live Adjustment of the laser system. Open the Live Adjustment panel and click "start" to move the M2 stage to the lens focus plane as calculated from the inserted parameters. -
Page 147: M² Theory
Rayleigh Length is given by Thus the product of the minimum diameter of a Gaussian beam (at waist) and the divergence angle (AKA 'Beam Parameter Product', BPP) is constant for a given wavelength: Page 140 Rev: 8.1, 10-Jan-2022 © 2022 Thorlabs... - Page 148 BC207 Series Chapter 6: Operation Instructions For mode mixture (MM) beams, i.e. beams which feature higher order modes than just the fundamental mode TEM , the product of beam diameter and divergence increases by a factor of M². Finally, the times-diffraction-limit factor M is calculated by The Rayleigh Length is now given by The reciprocal of the times-diffraction-limit factor M...
- Page 149 BC207 Series Chapter 6: Operation Instructions The appropriate power density at z is reduced by a factor (M²)². Also the Rayleigh Length increases by a factor of M². Page 142 Rev: 8.1, 10-Jan-2022 © 2022 Thorlabs...
-
Page 150: Write Your Own Application
In order to fully support 64 bit LabView version, the installation package provides two installer components, the 32bit and the 64bit component: · Windows 8.1 (32/64 bit) and Windows 10 (32/64 bit): Install "Thorlabs Beam VXIpnp In- strument Driver (32bit)"... -
Page 151: Bit Operating System
(LabVIEW container file with driver vi's and an example. "LabVIEW xxxx" stands for actual LabVIEW installation folder.) .net wrapper dll C:\Program Files\Microsoft.NET\Primary Interop Assemblies… …\ Thorlabs.TLBC2_32.Interop.dll C:\Program Files\IVI Foundation\VISA\VisaCom\… …\Primary Interop Assemblies\ Thorlabs.TLBC2_32.Interop.dll Python wrapper C:\Program Files\IVI Foundation\VISA\WinNT\TLBC2\Examples\Python\TLBC2.py Example for C Project file: C:\Program Files\IVI Foundation\VISA\WinNT\ TLBC2\Examples\…... - Page 152 BC207 Series Chapter 7: Write Your Own Application C:\Program Files\IVI Foundation\VISA\WinNT\TLBC2\Examples\… … CVI C Sample\sample.c Page 145 MTN026962-D02...
- Page 153 C:\Program Files\National Instruments\LabVIEW xxxx\Instr.lib\TLBC2… …\TLBC2.llb (LabVIEW container file with driver vi's and an example. "LabVIEW xxxx" stands for actual LabVIEW installation folder.) Example for Python Solution File: Python wrapper C:\Program Files\IVI Foundation\VISA\WinNT\TLBC2\Examples\Python\TLBC2_Sample.py Page 146 Rev: 8.1, 10-Jan-2022 © 2022 Thorlabs...
-
Page 154: Bit Operating System
BC207 Series Chapter 7: Write Your Own Application 7.2 64 bit Operating System Note According to the VPP6 (Rev6.1) Standard the installation of the 64 bit VXIpnp driver includes the WINNT, WIN64, GWINNT and GWIN64 frameworks. That means, that the 64 bit driver includes the 32 bit driver as well. - Page 155 BC207 Series Chapter 7: Write Your Own Application .net wrapper dll C:\Program Files (x86)\Microsoft.NET\Primary Interop Assemblies… …\ Thorlabs.TLBC2_32.Interop.dll C:\Program Files (x86)\IVI Foundation\VISA\VisaCom\… …\Primary Interop Assemblies\ Thorlabs.TLBC2_32.Interop.dll C:\Program Files\IVI Foundation\VISA\VisaCom64\… …\Primary Interop Assemblies\ Thorlabs.TLBC2_64.Interop.dll Python wrapper C:\Program Files (x86)\IVI Foundation\VISA\WinNT\TLBC2\Examples\Python\TLBC2.py Example for C Project file: C:\Program Files (x86)\IVI Foundation\VISA\WinNT\ TLBC2\Examples\…...
-
Page 156: Maintenance And Repair
Do not remove covers! 8.1 Version and Other Information The menu entry Help à About Thorlabs displays relevant Beam Software data. In case of a support request, please submit the software version of the application. This will help to locate the error. -
Page 157: Troubleshooting
· You may have activated the 'Software Trigger' mode but the 'Min. Image Saturation' limit is not reached. Increase Exposure Time or even Gain to achieve a sufficiently high pulse intensity. Page 150 Rev: 8.1, 10-Jan-2022 © 2022 Thorlabs... - Page 158 BC207 Series Chapter 8: Maintenance and Repair · The 'Hardware Trigger' mode may be activated but no TTL trigger pulse is launched into the BNC input jack. Provide a trigger signal. q Menu, toolbar and setting controls react slowly · The performance of your PC's graphics adapter may be too poor. Particularly, the 3D Pro- file window is resource-consuming at high resolution, which can decrease its update rate significantly.
-
Page 159: Warnings And Errors
Filter Wheel . You may also cascade two filters. If Exposure Control is set to Auto, a short appearance of this error is harmless as Exposure Time and Gain will be adjusted automatically. Page 152 Rev: 8.1, 10-Jan-2022 © 2022 Thorlabs... - Page 160 BC207 Series Chapter 8: Maintenance and Repair q Power too low! Explanation The brightest pixel values fall below 10% of the available saturation range. This means that 90% of the available dynamic range remains unused. This causes a digitizing noise that increases the measurement noise. Resolving Increase Exposure Time and Gain settings or increase the beam intensity using a lower attenuation ND filter of the...
-
Page 161: Application Note
In the following sections detailed explanations are given to the measured parameters. 9.1 Ambient Light Correction Thorlabs Beam Software implements a unique Ambient Light Correction (ALC) method. The procedure can be started from the Beam Settings panel, topic "Optical Setup ". - Page 162 BC207 Series Chapter 9: Application Note Note The 4s Beam Width measurement is not in conformity with ISO11146! In accordance with ISO11146-3, beam diameters shall be defined at a 1/e² clip level for Slit Beam Profilers, while for Camera Beam Profilers the 4sX' and 4sY' beam widths apply. Transformed Coordinate system According to ISO11146-1, the second moment beam widths are calculated in the transformed coordinate system that follows the elliptical fit (4sX' and 4sY' beam width).
-
Page 163: Ellipse (Fitted)
The beam shape is fit to an ellipse using the set clip level. Diameter (clip level) is given for the minor axis (min), major axis (max) and their arithmetic mean value. Ellipticity and Eccentricity of the beam are defined in ISO 11146-1 as Page 156 Rev: 8.1, 10-Jan-2022 © 2022 Thorlabs... -
Page 164: X-Y-Profile Measurement
BC207 Series Chapter 9: Application Note with d = minor axis and d = major axes of the approximated beam ellipse. Orientation denotes the angle q between the major ellipse axis and the horizontal X axis. Range: -90° < q 90°. -
Page 165: Bessel Fit
The output of some step index fibers can also have a profile close to a Bessel beam. The Bessel fit approximates a given beam profile to a Bessel function distribution. Page 158 Rev: 8.1, 10-Jan-2022 © 2022 Thorlabs... -
Page 166: Appendix
BC207 Series Chapter 10: Appendix 10 Appendix 10.1 Technical Data BC207x Item # BC207UV(/M) BC207VIS(/M) Camera Beam Profiler Specifications Wavelength Range 350 - 1100 nm 245 - 400 nm 2,3) 3,4) Power Range 20 fW - 1 W 40 fW - 1 W Beam Diameter 20 µm - 7.0 mm... - Page 167 10. This is the safe upper limit of the mean pulse power for the beam profiler. These filters are provided for use near the 400 nm upper wavelength range of the BC207UV(/M). See the chapter Filter Wheel for more information.
-
Page 168: Dimensions Bc207Uv(/M) And Bc207Vis(/M)
BC207 Series Chapter 10: Appendix 10.2 Dimensions BC207UV(/M) and BC207VIS(/M) The outer dimensions of all BC207 Series models are identical. Thei only differ by the protec- tion glass (US or VIS) and the filters in the filter wheel. Metric and imperial version have 1/4''-20 tapped mounting holes while metric devices have M6 x 1.0 tapped mounting holes. -
Page 169: Filter Wheel
60 dB Absorptive ND Filter, AR-Coated: 350-700 nm NE20B-B 20 dB Absorptive ND Filter, AR-Coated: 650-1050 nm NE40B-B 40 dB Absorptive ND Filter, AR-Coated: 650-1050 nm NE60B-B 60 dB Absorptive ND Filter, AR-Coated: 650-1050 nm Page 162 Rev: 8.1, 10-Jan-2022 © 2022 Thorlabs... -
Page 170: Technical Data M2Ms Extension Sets
BC207 Series Chapter 10: Appendix 10.4 Technical Data M2MS Extension Sets Item # M2MS M2MS-AL M2MS Extension Set General Specifications Wavelength Range 400-2700 nm 250-600nm Beam Profiler Compatibility BC207 series, BP209 series Translation Stage DDS100/M Travel Range 100mm Velocity (Max) 500 mm/s Effective Translation 200 mm, -100 mm to +100 mm from Focal Point... -
Page 171: Power Ranges
(40 dB for BC207UV; 60 dB for BC207VIS). With other filter settings, the power range is located between unbroken and dashed lines. -
Page 172: Initial Settings
Electrical connections and mechanical setup should be carried out as described in the appropri- ate documentation to this hardware, while operation is described in the manual on hand. Older documentation can be downloaded from the Thorlabs Manual Archive at www.thor- labs.com/manuals.cfm. -
Page 173: List Of Acronyms
Beam Profiler Camera Calculation Area Continuous Wave (constant power source) Graphical User Interface Neutral Density Personal Computer Frames Per Second Region Of Interest USB Universal Serial Bus Ultra Violet (wavelength range) VISible (wavelength range) Page 166 Rev: 8.1, 10-Jan-2022 © 2022 Thorlabs... -
Page 174: Safety
The instrument must only be operated with a duly shielded and low resistance USB cable de- livered by Thorlabs. Only with written consent from Thorlabs may changes to single components be carried out or components not supplied by Thorlabs be used. -
Page 175: Certifications And Compliances
BC207 Series Chapter 10: Appendix 10.11 Certifications and Compliances Page 168 Rev: 8.1, 10-Jan-2022 © 2022 Thorlabs... -
Page 176: Return Of Devices
10.14 Warranty Thorlabs warrants material and production of the BC207 Series for a period of 24 months start- ing with the date of shipment in accordance with and subject to the terms and conditions set forth in Thorlabs’ General Terms and Conditions of Sale which can be found at: General Terms and Conditions: https://www.thorlabs.com/Images/PDF/LG-PO-001_Thorlabs_terms_and_%20agreements.pdf... -
Page 177: Thorlabs Worldwide Contacts
EC, and are not dissembled or contaminated. Contact Thorlabs for more informa- tion. Waste treatment is your own responsibility. “End of life” units must be returned to Thorlabs or handed to a company specializing in waste recovery. Do not dispose of the unit in a litter bin or at a public waste disposal site. - Page 178 BC207 Series Chapter 10: Appendix Index Device Selection 14, 74 Divergence Angle Divergence Assymetry Divergence Display Divergence Measurement 123, 136 12 bit Divergence Results 2D Projection Divergence Settings 3D Profile Driver Installation 8 bit Duster Spray Accessories Eccentricity Acronyms Ellipse fit AD Saturation Ellipticity Ambient Light Correction...
- Page 179 Plot Power USB Hub Plots USB to Serial converter Power Correction User Filter Power ranges Power too high Power too low Version and other Precision Mode Informations 31, 74 Preview Image Program Start Page 172 Rev: 8.1, 10-Jan-2022 © 2022 Thorlabs...
- Page 180 BC207 Series Chapter 10: Appendix Waist Assymetry Waist diameter Warnings Wavelength 31, 74, 140 Wavelength Dependent Loss of VIS ND Filters Wavelength Dependent Reflectance of AR Coating on UV ND Filters Wavelength Dependent Sensitivity Wavelength Range Wavelength Response X / Y Profile Page 173 MTN026962-D02...
- Page 181 www.thorlabs.com...
Need help?
Do you have a question about the BC207UV and is the answer not in the manual?
Questions and answers