
Subscribe to Our Youtube Channel
Related Manuals for Siemens SITRANS F FS200 Utility


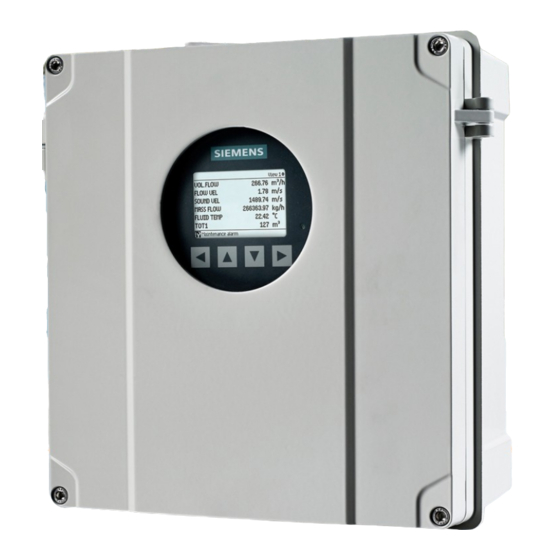
Summary of Contents for Siemens SITRANS F FS200 Utility
- Page 1 Introduction Installation Connecting SITRANS F Setup Screens Ultrasonic Flowmeters Diagnostic Screens Utility Screens FS200 Utility Programming Manual...
- Page 2 Note the following: WARNING Siemens products may only be used for the applications described in the catalog and in the relevant technical documentation. If products and components from other manufacturers are used, these must be recommended or approved by Siemens. Proper transport, storage, installation, assembly, commissioning, operation and maintenance are required to ensure that the products operate safely and without any problems.
-
Page 3: Table Of Contents
Table of Contents Introduction ..............................5 1.1 Basic Requirements .........................5 1.2 Error Messages........................5 Installation ..............................6 2.1 FS200 Utility Download and Installation ...................6 Connecting ..............................7 3.1 FS200 Utility Communications Setup..................7 3.2 FS200 to Flowmeter Communications Setup ................8 Setup Screens ............................10 4.1 File Menu..........................10 4.2 Language Menu........................11 4.3 Setup Menu..........................12... - Page 4 Table of Contents Figures Figure 3-1 Communication Settings ..…......................7 Figure 3-2 Connection Status .........................7 Figure 3-3 Error Message ..........................9 Figure 4-1 File Menu ............................10 Figure 4-2 Print Setup ..........................11 Figure 4-3 Language Menu ..........................11 Figure 4-4 Setup Selection ...........................12 Figure 4-5 Pass / Fail Limits .........................12...
-
Page 5: Introduction
Siemens equipment. It allows you to connect your PC to your flowmeter simply and directly. You will find that the utility is very intuitive and simple to use, making it a useful tool for managing your Siemens ultrasonic flowmeters. -
Page 6: Installation
Installation 2.1 FS200 Utility Download and Installation The FS200 utility package (FS200_sizing_software.zip) can be accessed and downloaded from the Siemens (SIOS) website at this location: https://support.industry.siemens.com/cs/document/109762612/fs200-clamp-on-utility- software-for-sitrans-fs230-fs220-flowmeters?dti=0&lc=en-US Installation and use of the utility is quite simple. Please perform the following steps to install your Siemens FS200 software: 1. -
Page 7: Connecting
Connecting 3.1 FS200 Communications Setup 1. Connect the appropriate USB cable between the flowmeter and any available USB port on the PC. 2. Turn on power to the flowmeter if it is not already powered up 3. Make sure to note what port number your PC assigns to this connection. If necessary, access the Control panel / System / Device manager of your PC to verify the port assignment 4. -
Page 8: Fs200 To Flowmeter Communications Setup
Connecting 3.2 FS200 to Flowmeter Communications Setup 1. Launch the FS200 Utility program (if not already running). 2. On the FS200 Menu bar, use your mouse to click on the [Connection] function, then again to select [Connect]. this will open the dialogue box illustrated below. Figure 3-2 Connection Status 3. -
Page 9: Figure 3-3 Error Message
CCCCCCCCCC Connecting Note If communication cannot be established with the flowmeter, a pop-up error message will appear stating [No Response from Meter] or if the meter responds incorrectly an [Expected Data Not Received] error message will appear. If either of these messages appear you should verify proper communication settings (EG Port selection) in the FS200 program. -
Page 10: Setup Screens
Setup Screens This section provides a detailed description of each FS200 configuration menus and their function. The screens can be accessed by clicking on the appropriate Menu Tab at the top of the FS200 main page. If you are not familiar with certain terminology and their definitions refer to the glossary for clarification. -
Page 11: Language Menu
Setup Screens Print Setup Menu The [Print Setup] menu is used to select a printer to print out FS200 menu-screen data. When selected, the [Print Setup] menu appears and allows the user to select a desired default printer and configure the printer properties. Figure 4-2 Print Setup Exit Selecting the [Exit] button will close the FS200 utility program. -
Page 12: Setup Menu
Setup Screens 4.3 Setup Menu The [Setup] menu consists of two sub-menus: ● Communications ● Pass/Fall Limits Figure 4-4 Setup Selection Note The [Pass/Fail Limits] menu appears only after a connection to the flowmeter has been established via the [Connection] and [Connect] menus. Communications Setup Screen The [Communications Setup] screen is used to configure the FS200 utility communication protocol data for connection to the flowmeter. -
Page 13: Connection Screen
Setup Screens 4.4 Connection Screen The [Connection] screen where a communication link can be established between the FS200 program and the flowmeter and will indicate when the FS200 utility and the flowmeter are successfully connected and communicating. When a communication connection is completed "Connected"... -
Page 14: Diagnostic Screens
Diagnostic Screens Diagnostics Menu Access to the diagnostic screens is only available after a connection to the flowmeter has been established as described in section 3.2 The FS200 utility has two Diagnostic screens: Signal Graph and Meter Diagnostic, they are selected by clicking on [Diagnostics] in the FS200 menu bar. Figure 5-1 Diagnostics Menu 5.1 Signal Graph The Signal Graph screen allows you to view real-time digitized transducer receive... -
Page 15: Table 4-1 Signal Graph Selections
Diagnostic Screens To select the Signal Graph: Note To view a Signal Graph, first establish a flowmeter connection using the [Connection] and [Connect] menus, ensure the path to be viewed is actively operating and measuring flow rate or zero flow condition. 1. -
Page 16: Meter Diagnostics Menu
Diagnostic Screens 5.2 Meter Diagnostic Menu The FS200 Utility [Meter Diagnostics] screen displays real-time flowmeter diagnostic data and provides a Pass/Fall indication alerting the user of marginal or poor installation conditions. This screen also provides a useful [data capture] facility, which allows diagnostic data to be collected to a file on your PC (in ".csv"... - Page 17 Diagnostic Screens Evaluating and Controlling the Diagnostics Screen The diagnostic data screen presents a significant amount of valuable data for the purpose of both monitoring and evaluating system performance. The data presented, their descriptions and their expected values are outlined below. Process Values Flow Rate: Presents the actual (Gross) volumetric flow rate in the measurement units...
-
Page 18: Data Capture Utility
Diagnostic Screens 5.3 Data Capture Utility 1. The meter diagnostics screen continuously updates the presented data for all diagnostic parameters. This can be evidenced by the indication in the status bar “Gathering Data From Meter” 2. In addition to the above, the FS200 utility can “Capture” data in “.csv” files. The saved .csv files can be easily imported for later review and analysis in programs such as MS-Excel. -
Page 19: Figure 5-5 Data Capture Location
Diagnostic Screens To capture and record diagnostic data: 1. In the [Directory] field, type in the desired drive directory folder. The FS200 utility will create the selected folder if it does not exist. If no directory path is entered in this location, the capture file will be saved into the same directory where the FS200 program resides. -
Page 20: Figure 5-6 Data Capture Example
Diagnostic Screens Siemens Data Capture Log FS200 Utility Version 1.00.02 Long Tag Product S/N N1J4118000027 COMS Settings Baud:19200 Parity:None Data Bits:8 Location Identifier Meter Bore id 3.937 inches System Setup Parameters ------------------------------------------------------------------------------ Parameter Value Units Pipe Diameter 4.537 inches Pipe Wall Thickness 0.3 inches... -
Page 21: Table 5-1 Data Capture Summary Parameters
Diagnostic Screens for Path-2. 2. Refer to the Data Capture file heading list that provides the variable name and a short description of each column within the report. For convenience, the short variable name is provided above the first row of data. 3. -
Page 22: Utilities Menu
Utility Menu Screens Utilities Menu The Utilities menu has three sub-menus: ● AGA8 Calculations ● Clamp-On Gas Tool ● Clamp-On Liquid Tool Figure 6.1 Utility Menu Options 6.1 AGA8 Calculations Note AGA8 tables are used with gas flowmeters only. The [AGA8 Calculations] screen is used to generate AGA8 data values. It will enable the entry of gas composition mole fractions, along with base and actual temperature and pressure, to determine fundamental gas values such as theoretical speed of sound (VoS), Mass, and Enthalpy. -
Page 23: Creating Aga8 Table
Utility Screens 7. The FS200 Utility will compute and display a variety of pertinent gas characteristics Figure 6-2 Gas Characteristics screen 6.2 Creating an AGA-8 Table An AGA8 compensation table can be created in the FS200 Utility. When uploaded to the FS230 Gas Flowmeter, table data will facilitate standard volume correction based upon measured temperature and pressure over the complete range of your application. -
Page 24: Clamp-On Gas Tool
Utility Screens Figure 6-3 AGA8 Table Data The AGA8 table is comprised of two sections. The top section is a matrix of compressibility factors relative to temperature (vertical axis) versus pressure (Horizontal axis) across your specified application range. The lower section is a matrix of theoretical sound velocity relative to the same range of temperature and pressure. -
Page 25: Figure 6-4 Clamp-On Gas Sizing Tool
Click the [Calculate] button. The FS200 Clamp-On gas tool will compute the recommended sensor type and size for your specified pipe. Typically, only High Precision sensors are suitable for gas applications and will be the primary selection. The tool will also provide sensor mounting mode and spacing information. -
Page 26: Figure 6-6 Gas Installation Calculations
Utility Screens Installation Calcs. Tab Click on the [Installation Calcs] tab for application specific information pertinent to the installation of your flow sensors, including spacing recommendation and spacing offset (LTN) along with minimum pressure requirements. Additionally, fundamental data relative to transit-time values, signal phase shift cycles (useful for beam-blowing evaluation), and flow range limits are also presented in this view Figure 6-6 Gas Installation Calculations Repeatability Graph Tab... -
Page 27: Table 6-1 Typical Gas Application Problems
Utility Screens Application Problems Tab 1. If any of your entered application parameters conflict with performance capabilities of the FS230 flowmeter an “Application Problem” message will appear at the bottom of the sizing screen; this will cause an additional tab to open [Application Problems] (See Figure 6-8 below). -
Page 28: Figure 6-9 Aga8 Selection
Utility Screens Gas Composition and Mole % Sizing Screen If desired, your actual gas composition can be utilized for sensor sizing instead of one of the default gasses in the drop-down menu. The following steps describe how to display a [Gas Composition and Mole Fraction %] entry screen in the sizing tool. -
Page 29: Clamp-On Liquid Tool
Utility Screens 6.4 Clamp-On Liquid Tool The [Liquid Sensor Selection and Sizing Tool] screen allows the user to specify units of measure, pipe dimensional data, liquid type, along with nominal values for flow range, and temperature range. These values are used by the sizing tool to calculate the recommended sensor selection (type and size) along with the recommended sensor installation methods. -
Page 30: Figure 6-12 Liquid Sensor Type Size
Utility Screens Sensor Selection 1. Liquid applications can be serviced by any of 3 sensor types as follows; High Precision: The primary choice for steel pipes ∂ Universal: For all non-steel and plastic pipes ∂ High Temperature: For all pipes with temperatures between 250 – 450F ∂... -
Page 31: Figure 6-14 Liquid Repeatability Data
Utility Screens Repeatability Graph Tab The [Repeatability Graph] tab provides performance data relative to the estimated repeatability of your flowmeter over your specified flow range. Additionally, it provides specifications for Reynolds number (Nr) transitional-flow start / end based on pipe dimensions, viscosity and flow range. -
Page 32: Table 6-2 Typical Liquid Application Problems
Utility Screens A list of possible application conflicts and corrective actions appear in Table 6-2 below. Application Warning Corrective Action Maximum Pipe Diameter Exceeded Select larger (Universal) sensor Pipe diameter too small for selected sensor. Allow FS200 to specify sensor Flow velocity exceeds limit of installation. - Page 33 FS200 Programming Manual, 03/2020, A5E02951525-AB...
-
Page 34: Glossary
Glossary % Accepted Percentage of all acoustic transmit/receive signals used for flow measurement analysis. 100% is perfect. If application conditions such as aeration or noise interference are present this number may decrease. AGA-8 The AGA8 function is used to calculate the compressibility factor of natural gas and related hydrocarbon gases. - Page 35 Glossary [Signal to Noise Ratio]. Represents a measure of SNR of the digitized acoustic receive signal. Higher is better, typically values above 20 are desirable. Status Error code that is triggered by instantaneous acoustic signal problems. A "Measurement" Status indicates that the meter is satisfied with the acoustic receive signal and producing proper flow measurement readings.
- Page 36 Printed in the USA However, the information in this publication is Harleysville, PA reviewed regularly and any necessary correctrions are © Siemens AG 03.2020 included in subsequent editions. Responsibility for suitability and intended use of this instrument rests solely with the user.
Need help?
Do you have a question about the SITRANS F FS200 Utility and is the answer not in the manual?
Questions and answers