Table of Contents
Advertisement
Quick Links
Advertisement
Table of Contents

Related Manuals for Anritsu IQ Fiber Master


Summary of Contents for Anritsu IQ Fiber Master
- Page 1 User Guide IQ Fiber Master™ Analyzer MX280020A LTE RF over CPRI and PIM over CPRI Anritsu Company Part Number: 10580-00467 490 Jarvis Drive Revision: A Morgan Hill, CA 95037-2809 Published: March 2020 Copyright 2020 Anritsu Company, USA. All Rights Reserved. http://www.anritsu.com...
- Page 2 Notice Anritsu Company has prepared this manual for use by Anritsu Company personnel and customers as a guide for the proper installation, operation, and maintenance of Anritsu Company equipment and computer programs. The drawings, specifications, and information contained therein are the property of Anritsu Company, and any unauthorized use ...
-
Page 3: Table Of Contents
Installation of IQ Fiber Master Control Software ....... . . - Page 4 TOC.fm IQ Fiber Master User Guide Chapter 3 — Making LTE RF over CPRI Measurements (Option 752) Preparing the Site’s Details (Site Editor)......... . 3-1 Auto-detect a Site’s Configuration .
- Page 5 IQ Fiber Master User Guide TOC.fm Chapter 5 — PIM Analytics (Option 755) PIM vs Time (Long-term Monitoring) ..........5-1 Events..
- Page 6 TOC.fm IQ Fiber Master User Guide Contents-4 PN: 10580-00467 Rev. A MT2780A UG...
-
Page 7: Chapter 1 - Introduction To Iq Fiber Master
Anritsu Company has been advised of the possibility of such damages. Because some states and jurisdictions do not allow the exclusion or limitation of liability for consequential or incidental damages, the above limitation may not apply to you. - Page 8 1-2 Warranty IQ Fiber Master User Guide PN: 10580-00467 Rev. A MT2780A UG...
-
Page 9: Chapter 2 - Installation And Iq Fiber Master Basics
Installation of the IQ Fiber Master Control Software (MX280020A) This guide helps those personnel familiar with computers and test and measurement equipment to understand the IQ Fiber Master sensor, tap, and accompanying software, and to understand detecting and locating PIM. Requirements Ensure that the computer (laptop, desktop, or tablet) meets these minimum requirements: •... -
Page 10: Iq Fiber Master Basics
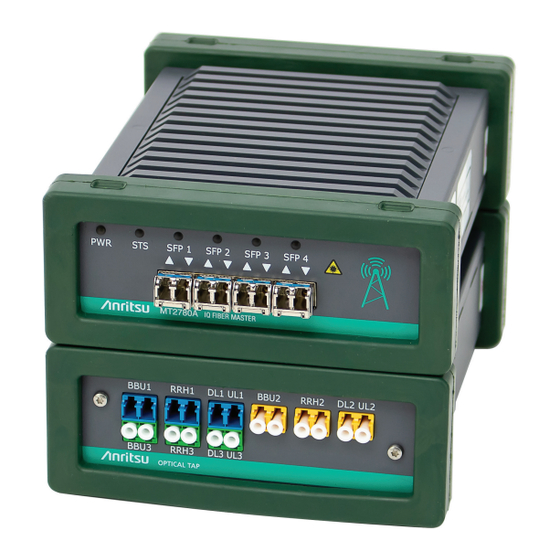
Some app features require options 752, 754, or 755. IQ Fiber Master Basics This section gives quick instructions in setting up and using the IQ Fiber Master sensor. Sensor and Tap Ports This diagram locates the ports on the sensor and the tap. -
Page 11: Connecting The Iq Fiber Master
Connecting the IQ Fiber Master To connect the IQ Fiber Master: 1. Connect computer to the Web. 2. Connect an Ethernet cable from computer to the IQ Fiber Master sensor, (1) in Figure 2-2. You may also use an Ethernet hub to connect the computer to the sensor. Local IT might have restrictions regarding this scheme. - Page 12 2-2 IQ Fiber Master Basics IQ Master User Guide 6. Press Connect. Figure 2-4. Connecting IQ Fiber Master 7. Sensor and SFP statuses are shown in the bottom bar. See “Status Line” on page 2-34 for more about status. Figure 2-5.
-
Page 13: Preliminary Configuration Checking
1. Connect to the Fiber Master sensor. See “Connecting the IQ Fiber Master” on page 2-3. 2. Load a Site configuration file into the Site Editor tab. -
Page 14: Final Configuration Checking
2-2 IQ Fiber Master Basics IQ Master User Guide Final Configuration Checking After the preliminary configuration check and the fiber connections are complete, the system is ready for the final configuration check. To final-check a configuration: 1. Select Config Check test. -
Page 15: Connecting To The Tap
IQ Master User Guide 2-2 IQ Fiber Master Basics Connecting to the Tap The app provides a diagram, based on data in the Site and Roster Editor tabs, to show how to connect the fibers from the BBU and RRH to the sensor and tap. If multiple tests are defined (for example, several tests are defined in the configuration), it is likely each will have its own, different, fiber-connectivity diagram. - Page 16 The graphic also shows the site's Sector names, bands, and test name/number to assure the user the correct site is ready for test. Figure 2-13. Sample Fiber Connection Diagram The completed connection will resemble the set up in Figure 2-14. Figure 2-14. IQ Fiber Master Sensor and Tap Connected PN: 10580-00467 Rev. A MT2780A UG...
-
Page 17: Main Window Features
IQ Master User Guide 2-3 Main Window Features Main Window Features The main window has these features: • “Main Menu” • File • View • Help • Sensor • “Preparation Tabs” • Site Editor • Roster Editor • Run Tests •... -
Page 18: Main Menu
“Preferences” on page 2-36 for more information about IQ Fiber Master preferences. Anritsu recommends changing the Save directory to a preferred or other suitable directory. Figure 2-15. File Menu • Quit or exit the app. Figure 2-16. Unstored Result Warning Any time you exit the application and the edited work for the site or tests, or the results are not saved, the application displays this message dialog. -
Page 19: View
Use the View>Load menu command to load a stylesheet for the PDF reports. Anritsu and Default Color Schemes View>Anritsu and View>Default provide the choice of two color-schemes to help with viewing in different lighting conditions: one with the Anritsu colors and one default (which might be easier in brighter lighting). -
Page 20: Help
Starts the product demo. Select 3. Run Tests tab, then press Help>Walkthrough. • About IQ Fiber Master Displays the release details (version and build information) in a dialog. Figure 2-19. IQ Fiber Master Release Information 2-12 PN: 10580-00467 Rev. A... -
Page 21: Sensor
• Check for Updates... Checks for updates to the analytics application (this requires an Internet connection). Figure 2-20. IQ Fiber Master Check for Updates Report • Create Diagnostics Package Creates a file, which can be loaded later for troubleshooting by technical support personnel, including IQ vectors, log files, and configuration data. - Page 22 2-4 Main Menu IQ Master User Guide Codeload... (Update the Sensor Firmware) This command checks and if applicable, updates the sensor with new firmware (this requires an Internet connection). Browse to the file’s location and press Load. Figure 2-22. CodeLoad Firmware Dialog When the software update is complete, the app displays this dialog: Figure 2-23.
- Page 23 IQ Master User Guide 2-4 Main Menu Save Captures Check One shot to save captures to a specified directory as single one-shot capture (with a variable capture period of 1ms to 10s) Figure 2-24. One Shot Capture Check Continuous to save captures to a specified directory continuously with a delay from 1 to 99 minutes. Figure 2-25.
- Page 24 2-4 Main Menu IQ Master User Guide Reboot Sensor This option reboots the sensor. Figure 2-27. Sensor Reboot Dialog Note After a sensor is rebooted, press the Connect button. About Sensor Displays an information-only dialog containing data about the status of the sensor. Figure 2-28.
-
Page 25: Preparation Tabs
IQ Master User Guide 2-5 Preparation Tabs Preparation Tabs Site Editor The Site Editor tab provides a way to define the equipment to be tested according to the testing protocol at a site. Notice the tabs numbered 1 through 3. These remind you of the order to set up a new site or start a new batch of measurements. - Page 26 2-5 Preparation Tabs IQ Master User Guide Site Config Buttons Details... Site configuration details. New: Starts a new site configuration. Be careful to not write over the existing site config name. Load... Loads a configuration from a file. Save... Saves the file. You may change the path and name if desired. Apply: Applies the changes so that the testing will use them.
- Page 27 IQ Master User Guide 2-5 Preparation Tabs CPRI (set up the CPRI parameters) Number of system fibers: Select the vendor by name or use Custom. Select the number based on how many fibers are connected to the sensor, typically three: two DL and one UL. TAP Fiber Mode: Select either Single or Multi Mode.
- Page 28 2-5 Preparation Tabs IQ Master User Guide These are the down-sampling (compressed) rates: • LTE15_E1 @ 19.2 MHz (Ericsson Optimized Sampling Line Rate 8 only : 15 MHz LTE: Re-Sample/Compression from 6 to 5 AxC Containers per AxC Group) • LTE15_E2 @ 15.36 MHz (Ericsson LTE15 : Dpwm-Sample/Compression from 6 to 4 AxC Containers Per AxC Group) •...
- Page 29 IQ Master User Guide 2-5 Preparation Tabs RF (set up carriers) These are the parameters for this section: Number of systems: From 1 to 8. Figure 2-32. Number of Systems Frequency Band: Use this button to display the Frequency Band dialog and set whether the system is UL or DL.
-
Page 30: Roster Editor
2-5 Preparation Tabs IQ Master User Guide System n: System number, 1 through n, depending upon the number selected in Number of systems. Carriers: This field specifies how many carriers will be part of this site. Carrier n: Depending upon how many are specified by the Carriers field, this heading marks the beginning of a carrier. - Page 31 IQ Master User Guide 2-5 Preparation Tabs Roster File Buttons Auto Generate: Will generate a roster based on site information file. Load: Loads a roster file. Save: Saves the roster file. Apply: Applies the changes but does not save the file. Roster Detail Site ID: The site ID defined in site configuration details.
-
Page 32: Run Tests
2-5 Preparation Tabs IQ Master User Guide Run Tests Use this tab to run the PIMoCPRI analyses as specified in the Site and Roster Editor tabs. Figure 2-35. Run Tests Tab Control Buttons Run: test name: This button is active when a connection to a sensor is active, and it changes name and function depending upon whether the selected test is one of these: Figure 2-36. - Page 33 IQ Master User Guide 2-5 Preparation Tabs 2. Press the Connect button. The Selected Test > Config Check control becomes active as does the Run: config check button. 3. Press Run: config check button. The Selected Test > PIM Level control becomes active. The app performs the configuration check, then prepares to run the PIM Level test.
-
Page 34: Analysis Tabs
2-6 Analysis Tabs IQ Master User Guide Analysis Tabs These tabs show the results of the testing begun with the either Run: PIM Level or CPRI Analysis button. When looking at a CPRI analysis, the actions of the main buttons are modified as noted for each button. Analyzer The Analyzer tab is modal and the data and options it shows depend upon the path that displayed them. - Page 35 IQ Master User Guide 2-6 Analysis Tabs LTE RF over CPRI Tests Figure 2-39, “Analyzer Tab: LTE RF over CPRI Mode (Relative Spectrum)” “Starting the LTE RF over CPRI Mode” on page 3-5 for more information on LTE RF over CPRI tests. Figure 2-39.
-
Page 36: Pim Vs Time
2-6 Analysis Tabs IQ Master User Guide PIM vs Time Use this tab to compare PIM values to the time it took to detect them. See “PIM vs Time (Long-term Monitoring)” on page 5-1 for more information about this report. Figure 2-40. -
Page 37: Pim Distribution
IQ Master User Guide 2-6 Analysis Tabs PIM Distribution Use this tab to display the PIM measurements exceeding the PIM threshold level.. See “PIM Distribution” on page 5-3 for more information about the distribution report. Figure 2-41. PIM Distribution MT2780A UG PN: 10580-00467 Rev. -
Page 38: Pim Daily (For Pim Failure)
2-6 Analysis Tabs IQ Master User Guide PIM Daily (for PIM Failure) Use this tab to display a report that shows the results for a 24-hour period. See “PIM Daily Report” on page 5-4 for more information about the daily report. Figure 2-42. -
Page 39: Heat Map
IQ Master User Guide 2-6 Analysis Tabs Heat Map Use this tab to display the PIM values in a color-coded table with the strongest return in the reddest color. Figure 2-43. Heat Map The Heat Map is fully explained in the “Heat Map”... - Page 40 2-6 Analysis Tabs IQ Master User Guide Heat Map Interpretation This dialog displays several scenarios for interpreting the Heat Map. Figure 2-44. Heat Map Interpreted 2-32 PN: 10580-00467 Rev. A MT2780A UG...
-
Page 41: Pim Location
IQ Master User Guide 2-7 Control Buttons PIM Location Use this tab to pinpoint the distance to a PIM return. It shows the average (of n objects) and the current PIM return. Figure 2-45. PIM Location Control Buttons Run: testname This button runs the test named in its label: Config Check, PIM Level, PIM Location, or Cross Sector. -
Page 42: Status Line
2-8 Status Line IQ Master User Guide Review Results Use this button to display Reports which are fully explained in Appendix A, “Reports”. Figure 2-46. PIM Distribution Report Save Report This button displays the dialog to save the report. You may change the name and path. Status Line The Status line consists of these fields: •... -
Page 43: Upgrading Iq Fiber Master
• Stopped PIMPower • Checking Config • Stopped ConfigCheck Upgrading IQ Fiber Master If you get a message like this one, you need to upgrade your IQ Fiber Master. Figure 2-47. Upgrade Feature Message MT2780A UG PN: 10580-00467 Rev. A... -
Page 44: 2-10 Preferences
2-10 Preferences IQ Master User Guide 2-10 Preferences Preferences are accessed from File>Preferences in the main menu of the application. Press the Apply button to confirm the selections; press X to return to the application. General Settings Values for application-wide settings (e.g., reports and data) are defined here. Figure 2-48. -
Page 45: Db Units
IQ Master User Guide 2-10 Preferences dB Units The noise floor for each vendor (and bandwidth) are defined in this dialog. The Advanced option in the RF over CPRI is used to measure noise floor of the RRH under test. See “Advanced (Set the Noise Floor)”... -
Page 46: Plot Settings
2-10 Preferences IQ Master User Guide Plot Settings The pen width and plot colors can be changed to suit user. Figure 2-50. General Plot Settings The full explanations for the Plot Settings are: • Pen Width • Colors (Light) • Colors (Dark) •... -
Page 47: Config Check Rules
IQ Master User Guide 2-10 Preferences Config Check Rules The rules applicable to configuration check (from the Run Tests tab) can be edited and enabled or disabled (i.e., optical, CPRI, IQ stream, RSSI/TSSI, bandwidth checks, and LTE ID Tx confguration). The + sign displays a short description and for some, additional fields for values. - Page 48 2-10 Preferences IQ Master User Guide With Show full details in results Figure 2-53. With Full Details • Optical connectivity -- Verify that the SFP is present, its data may be read, and it is receiving sufficient optical power. Adjust the minimum optical receive power and the maximum operating temperature. •...
-
Page 49: Heatmap Rules
IQ Master User Guide 2-10 Preferences Heatmap Rules The Heatmap summary results can be edited to include ALL results, internal/external, or none. Figure 2-54. Heatmap Rules The full explanations for the Heatmap Rules are: • All -- provides details of the ALL PIM measurements in the heatmap summary •... - Page 50 2-10 Preferences IQ Master User Guide 2-42 PN: 10580-00467 Rev. A MT2780A UG...
-
Page 51: Chapter 3 - Making Lte Rf Over Cpri Measurements (Option 752)
Auto-detect a Site’s Configuration To configure Auto Detect: 1. Connect to sensor using “Connecting the IQ Fiber Master” on page 2-3. 2. Press New to clear any pre-existing site configuration. 3. Define the number of system fibers (e.g. 3 fibers to represent 2 x DLs and 1 x UL), 4. -
Page 52: Manual Editing (Advanced View)
3-1 Preparing the Site’s Details (Site Editor) IQ Master User Guide 7. Map the CPRI parameters to the RF carriers by highlighting the Antenna and drag-and-drop across to the appropriate RF carrier. Figure 3-1. Setting Up with Auto Detect 8. Press Save... at any time to preserve the current state of the configuration. Manual Editing (Advanced View) Site parameters can be manually edited on the Site Editor tab after auto-detect or file load. -
Page 53: Load An Existing Configuration File
IQ Master User Guide 3-1 Preparing the Site’s Details (Site Editor) Figure 3-2. Site Editor: Advanced View Load an Existing Configuration File An existing file can be loaded by selecting Load... and choosing the file from the dialog presented. Manually edit as appropriate. -
Page 54: Site Configuration
Whether starting from a manually generated site configuration file or from an existing configuration file (that has been loaded), you must enable only the fibers to which the IQ Fiber Master is connected (the site info may contain multiple configurations assigned to the same SFP). -
Page 55: Starting The Lte Rf Over Cpri Mode
IQ Master User Guide 3-3 Starting the LTE RF over CPRI Mode Starting the LTE RF over CPRI Mode LTE RF over CPRI mode is entered by pressing the CPRI Analysis button while viewing the Site Editor tab. This causes it to enter LTE RF over CPRI mode. The app switches automatically to the Analyzer tab and, after a short delay, the IQ streams enabled in the Site Editor should be visible, similar to what is shown in Figure... -
Page 56: Export Image
3-3 Starting the LTE RF over CPRI Mode IQ Master User Guide Export Image... Displays the Image Capture dialog in readiness to save the current image. Figure 3-5. Image Capture for LTE RF over CPRI File: The file name is built of the three % parameters as shown. You may change the file name, with text or by rearranging the parameters, but the extension is PNG. -
Page 57: Settings
IQ Master User Guide 3-3 Starting the LTE RF over CPRI Mode Settings Adjust the main LTS CPRI RF setting using the menu on the right-hand side of the window. Figure 3-7. Settings Dialog (Most of these are shown just below the Export Image button.) Figure 3-8. -
Page 58: Axes
3-3 Starting the LTE RF over CPRI Mode IQ Master User Guide • Window – Select a suitable window style for applying to the source data prior to the FFT. Figure 3-9. Selecting a Display Type • Spectrogram – Allocates the given (lower) portion of the plot’s vertical dimension to be used when the spectrogram is enabled. -
Page 59: Plot
IQ Master User Guide 3-3 Starting the LTE RF over CPRI Mode Plot The plot menu allows convenient selection of which traces to display on the currently selected plot. The available options are shown below: Figure 3-11. Plot Settings The traces can be filtered by which SFP they are on, or, if they have been configured, by the center frequency of the streams. - Page 60 3-3 Starting the LTE RF over CPRI Mode IQ Master User Guide When a trace is selected by pressing the appropriate Trace button, its trace options are displayed in the right-hand side menu on the right side of the window as shown in Figure 3-13.
- Page 61 IQ Master User Guide 3-3 Starting the LTE RF over CPRI Mode • Spectrogram – displays a spectrogram in the bottom portion of the plot, as shown in the example screenshot below. This can only be enabled for ONE of the current traces per plot. Figure 3-14.
-
Page 62: Markers
3-3 Starting the LTE RF over CPRI Mode IQ Master User Guide Markers When the Markers menu is selected, up to 6 markers can be displayed on each plot with the option to display either frequency, power or combined markers. The available settings for each marker are shown below;. Figure 3-15. - Page 63 IQ Master User Guide 3-3 Starting the LTE RF over CPRI Mode The LTE RF over CPRI spectrum display shows the markers as numbered rectangles above the traces (4). The Markers list (1), at the lower left, of the display shows which markers are visible, the marker table (2), at the bottom, shows the frequencies and traces that the marker is involved in, and the Marker parameters (3), at the right of the display, govern the various aspects of the markers.
- Page 64 3-3 Starting the LTE RF over CPRI Mode IQ Master User Guide Enabling a marker displays a vertical line at the marker’s frequency and a cursor at the trace’s value for that frequency. Figure 3-17 shows two such markers, 1 and 3 (1). The marker ID is displayed at the top of the plot, above its vertical line, and in the color for that marker.
-
Page 65: Capture & Playback
IQ Master User Guide 3-3 Starting the LTE RF over CPRI Mode Capture & Playback Traces can be captured and played back (normal, fixed, or slow motion). A ‘snapshot’ screen image can also be saved. Figure 3-19. Capture and Playback Save Capture: Saves data for playback in a file with your choice of name and path. -
Page 66: Advanced (Set The Noise Floor)
3-3 Starting the LTE RF over CPRI Mode IQ Master User Guide Advanced (Set the Noise Floor) If the calibration factor for the uplink being measured is not known, the Advanced option can measure the noise floor of the RRH under test from the CPRI data. The measurement looks for quiet (minimum power, idle) periods within the LTE signal, and averages them to calculate the noise floor of the signal. - Page 67 IQ Master User Guide 3-3 Starting the LTE RF over CPRI Mode The settings for the noise floor display. Figure 3-22. Advanced Settings Before Calibration Completes 3. Select a Plot. 4. Set the options for the selected Plot. Maximum Iterations: Increments of one from 10 to 10000 (default of 5000). Timeout for Minimum: Increments of one second, from 1 to 60 seconds (default of 30).
- Page 68 3-3 Starting the LTE RF over CPRI Mode IQ Master User Guide After the time set in the Timeout for Minimum elapses, then the Set dBm Calibration button appears. Figure 3-23. Advanced Settings After Calibration Completes 6. Press the Set dBm Calibration button to apply the noise floor (dBm) to the vendor and LTE air standard as specified in the current Site Editor file.
- Page 69 IQ Master User Guide 3-3 Starting the LTE RF over CPRI Mode This message displays when the calibration is updated: Figure 3-25. Calibration Successful This is the LTE RF over CPRI trace display after the calibration is successful. Note the addition of the red line about -108 dBm.
- Page 70 3-3 Starting the LTE RF over CPRI Mode IQ Master User Guide This message displays when the calibration is canceled: Figure 3-27. Calibration Canceled Use the Reset to Defaults command to reset the Noise Floor parameters to their defaults. Figure 3-28. Noise Floor Default Settings 3-20 PN: 10580-00467 Rev.
-
Page 71: Zoom
IQ Master User Guide 3-3 Starting the LTE RF over CPRI Mode Zoom While the LTE RF over CPRI is running, it is possible to zoom into regions of the currently selected plot. Note That this is a video zoom only so it does not change the way the trace is being determined. To zoom: 1. - Page 72 3-3 Starting the LTE RF over CPRI Mode IQ Master User Guide 2. To zoom the power axis (vertical) only, hold the SHIFT key down in addition to the mouse operation. Figure 3-30. Power Axis Zoom (Vertical Axis) 3-22 PN: 10580-00467 Rev. A MT2780A UG...
- Page 73 IQ Master User Guide 3-3 Starting the LTE RF over CPRI Mode 3. To zoom both axes simultaneously, hold the CTRL key down in addition to the mouse operation and define a box. Figure 3-31. Two-Axis Zoom 4. Double-clicking on the plot resets the display to its normal view. MT2780A UG PN: 10580-00467 Rev.
-
Page 74: Stopping/Restarting Lte Rf Over Cpri Mode
3-4 Stopping/Restarting LTE RF over CPRI Mode IQ Master User Guide Stopping/Restarting LTE RF over CPRI Mode Stopping LTE RF over CPRI mode is done using the (red) Stop button at the top of the window. This completely stops the data acquisition and the processing/display of all traces. Figure 3-32. -
Page 75: Chapter 4 - Making Pim-Over-Cpri Measurements (Option 754)
Option 754 (requires Option 752) measures the PIM phenomena and Option 755 provides more in-depth analysis. See “Upgrading IQ Fiber Master” on page 2-35 for information about upgrading to this option. Start PIM analysis with the Site Editor tab to make sure that the app correctly configures the sensor and correctly analyzes the data from the IQ and baseband streams. -
Page 76: Manual Editing
4-1 Preparing the Site’s Details (Site Editor) IQ Master User Guide 7. Map the CPRI parameters to the RF carriers by highlighting the Antenna and drag and drop across to the appropriate RF carrier. Figure 4-1. Setting Up with Auto Detect 8. -
Page 77: Existing File
IQ Master User Guide 4-1 Preparing the Site’s Details (Site Editor) Figure 4-2. Site Editor: Advanced View Existing File An existing file can be loaded by selecting Load... and choosing the file from the dialog presented. Manually edit as appropriate. MT2780A UG PN: 10580-00467 Rev. -
Page 78: Site Configuration
Whether starting from a manually generated site configuration file or from an existing configuration file (that has been loaded), you must enable only the fibers to which the IQ Fiber Master is connected (the site info may contain multiple configurations assigned to the same SFP). -
Page 79: Editing The List Of Test Scenarios (Roster Editor)
IQ Master User Guide 4-3 Editing the List of Test Scenarios (Roster Editor) Editing the List of Test Scenarios (Roster Editor) This file contains the test scenarios to be performed. Like the Site Editor, the file can be created in one of these ways: •... -
Page 80: Configuration Check
4-5 Configuration Check IQ Master User Guide Configuration Check To perform the configuration check: 1. Select the Run Tests tab, load the appropriate site config and test roster files. 2. Select the test to be performed from the Selected Test section of the Roster Detail. -
Page 81: Pim Measurement
IQ Master User Guide 4-6 PIM Measurement PIM Measurement Select 'PIM Level' radio button under 'Selected Test' and press the green 'Run: PIM level' along the top bar. PIM Level measurement begins for each antenna port (defined in the Roster Editor). Test status and PIM Engine status are displayed in the top, right-hand side of the results window and bottom bar, respectively. -
Page 82: Analyzer: Pimocpri
4-7 Analyzer: PIMoCPRI IQ Master User Guide Analyzer: PIMoCPRI The Analyzer tab for the PIMoCPRI test shows the (wanted) UL and PIM spectra and can be used as a visual indication of PIM impact on the UL carrier. Figure 4-3. Analyzer: PIMoCPRI Main Buttons and Controls You can see that the Stop button, Review Results, and Save Report buttons are activated (Fiber Diagram is not... -
Page 83: Context Menu
IQ Master User Guide 4-7 Analyzer: PIMoCPRI Context Menu Right-click in the PIMoCPRI trace display to show the context menu that allows you to alter the appearance of the trace display. Figure 4-4. Trace Context Menu Signals This switches on and off UL and PIM which also removes their entries from the legend. Legend Turns the Legend on and off. - Page 84 4-7 Analyzer: PIMoCPRI IQ Master User Guide Light/Dark Changes the display from colored-traces-on-black (the color scheme in which most of the figures in this publication are depicted) to -on-white. The colors of the remainder of the display are unchanged. Figure 4-6. PIM Display: Light Phase Zoom Zoom Full: Returns the display to its non-zoomed state.
- Page 85 IQ Master User Guide 4-7 Analyzer: PIMoCPRI Time-Power/Spectrum These change the display mode between Spectrum (most of the figures in this chapter) and Time-Power. Figure 4-7. Time-Power Display Mode of PIMoCPRI MT2780A UG PN: 10580-00467 Rev. A 4-11...
- Page 86 4-7 Analyzer: PIMoCPRI IQ Master User Guide Points Changes the number of points displayed from several options, with 1 k the default (with a dot showing which option is selected). Figure 4-8. Trace Points Selecting AutoScale/Scaling These change the trace display regardless of what mode it is in: •...
-
Page 87: Pim Location, Distance, And Calibration
IQ Master User Guide 4-8 PIM Location, Distance, and Calibration PIM Location, Distance, and Calibration Introduction To enable PIM location measuring: 1. For each test a PIM distance measurement is required, select Distance on the Roster Editor>Roster Detail: Figure 4-9. Roster Editor: PIM Location 2. - Page 88 4-8 PIM Location, Distance, and Calibration IQ Master User Guide Press the green Run: PIM location button at the top to start a PIM Location measurement. The tab focus moves to PIM Location. Figure 4-10. PIM Location The app then processes the data that were acquired during the PIM Level test. Figure 4-11.
-
Page 89: Pim Calibration
IQ Master User Guide 4-8 PIM Location, Distance, and Calibration It redisplays the PIM Location tab with new data. Figure 4-12. PIM Location New Data PIM Calibration 1. Select the antenna with the strongest PIM measurement (determined from the PIM measurement and note that antennas with no PIM are not included in display). - Page 90 4-8 PIM Location, Distance, and Calibration IQ Master User Guide 3. After attaching the PIM source, press the Calibrate button at the bottom. This sets the distance to 0 m. Remove the PIM source. Figure 4-14. PIM Calibration 4. Calibration steps cannot be saved to the report. 4-16 PN: 10580-00467 Rev.
-
Page 91: Pim Location
IQ Master User Guide 4-8 PIM Location, Distance, and Calibration PIM Location To finish the PIM Location measurement: 1. Perform a PIM calibration (including removing the PIM source). 2. Press Restart Measurement. PIM Location is measured and displayed in the top, right corner. •... -
Page 92: Auxiliary Pim Location Information
4-8 PIM Location, Distance, and Calibration IQ Master User Guide Auxiliary PIM Location Information The figures in this section show various states of the PIM Level testing results Figure 4-16. PIM Level Test Results: No PIM This graphic shows a PIM failure (PIM found) and shows that PIM Location is activated.. Figure 4-17. -
Page 93: Cross-Sector Analysis
IQ Master User Guide 4-9 Cross-Sector Analysis Figure 4-18. Selecting PIM Location Test Cross-Sector Analysis After PIM location test run Cross-Sector Analysis. To run Cross Sector test 1. Select Cross Sector. Figure 5 Selecting Cross Sector Test 2. Press Run: cross sector. Figure 6 Running Cross Sector Test The Cross-Sector test allows the sensor to be configured with downlinks from different sectors of the same site... - Page 94 4-9 Cross-Sector Analysis IQ Master User Guide 4-20 PN: 10580-00467 Rev. A MT2780A UG...
-
Page 95: Chapter 5 - Pim Analytics (Option 755)
Chapter 5 — PIM Analytics (Option 755) Option 755 (requires Option 752 and 754) provides deeper analysis for the PIM measurements. See “Upgrading IQ Fiber Master” on page 2-35 for information about upgrading to this option. PIM vs Time (Long-term Monitoring) This tab shows PIM level against time for all antenna ports that are measuring PIM. -
Page 96: Events
5-1 PIM vs Time (Long-term Monitoring) IQ Master User Guide Events... An events log is created and can be saved as a CSV file. Click Events... button to display the report, and click Save... to save the report. (The report is saved independently of the PIM report.) Figure 5-2. -
Page 97: Pim Distribution
IQ Master User Guide 5-2 PIM Distribution PIM Distribution This tab shows a CDF plot depicting the percentage percentage of measurements that exceed the defined PIM level threshold, in dBm, for each antenna port under test.. Figure 5-3. PIM Distribution MT2780A UG PN: 10580-00467 Rev. -
Page 98: Pim Daily Report
5-3 PIM Daily Report IQ Master User Guide PIM Daily Report This tab shows a histogram, over a 24-hour period, for each antenna that has PIM. A summary of maximum and minimum PIM with duration is shown at the top left of the graph. Figure 5-4. -
Page 99: Heat Map
IQ Master User Guide 5-4 Heat Map Heat Map The heat map represents the relative contribution (in dB) of each transmitting antenna port to the total measured PIM power. . Figure 5-5. Heat Map Clicking Interpret Heatmap displays several different scenarios and descriptions of the likely locations of the PIM. - Page 100 5-4 Heat Map IQ Master User Guide PN: 10580-00467 Rev. A MT2780A UG...
-
Page 101: Appendix A - Reports
Appendix A — Reports PIMoCPRI Reports View the report at any time by pressing Review Results button. The reports for PIM are not automatically saved or written to a PDF format. Press the Add to Report button when an action completes to write its results to the report. -
Page 102: A-1 Pimocpri Reports
A-1 PIMoCPRI Reports IQ Master User Guide Report Header The report header contains the Site, Operator, and Instrument details. Note the footer -End of PIM Report- which marks the last entry of the report. Figure A-3. Report Header--Online Version From the online version, you can save, preview, and print the PDF version. PN: 10580-00467 Rev. -
Page 103: Check Configuration
IQ Master User Guide A-1 PIMoCPRI Reports Check Configuration When a Config Check is performed prior to a PIMoCPRI test, the Results pane of the Run Tests tab display the results (which can be detailed or summarized). Press the Add to Report button to add Config Check results to the end of the report. -
Page 104: Pim Level
A-1 PIMoCPRI Reports IQ Master User Guide PIM Level After a PIM Level (PIMoCPRI) test is initiated, press Add to Report to write all of its results to the report. Note the time-stamp right after the PIM Level heading. Each time the Add to Report button is pressed a new PIM Level heading and data are added to the report. -
Page 105: Pim Vs. Time
IQ Master User Guide A-1 PIMoCPRI Reports PIM vs. Time A PIM vs. Time report provides data about when a PIM occurs on the 24-hour clock. To get a PIM-vs-Time report, 1. Run the PIM Level test. 2. Choose either a or b: a. -
Page 106: Pim Distribution
A-1 PIMoCPRI Reports IQ Master User Guide PIM Distribution The PIM distribution tab shows all the PIM sources relative to the threshold. To view a PIM Distribution, 1. Run the PIM Level test. 2. Choose either a or b: a. Press Add to Report and scroll down to the Long Term Monitor figure. b. -
Page 107: Pim Daily (Long-Term Monitoring
IQ Master User Guide A-1 PIMoCPRI Reports PIM Daily (Long-term Monitoring) To get a meaningful PIM Daily report, the PIM Level test must run long enough. Figure A-8. PIM Report: Daily (Long-term) Monitoring The graph covers a 24-hour period. MT2780A UG PN: 10580-00467 Rev. -
Page 108: Heat Map
A-1 PIMoCPRI Reports IQ Master User Guide Heat Map The heat map is most useful for antennas that fail the PIM test. The report contains the heat map matrix with summaries. Figure A-9. PIM Report: Heat Map PIM Location PIM location is not included in the prepared report. See“PIM Location, Distance, and Calibration”... -
Page 109: Lte Rf Over Cpri
IQ Master User Guide A-2 LTE RF over CPRI LTE RF over CPRI Here is a typical LTE RF over CPRI display. Figure A-10. LTE RF over CPRI display This view cannot be added to PIM report through the app; however, the image may be exported to a PDF file. You can zoom in on the x-axis to view more detail at a frequency: •... - Page 110 A-2 LTE RF over CPRI IQ Master User Guide A-10 PN: 10580-00467 Rev. A MT2780A UG...
- Page 112 Anritsu Company 490 Jarvis Drive Anritsu utilizes recycled paper and environmentally conscious inks and toner. Morgan Hill, CA 95037-2809 http://www.anritsu.com...
Need help?
Do you have a question about the IQ Fiber Master and is the answer not in the manual?
Questions and answers