
Related Manuals for Anritsu MT8801C


Summary of Contents for Anritsu MT8801C
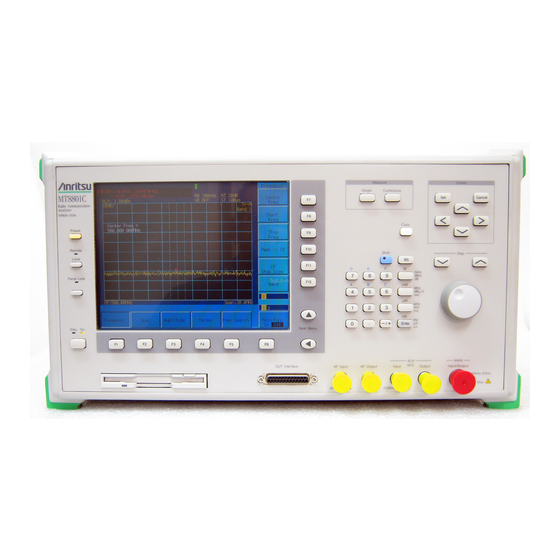
- Page 1 MT8801C Radio Communication Analyzer Option 07: Spectrum Analyzer Operation Manual (Panel Operation)
-
Page 2: Table Of Contents
Table of Contents Section 1 General ......... 1.1 General ................1.2 Manual Composition ............1.3 Specifications ..............Section 2 Panel Layout ........ Section 3 Operation ........3.1 Basic Operation .............. 3.2 Position of Operation Keys ..........3.3 Setting Observation of Frequency ........3-10 3.4 Level Range Setting ............ -
Page 3: Section 1 General
Section 1 General General ..............Manual Composition ..........Specifications ............ -
Page 4: General
Section 1 General General The MT8801C Digital Mobile Radio Transmitter Tester is a test platform having all the hardware needed to test digital mobile communication terminals. The perfor- mance of radio equipment can be efficiently evaluated by using it with optional test software. -
Page 5: Manual Composition
1.2 Manual Composition Manual Composition This manual is made up of the following sections. Section 1 General Describes the introduction, function specifications and performance of this instru- ment. Section 2 Panel Layout Explains the basic items for operating this equipment. Section 3 Operation Explains basic operation and how to operate for each measurement item. -
Page 6: Specifications
Section 1 General Specifications The MT8801C Digital Mobile Radio Transmitter Tester option 07 specifications are listed in Table 1-1 below. Table 1-1 Option 07: Spectrum Analyzer (1/2) 0 Hz to 3 GHz (Band 0)/10 MHz to 3 GHz (Band 1) - Page 7 1.3 Specifications Table 1-1 Option 07: Spectrum Analyzer (2/2) Frequency 10 MHz to 2.2 GHz, reference level ≥+0 dBm (MAIN connector), ≥–20 dBm (AUX connector) ±0.5 dB (0 to –50 dB, resolution bandwidth ≤1 MHz) Log linearity ±1.0 dB (0 to –70 dB, resolution bandwidth ≤30 kHz) ±1.0 dB (0 to –80 dB, resolution bandwidth ≤1 kHz) Second harmonic distortion: Mixer input level –30 dBm...
- Page 8 Section 1 General 1-6.
-
Page 9: Section 2 Panel Layout
Section 2 Panel Layout The contents of this section are the same as the contents of Option 01 [3.1 Panel Layout] in this manual. Therefore, refer to Option 01 [3.1 Panel Layout]. - Page 10 Section 2 Panel Layout 2-2.
-
Page 11: Section 3 Operation
Section 3 Operation This section describes how to operate the spectrum analyzer. Section 3.1 describes the basic operation procedure using switching the operation screen. Section 3.2 and later sections describe the operation procedure for each function key in detail. in the following descriptions indicates main function keys (F1 to F6), and ________ indicates function keys (F7 to F12). - Page 12 Section 3 Operation Coupled Function ............3-30 3.7.1 Resolution Bandwidth (RBW) and Sweep Time .............. 3-30 3.7.2 Video Bandwidth (VBW) ........ 3-32 3.7.3 Input Attenuator (Attenuator) ......3-33 3.7.4 Automatic Calibration ........3-34 Selecting the Display Mode ........3-35 3.8.1 Trace Freq .............
-
Page 13: Basic Operation
Press the rear panel power switch, then press the front panel power switch. The Setup Common Parameter screen shown below is displayed. (Fig. 3-1) Fig. 3-1 This is the radio equipment test software setup screen. Switch to the MT8801C ini- tialization and spectrum analyzer mode screen. - Page 14 (2) MT8801C initialization. Press the [Main Func] key (F6). (Fig. 3-2) When the Main Func key is On, keys F1 to F5 indicate the MT8801C measuring instrument modes. When the Main Func key is Off, keys F1 to F5 indicate the menus related to the current screen.
- Page 15 3.1 Basic Operation (4) Move the signal to the center of the screen. Press the Frequency key (F1). (Fig. 3-4) When frequently used keys such as Frequency, Span, and Amplitude are pressed, they automatically Center Freq = enter the state in which Center 1.505 000 000GHz frequency, Span, Reference Level are selected, and values can be set...
- Page 16 Section 3 Operation (5) Expand and display the signal. Press the Span key (F2), then expand the signal by pressing the step key several times. (Fig. 3-6) Freq Span = 1.000 000MHz Fig. 3-6...
-
Page 17: Marker Operation
3.1 Basic Operation 3.1.2 Marker operation Check that the signal frequency and level are displayed in the marker display area. The zone marker automatically captures the peak signal in the zone range and displays its frequency and level. To check the Peak → CF function, move the signal away from the center of the screen. Press the Frequency key (F1), then change Center Freq by turning the rotary knob. -
Page 18: Screen Hard Copy
Section 3 Operation Press the Peak → CF key (F9). The signal moves to the center of the screen. (Fig. 3- Zone Center = 500.008 000MH Fig. 3-9 3.1.3 Screen hard copy The screen display can be printed on a printer via the rear panel parallel interface. Any ESC/P command system printer can be used. -
Page 19: Position Of Operation Keys
3.2 Position of Operation Keys Position of Operation Keys This sections shows the position of the operation keys described in Section 3.3 and subsequent sections. Fig. 3-11 3.6 Peak Search Function 3.5 Marker Function 3.4 Level Range Setting 3.3 Observed Frequency Setting Fig. -
Page 20: Setting Observation Of Frequency
Section 3 Operation Setting Observation of Frequency 3.3.1 Center-Span Mode (1) Setting center frequency Frequency Step KEY (Use the CF Step Size key to set the step size.) (2) Setting frequency span Span Step KEY (1/2/5 sequence) Note: When frequency span is 200 kHz or less, warming up might be necessary until the observation frequency becomes stable after turning on the power. -
Page 21: Start-Stop Mode
3.3 Setting Observation of Frequency 3.3.2 Start-Stop Mode (1) Start frequency Frequency Start Freq (2) Stop frequency Frequency Stop Freq Notes: • Because the step keys [ ] are the step keys for the center fre- quency, the start and stop frequencies are also changed. •... -
Page 22: Setting Step Size With Step Keys
Section 3 Operation 3.3.3 Setting Step Size with Step Keys Measure Cursor Single Continuous MT8801C Cancel Radio Communication Analyzer 300kHz-3GHz Copy Preset Remote F 10 Shift Step Local F 11 Panel Lock F 12 dBµ/V µW µV - / +... -
Page 23: Setting Full Span/Zero Span
3.3 Setting Observation of Frequency 3.3.4 Setting Full Span/Zero Span (1) Setting Full Span In the normal operating state, pressing Preset the key allows the entire frequency range of the spectrum analyzer to be swept over the full span. However, this setting also initializes the parameters except the frequency range. -
Page 24: Frequency Bands
Section 3 Operation 3.3.5 Frequency Bands In the Spectrum Analyzer, the 0 to 3 GHz frequency range consists of the following two bands: • Band 0 ....0 to 3 GHz • Band 1 ....10 MHz to 3 GHz In the initial state, the wide dynamic range Band 1 mode that is selected. -
Page 25: Level Range Setting
3.4 Level Range Setting Level Range Setting The following table shows the reference level (top of amplitude scale) range of this spectrum analyzer. Input terminal Units Reference level range Main – 60 to +50 dBm – 80 to +30 dBm dBm: Units system that assumes 1 mW/50 Ω... -
Page 26: Setting Reference Level Step Size
Section 3 Operation 3.4.3 Setting Reference Level Step Size To change the reference level with the step keys [ ], set the step size by performing the following key operations. ← Select one. Amplitude Ref Level 1 Div 2 Div Step Size 5 Div 10 Div... -
Page 27: Marker Function
3.5 Marker Function Marker Function 3.5.1 Zone Marker/Current Maker The part enclosed in dotted lines in the center of the screen shown in the figure below is called the zone marker. The current marker within this zone marker normally moves to the maximum level. The frequency (or time for time domain mode) and level at the current marker point (intensified point) are displayed at the top left-hand corner of the screen. - Page 28 Section 3 Operation When the zone marker width is set to 1 point (Spot), the zone marker becomes a vertical line. This is called a spot marker. Since the marker center frequency and the current marker frequency coincide, the level at the desired frequency can be mea- sured.
- Page 29 3.5 Marker Function (2) Changing Zone Marker Position The center frequency (time) of the zone marker is initially centered on the fre- quency (time) axis on the screen. By performing the following key operations, the zone marker can be moved from the left end to the right end of the frequency axis (time) on the screen.
-
Page 30: Normal Marker
Section 3 Operation 3.5.2 Normal Marker A single marker is indicated by M at the maximum level within the zone marker. The frequency and level at that point are displayed digitally. The normal marker is initially set to ON. When the current state is another marker mode, or when the normal marker is set to OFF, perform the following key operations to set the normal marker to ON. -
Page 31: Delta Marker
3.5 Marker Function 3.5.3 Delta Marker The current marker position when the delta marker is set to On is fixed as the refer- ence marker (reference point). Then, as the current marker is moved, the reference marker and current marker frequency (time) and level differences are displayed digi- tally as delta marker values. -
Page 32: Mkr → Cf/Mkr → Rlv
Section 3 Operation Mkr → CF/Mkr → RLV 3.5.4 Sets the current marker frequency or level to the center frequency or reference level. Mkr → CF Marker Mkr → RLV 3-22... -
Page 33: Zone → Span
3.5 Marker Function Zone → Span 3.5.5 To set the zone marker center frequency and width to the center frequency and fre- quency span, respectively, perform the following key operations. Zone → Span Marker The zone width remains unchanged. 3-23... -
Page 34: Marker Off
Section 3 Operation 3.5.6 Marker Off Marker Off Marker (Display page 2 of the menu by pressing the Next Menu key.) The marker disappears from the screen. When the Normal Marker key is pressed, the marker is displayed. 3.5.7 Display Line In the state in which a horizontal line which indicates a given level is displayed on the scale, the display line can be used as the frequency response measurement guideline, or as the reference line of the marker level measurement or pass/fail judgement with a... -
Page 35: Marker Search Function
3.6 Marker Search Function Marker Search Function 3.6.1 Peak Search Peak Search detects the maximum level point from the entire trace in which a marker is displayed and moves the marker to that point. To Execute Peak search, perform the following key operations. Peak Search 3.6.2... -
Page 36: Next Right Peak Search/Next Left Peak Search
Section 3 Operation 3.6.3 Next Right Peak Search/Next Left Peak Search Next Right Peak search and Next Left Peak Search detect the adjacent peak level to the right or left of the current marker and move the marker to that point. To execute Next Right Peak Search and Next Left Peak Search, perform the following key operations. -
Page 37: Peak → Cf/Peak → Rlv
3.6 Marker Search Function Peak → CF/Peak → RLV 3.6.4 (1) Peak → CF Peak Peak → CF Search Sets the maximum peak point on screen and the zone marker to the center fre- quency. Notes: • When the frequency at the maximum peak point is less than 0 Hz, the center frequency is set to 0 Hz. -
Page 38: Setting Search Resolution
Section 3 Operation 3.6.5 Setting Search Resolution Sets the Peak search resolution. When searching for the next peak, the marker moves to the point of the set resolution or higher. Peak Resolution Search /Threshold (Display page 2 of the menu by pressing the Next Menu key.) Enter the resolution in dB units from the ten keys. -
Page 39: Setting Search Threshold
3.6 Marker Search Function 3.6.6 Setting Search Threshold Sets the display line to the threshold and searches for the level above or below the display line. Peak Resolution Search /Threshold (Display page 2 of the menu by pressing the Next Menu key.) Turn threshold On and Off by pressing this key. -
Page 40: Coupled Function
Section 3 Operation Coupled Function 3.7.1 Resolution Bandwidth (RBW) and Sweep Time To set the RBW and Sweep Time, perform the following key operations. Manual Manually set the RBW with the ten keys, step keys, and rotary knob. Auto Automatically set the RBW. RB, VB, SWT Automatically set the RBW, VBW, and Sweep Time. - Page 41 3.7 Coupled Function (2) Manual setting If RBW, VBW, and Sweep Time are set to the Auto mode, normal measure- ments can be made without considering their settings. However, in the following cases, RBW should be set to the Manual mode. General measurements: When observing two adjacent signals, increasing the frequency by narrow- ing the RBW can reduce the noise level (a tenth part of the current RBW...
-
Page 42: Video Bandwidth (Vbw)
Section 3 Operation 3.7.2 Video Bandwidth (VBW) To set the VBW, perform the following key operations. Manual Manually set the VBW with the ten keys, step keys, and rotary knob. Auto Automatically set the VBW. RB, VB, SWT Automatically set the RBW, VBW, and Sweep Time. Auto (1) Auto mode The spectrum analyzer different with conventional spectrum analyzer, does not... -
Page 43: Input Attenuator (Attenuator)
3.7 Coupled Function 3.7.3 Input Attenuator (Attenuator) To set the input attenuator, perform the following key operations. Attenuator Manual Manually set the input attenuator with the ten keys, step keys, and rotary knob. Auto Automatically set the input attenuator. All Auto Automatically set the RBW, VBW, Sweep Time, and Atten. -
Page 44: Automatic Calibration
Section 3 Operation 3.7.4 Automatic Calibration Execute spectrum analyzer automatic calibration by performing the following key operations. Coupled Automatically calibrate Level. Function It is recommendable to execute the process of automatic calibration, when more accu- rate measurements is needed, or it would not correspond to the standard, or environ- ments such as ambient temperature have greatly changed. -
Page 45: Selecting The Display Mode
3.8 Selecting the Display Mode Selecting the Display Mode 3.8.1 Trace Freq (1) Trace A Trace A is used to analyze signals in the normal frequency domain. Trace-Freq Trace A (2) Trace B Like trace A, trace B is used to analyze signals in the normal frequency domain. When used with trace A, it is possible to compare waveform A and waveform B. - Page 46 Section 3 Operation (3) Trace A and Trace B Overwrite Display Overwrites trace A and trace B on one screen. At this time, the trace B fre- quency range, reference level, and other parameters are the same as trace A. However, in the threshold mode and detection mode, the parameters can be set independently at trace A and trace B.
-
Page 47: Time Domain
3.8 Selecting the Display Mode 3.8.2 Time Domain Since the spectrum analyzer stops sweeping the frequency when set to a frequency span of 0 Hz, the spectrum analyzer becomes a selective level meter that continues to receive only the center frequency. In this case, the horizontal axis of the time-axis sweep waveform is graduated in time and displayed on the spectrum analyzer screen. - Page 48 Section 3 Operation (2) Trace Time Trace Time displays the time axis waveform at the center frequency of trace A or trace B. To display trace Time, press the Trace-Time key. Trace-Time Delay Time Sets the delay time from trigger to sweep. 10.0 ms A negative value is not input.
- Page 49 3.8 Selecting the Display Mode (3) Setting Time Span In the time domain mode, the measurement range on the horizontal axis does not set the frequency span, but sets the time span. To set the time span, perform the following key operations. Trace-Time Time Span Unit key...
- Page 50 Section 3 Operation Example of Waveform With Delay Time 3-40...
-
Page 51: Storage Mode
3.8 Selecting the Display Mode 3.8.3 Storage Mode The following seven storage modes can be selected for Display modes trace A, trace B, and trace Time. Types of Trace Modes (1/2) Mode Explanation Display example Refreshes and displays the trace data at each sweep. This is used for normal measurement. - Page 52 Section 3 Operation Types of Trace Modes (2/2) Explanation Display example Mode Displays the cumulative waveform at each sweep. The waveform data, which are not connected by lines, are displayed by plotting the data. Cumulative Displays the waveform overwritten without deleting the old trace data.
-
Page 53: Setting Storage Mode
3.8 Selecting the Display Mode 3.8.4 Setting Storage Mode The storage mode can be selected by operating the function keys shown below while the spectrum analyzer is operating in the trace A, trace B, or trace Time mode. Trace-Freq Trace-Time Storage Normal Max Hold... -
Page 54: Averaging Function
Section 3 Operation 3.8.5 Averaging Function The digital averaging function calculates the average data at each X axis point at each sweep and displays the results. It is executed by selecting Average in the trace A, trace B, and trace Time display modes. Trace-Freq Average Trace-Time... - Page 55 3.8 Selecting the Display Mode The averaging function improves the S/N ratio depending on the averaging rate and the number of sweep repetitions as shown on the next page. Digital video averaging is performed by the method shown below. Averaging Rate = N Number of Measurement value Displayed value...
- Page 56 Section 3 Operation S/N Improvement by Digital Video Averaging Averaging by video filter has the disadvantage that the sweep time becomes longer when the video bandwidth is narrowed to improve the averaging effect. On the other hand, digital video averaging smoothes the trace display by averaging the digital data after A/D conversion at each sweep, without narrowing the video band- width (VBW).
-
Page 57: Max Hold And Min Hold Functions
3.8 Selecting the Display Mode 3.8.6 Max Hold and Min Hold Functions When Max Hold or Min Hold is selected, the sweeping can be performed by the num- ber of specified repetitions, and then stops. Trace-Freq Max Hold Trace-Time Storage Min Hold Sweep Set the number of sweeping repetitions. -
Page 58: Explanation Of Detection Mode
Section 3 Operation 3.8.7 Explanation of Detection Mode The spectrum analyzer has 501 horizontal-axis measurement sample points. This cor- responds to 501 storage trace memories. The detection mode determines what type of measured value should be stored in the trace memory at each measurement sample point. Detection mode Description Holds the maximum level present between the current... -
Page 59: Selecting Detection Mode
3.8 Selecting the Display Mode 3.8.8 Selecting Detection Mode Select the detection mode for trace A, trace B, or trace Time by performing the follow- ing key operations. Trace-Freq Trace-Time Derection Pos peak Sample Select the detection mode. Neg Peak Return Waveforms when trace A is in the Pos Peak mode and trace B is in the NegPeak mode... -
Page 60: Selecting The Sweep Method
Section 3 Operation Selecting the Sweep Method 3.9.1 Continuous Sweep Mode When the trigger mode is set to Freerun, sweep is performed continuously. When the trigger mode is set to Triggered, sweep is executed each time the trigger conditions are met. To set the continuous sweep mode, perform the following key operation. -
Page 61: Trigger Mode
3.9 Selecting the Sweep Method 3.9.3 Trigger Mode The spectrum analyzer trigger mode can be divided into Freerun and Triggered. In the Triggered mode, Wide IF Video and External can be selected as the trigger source. (1) Freerun When the sweep mode is set to continuous, sweep is repeated continuously. When the sweep mode is set to single sweep, sweep is started immediately after key is pressed. - Page 62 Section 3 Operation (3) Wide IF Video Trigger A wide bandwidth IF signal of at least 30 MHz is detected and sweep is started in synchronization with its positive leading edge or negative leading edge. To select the trigger level and trigger slope, perform the following key opera- tions.
-
Page 63: Explanation Of Time Gate Function
3.9 Selecting the Sweep Method 3.9.4 Explanation of Time Gate Function The time gate function is a sweep mode which turns the waveform data display On and Off by the gate control signal generated in the spectrum analyzer based on an external signal or video trigger signal. -
Page 64: Creating A Gate Control Signal
Section 3 Operation 3.9.5 Creating a Gate Control Signal If the point where an external trigger signal or a wide IF video trigger signal is trig- gered is assumed to be the reference position, the gate control signal remains On over the period from the point immediately after the Gate Delay time has elapsed from the reference position to the time set by Gate Length. -
Page 65: Setting Gate Function
3.9 Selecting the Sweep Method 3.9.6 Setting Gate Function Trigger/ Gate Setup Gate Gate Delay Set the gate delay time. 0 us Gate Length Set the gate time length. 10 ms Gate Trig Select the gate trigger source from Wide IF Video Source and external. - Page 66 Section 3 Operation The time domain mode facilitates setting the gate control signal time. The following shows an example of how to use the Time Gate function that uses the time domain mode. Step Procedure Input the following signals to the spectrum analyzer. Input signal Input to RF Input Trigger signal...
- Page 67 3.9 Selecting the Sweep Method Step Procedure Set the frequency domain mode. The trigger mode becomes Freerun and the waveform data is displayed only for the time set by Gate Length. Notes: The detector output is delayed compared to the positive leading edge of the input waveform when the resolution bandwidth (RBW) is narrowed in the frequency domain measurement mode.
-
Page 68: Measurement
Section 3 Operation 3.10 Measurement 3.10.1 Measurement Function Various application measurements can be selected by performing the following key operations. Measure Noise Measure the carrier signal and noise power ratio. Measure C/N Ratio Measure the occupied bandwidth. Select the X dB DOWN mode or N% of Measure POWER mode. - Page 69 3.10 Measurement (3) Measuring Occupied Bandwidth To measure the occupied bandwidth, perform the following key operations. Measure Occ BW Execute Execute measurement. Measure Select the X dB Down mode or N% Setup of Power mode. return (4) Measuring Adjacent Channel Leakage Power To measure the adjacent channel leakage power, perform the following key op- erations.
- Page 70 Section 3 Operation (5) Measuring Burst Average Power To measure the average power of a burst wave in the time domain mode, per- form the following key operations. Measure Burst Avg Execute Execute measurement. Power Start Set the measurement start point of the burst signal Point on the screen with the ten keys or the rotary knob.
-
Page 71: Measurement Examples
(1) Example of C/N Ratio Measurement • In C/N measurement, set the detection mode set to the Sample mode, unless specified otherwise. Measurement block diagram Unmodulated MT8801C signal source • Center frequency : 1.9 GHz • Offset frequency : 100 kHz... - Page 72 Section 3 Operation Measurement procedure Step Operation procedure Press the spectrum analyzer [Preset] key. Span frequency setting: F2: Span , [4], [0], [kHz] Sets the span frequency to 3 or 4 times the offset frequency. Reference level setting: F3: Amplitude , [2], [0], [dBm] Center frequency setting: F1: Frequency , [1], [.], [9], [GHz] RBW setting: [Next Menu], F1: Coupled Function , F7: RBW, [1], [kHz] VBW setting: F12: return, F8: VBW, [3], [0], [Hz]...
- Page 73 When measuring the carrier-off leakage power and adjacent channel leakage power of Japan digital cordless telephone systems (burst wave), set the detec- tion mode to the Pos Peak mode. Measurement block diagram Unmodulated MT8801C signal source • Center frequency : 800 MHz • Span frequency width : 400 kHz •...
- Page 74 Section 3 Operation Measurement procedure Step Procedure Press the spectrum analyzer [Preset] key. Span frequency setting: F2: Span , [4], [0], [0], [kHz] Reference level setting: F3: Amplitude , [2], [0], [dBm] Center frequency setting: F1: Frequency , [8], [0], [0], [MHz] RBW setting: [Next Menu], F1: Coupled Function , F7: RBW, [3], [kHz] VBW setting: F12: return, F8: VBW, [1], [kHz] Peak setting: After one sweep, [Next Menu], F5: Peak Search , F11: Peak Æ...
- Page 75 (3) Example for Occupied Frequency Bandwidth (Burst Wave) • For burst waves, set the detection mode to the Pos Peak mode. Measurement block diagram 0 dBm Digital modulation MT8801C signal source (PHS) • Center frequency : 1.9 GHz • Span frequency width : 800 kHz •...
- Page 76 Section 3 Operation Measurement procedure Step Operation procedure Press the spectrum analyzer [Preset] key. Span frequency setting: F2: Span , [8], [0], [0], [kHz] Reference level setting: F3: Amplitude , [0], [dBm] Center frequency setting: F1: Frequency , [1], [.], [9], [GHz] RBW setting: [Next Menu], F1: Coupled Function , F7: RBW, [1], [kHz] VBW setting: F12: return, F8: VBW, [1], [kHz] Sweep time setting: F12: return, F9: Sweep Time, [3], [s]...
- Page 77 3.10 Measurement (4) Example of Measurement of Adjacent Channel Leakage Power Measurement block diagram 0 dBm Digital modulation signal source MT8801C (PDC) • Center frequency : 900 MHz • Span frequency width : 250 kHz • RBW : 1 kHz •...
- Page 78 Section 3 Operation Measurement procedure Step Procedure Press the spectrum analyzer [Preset] key. Span frequency setting: F2: Span , [2], [5], [0], [kHz] Reference level setting: F3: Amplitude , [0], [dBm] Center frequency setting: F1: Frequency , [9], [0], [0], [MHz] RBW setting: [Next Menu], F1: Coupled Function , F7: RBW, [1], [kHz] VBW setting: F12: return, F8: VBW, [3], [kHz] Sweep time setting: F12: return, F9: Sweep Time, [1], [0], [s]...
- Page 79 (5) Example of Power Measurement (Time Domain) • Find the effective average value of the zone set by the two cursors on the screen. Measurement block diagram Trigger signal Digital modulation MT8801C signal source (PHS) Measurement zone Power level Start Point Stop Point •...
- Page 80 Section 3 Operation Measurement procedure Step Operation procedure Press the spectrum analyzer [Preset] key. Time domain setting: F2: Span , [0], [kHz] Reference level setting: F3: Amplitude , [2], [0], [dBm] Center frequency setting: F1: Frequency , [1], [.], [9], [GHz] RBW setting: [Next Menu], F1: Coupled Function , F7: RBW, [1], [MHz] Time span setting: F3: Trace-Time, F8: Time Span, [5], [ms] Reference level setting: After one sweep, [Next Menu], F5: Peak Search, F12: Peal Æ...
- Page 81 3.10 Measurement # Example of measured value: –5.24 dBm, 0.300 mW # To find the average power between burst frames, set the measurement zone to the burst frame time. (Example 2) # Applications: * Spurious radiation strength measurement (PDC, PHS) * Antenna power measurement (PDC, PHS) Zone Center = 500.008 000MH...
- Page 82 Section 3 Operation 3-72.
-
Page 83: Section 4 Peformance Tests
Section 4 Peformance Tests This section describes the test equipment, setup, and performance check procedure for testing the performance of the MT8801C Spectrum Analyzer function. Requirement for Performance Tests ......Instruments Required for Performance Test ..... Performance Tests ............ 4.3.1 Reference oscillator frequency stability .. -
Page 84: Requirement For Performance Tests
For preventive maintenance, periodically perform the performance check items that are important to your application. The recommended routine inspection interval is once or twice a year. If you find any item that does not satisfy the specifications, contact the Anritsu Ser- vice Department. -
Page 85: Instruments Required For Performance Test
4.2 Instruments Required for Performance Test Instruments Required for Performance Test The instruments required for performance tests are shown below. Instruments Required for Performance Test Test item Test equipment name Recommended model Reference Center frequency display Signal generator MG3633A 4.3.2 accuracy Frequency span display Signal generator... -
Page 86: Performance Tests
AC power supply voltage variations, noise, vibration, dust, and humidity. 4.3.1 Reference oscillator frequency stability Refer to the MT8801C mainframe performance check. 4.3.2 Center frequency display accuracy Apply a reference frequency with a known center frequency to the spectrum analyzer as shown in the figure below and set the center frequency and frequency span. - Page 87 Press the spectrum analyzer Preset key. Execute Cal. Set the MT8801C center frequency to 500 MHz. Set the frequency span in accordance with the table below. Read the marker frequency value, and check that it is within the maximum and minimum values shown in the table below.
-
Page 88: Frequency Span Display Accuracy
Read these frequencies with the marker, and find the span accuracy. (1) Test target specifications ±2.5% • Frequency span accuracy: (2) Test equipment • Synthesized signal generator: MG3633A (3) Setup Measure the frequency error with the SG. MT8801C Measure Cursor Single Continuous MT8801C Cancel Radio Communication Analyzer... - Page 89 Press the spectrum analyzer Preset key. Execute Cal. Set the MT8801C to Band: Band 0 and Center Freq: 1.5 GHz. Set the signal generator output to the first f1 frequency shown in the table below. Read the spectrum waveform peak marker frequency, and record it as f1’.
-
Page 90: Resolution Bandwidth And Selectivity
(1) Test target specifications • Resolution bandwidth: ±2% (300 Hz to 300 kHz), ±10% (1 MHz) ≤5 : 1 • Selectivity: (2) Test equipment • Synthesized signal generator: MG3633A (3) Setup MT8801C Measure Cursor Single Continuous MT8801C Cancel Radio Communication... - Page 91 4.3 Performance Tests (5) Test procedure Step Operation procedure Press the spectrum analyzer Preset key. Execute Cal. Set the MT8801C as follows: Trace-Time Freq: 100 MHz RBW (Manual): 1 MHz VBW (Manual): Value at which 60 dB down level is read smoothly.
- Page 92 Section 4 Peformance Tests Resolution Bandwidth Test 3 dB Effective Measurement Effective bandwidth lower limit uncertainty upper limit 903.8 kHz 109.62 kHz 1 MHz 295.14 kHz 304.86 kHz 300 kHz 98.38 kHz 101.62 kHz 100 kHz 29.514 kHz 30.486 kHz 30 kHz ±0.38 % 9.838 kHz...
-
Page 93: Sideband Noise Level
(1) Test target specifications ≤–95 dBc/Hz (frequency 1 GHz, 100 kHz offset) • Sideband noise (C/N): ≤–115 dBc/HZ (frequency 1 GHz, 10 kHz offset) (2) Test equipment • Synthesized signal generator: MG3633A (3) Setup MT8801C Measure Cursor Single Continuous MT8801C Cancel Radio Communication... - Page 94 Step Operation procedure Set the signal generator to 1 GHz, +10 dBm. Press the spectrum analyzer Preset key. Execute Cal. Set the MT8801C as follows: Center Freq: 1 GHz Span: 40 kHz (table below) Reference Level: +10 dBm Detection: Sample...
-
Page 95: Screen Amplitude Display Linearity
(2) Test equipments • Synthesized signal generator: MG3633A • Calibration receiver ML2530A • Power divider (3) Setup 10 MHz Reference Input 10 MHz Buffered Output MG3633A Synthesized signal MT8801C generator Measure Cursor Single Continuous MT8801C Cancel Radio Communication Analyzer 300kHz-3GHz... - Page 96 Set the signal generator to 101 MHz, –12 dBm. Execute Cal of the calibration receiver. Press the spectrum analyzer Preset key. Execute Cal. Set the MT8801C as follows: Center Freq: 101 MHz Span: 3 MHz Reference Level: 0 dBm Attenuator: 0 dB RBW: 1 kHz VBW: Minimum Press the Peak →...
-
Page 97: Frequency Response
±0.5 dB Input connector Aux, input ATT 10 dB ±0.5 dB (2) Test equipments • Signal generator: HP8665B • Power meter: ML4803A • Power sensor: MA4601A (3) Setup MT8801C Measure Cursor Single Continuous MT8801C Cancel Radio Communication Analyzer 300kHz-3GHz Copy... - Page 98 Section 4 Peformance Tests (5) Test procedure 1 Step Operation procedure Set the signal generator to 100 MHz, 0 dBm. Connect the signal generator output to the power sensor of the power meter through a coaxial cable. Read the power meter display. Change the signal generator output frequency as shown in the table, and find the calibration value at each frequency referenced to the level at 100 MHz.
- Page 99 4.3 Performance Tests Frequency Response Test (Aux Input) Effective Effective Measurement Calibration Deviation Test frequency Delta marker level (dB) uncertainty lower limit upper limit value (dB) (dB) 100 MHz 0 (reference) 0 (reference) 0 (reference) 200 MHz 500 MHz 1 GHz ±0.17 dB 1.5 GHz –0.33 dB...
-
Page 100: Reference Level Accuracy
• Calibration receiver: ML2530A • Power meter: ML4803A • Power sensor: MA4601A • Power divider (3) Setup 10 MHz Reference Input 10 MHz Buffered Output MG3633A Synthesized signal MT8801C generator Measure Cursor Single Continuous MT8801C Cancel Radio Communication Analyzer 300kHz-3GHz... - Page 101 Operation procedure Initialize the MT8801C, the signal generator, and the calibration receiver. Execute Cal of the MT8801C, the calibration receiver, and power meter. Connect the divider OUTPUT connector to the power sensor. Set the signal generator frequency to 100 MHz, and adjust the signal generator level so that the power meter indicates +10 dBm.
- Page 102 Section 4 Peformance Tests Reference Level Accuracy Test (Aux Input) Set value of Set value of output level Error (P1 - P0) Measurement Effective Effective of signal generator Reference Level (dB) uncertainty lower limit upper limit 0 dB +10 dBm –0.28 dB +0.28 dB 10 dB...
-
Page 103: Average Noise Level
≤–85 dBm (>2.2 GHz) At Aux connector, input attenuator 0 dB ≤–110 dBm (10 MHz to 2.2 GHz) ≤–105 dBm (>2.2 GHz) (2) Test equipment • No-reflection terminator: MP752A (3) Setup MT8801C Measure Cursor Single Continuous MT8801C Cancel Radio Communication... - Page 104 Section 4 Peformance Tests (4) Test procedure Step Operation procedure Press the spectrum analyzer Preset key. Execute Cal. Terminate the spectrum analyzer Aux Input connector with the MP752A No-reflection terminator. Set the spectrum analyzer as follows: Start Freq: 10 MHz Stop Freq: 2.2 GHz Reference level: –50 dBm Attenuator: 0 dB...
-
Page 105: Residual Response
(1) Test target specifications • Residual response: ≤ –70 dBm (Main connector, input attenuator 20 dB) ≤ –90 dBm (AUX connector, input attenuator 0 dB) (2) Test equipment • No-reflection terminator: MP752A or equivalent (3) Setup MT8801C Measure Cursor Single Continuous MT8801C Cancel... - Page 106 (4) Test Procedure Step Operation procedure Press the MT8801C Preset key. Set the MT8801C as follows on the Instrument Setup screen, then move to the Spectrum Analyzer screen. RF Input/Output: Main Set the spectrum analyzer as follows: Band: Band 1 Ref.
-
Page 107: Second Harmonic Distortion
≤–60 dBc (input frequency 100 to 1500 MHz) (2) Test equipments • Signal generator: MG3633A • LPF: Device with an attenuation of at least 70 dB at double the fundamental frequency (3) Setup MT8801C Measure Cursor Single Continuous MT8801C Cancel... - Page 108 Section 4 Peformance Tests (4) Test procedure Step Operation procedure Press the spectrum analyzer Preset key. Execute Cal. Set the LPF cutoff frequency to approximately 12.8 MHz. Set the signal generator output to 10 MHz, –30 dBm. Set the spectrum analyzer as follows: Center Freq: 10 MHz Span: 10 kHz Reference Level: –30 dBm...
-
Page 109: Resolution Bandwidth (Rbw) Switching Deviation
This performance check measures the peak level deviation when the resolution band- width (RBW) is switched. (1) Test target specifications • Resolution bandwidth switching deviation: ±0.1 dB referenced to 3 kHz resolution bandwidth (2) Test equipment • Signal generator: MG3633A (3) Setup MT8801C Measure Cursor Single Continuous MT8801C Cancel Radio Communication... - Page 110 Section 4 Peformance Tests (4) Test procedure Step Operation procedure Press the spectrum analyze Preset key. Execute Cal. Set the signal generator output to 100 MHz, 0 dBm. Set the spectrum analyzer as follows: Center Freq: 100 MHz Span: 15 kHz Reference Level: 0 dBm RBW: 3 kHz Input terminal: Aux Input...
-
Page 111: Performance Test Results Entry Form Examples
4.3 Performance Tests 4.3.13 Performance test results entry form examples Examples of forms for summarizing the results of MT8801C Spectrum Analyzer function performance checks are shown below. When making performance checks, copy and use this section. Center frequency display accuracy... - Page 112 Section 4 Peformance Tests Resolution bandwidth and selectivity Resolution Bandwidth and Selective Test 3 dB Effective Measurement Effective bandwidth lower limit uncertainty upper limit 903.8 kHz 109.62 kHz 1 MHz 295.14 kHz 304.86 kHz 300 kHz 98.38 kHz 101.62 kHz 100 kHz 29.514 kHz 30.486 kHz...
- Page 113 4.3 Performance Tests Screen amplitude display linearity Error (B − A) Set value of output level Measurement Effective Effective of signal generator (dB) uncertainty lower limit upper limit RBW=1 kHz RBW=30 kHz RBW=1 MHz (Reference) (Reference) (Reference) –10 ±0.03 dB ±0.03 dB –0.47 dB +0.47 dB –20...
- Page 114 Section 4 Peformance Tests Reference level accuracy Reference Level Accuracy Test (Aux Input) Set value of Set value of output level Error (P1 - P0) Measurement Effective Effective of signal generator Reference Level (dB) uncertainty lower limit upper limit 0 dB +10 dBm –0.28 dB +0.28 dB...
- Page 115 4.3 Performance Tests 10. Second harmonic distortion Signal generator Delta marker Measurement Effective Rating output frequency cutoff frequency level uncertainty upper limit 12.8 MHz –55 dBc –56.2 dB 10 MHz ±1.2 dB 1.2 GHz –60 dBc –61.2 dB 1 GHz 11.
- Page 116 Section 4 Peformance Tests 4-34.
-
Page 117: Appendixes
Appendixes Appendix A Soft-Key Menu..........A-1 Appendix B Keywords Index ..........B-1 App-1... - Page 118 Appendixes App-2.
-
Page 119: Appendix A Soft-Key Menu
Appendix A Soft-Key Menu In this section, soft-key menu functions and its hierarchical system are described us- ing a tree. Matters to be noted about the tree are shown below. Main function Key indicates [F1 to F6] key on the front panel. Function Key are the menus at the top level which are displayed on the right side of screen when the [F7 to F12] key is pressed. - Page 120 Appendix A Soft-Key Menu Menu Tree ( 1 / 9 ) ––– Main Function Key ––– | ––– Function Key ––– | ––– Low Menus ––––––––––––––––––––––––––––––––––––– Sets the center frequency, start/stop frequencies, Peak → CF Freqency • Freqency and, center frequency step size. Center Freq Start...
- Page 121 Appendix A Soft-Key Menu Menu Tree ( 2 / 9 ) ––– Main Function Key ––– | ––– Function Key ––– | ––– Low Menus ––––––––––––––––––––––––––––––––––––– Amplotude Log Scale Amplotude Reference 10dB/DIV Level Peak→RLV 5dB/DIV Ref Step 1DIV Long 2dB/DIV Scale 2DIV Disp Line...
- Page 122 Appendix A Soft-Key Menu Menu Tree ( 3 / 9 ) ––– Main Function Key ––– | ––– Function Key ––– | ––– Low Menus ––––––––––––––––––––––––––––––––––––– Zone Width Maker • Selects normal marker/delta marker/no Marker marker, and sets the zone marker width, Normal Spot MARKER →, zone sweep on/off, etc.
- Page 123 Appendix A Soft-Key Menu Menu Tree ( 4 / 9 ) ––– Main Function Key ––– | ––– Function Key ––– | ––– Low Menus ––––––––––––––––––––––––––––––––––––– Peak • Sets the peak level search, next peak/next right peak/next left peak Peak Search search, Peak →, Marker →, search level resolution, threshold level Normal...
- Page 124 Appendix A Soft-Key Menu Menu Tree ( 5 / 9 ) ––– Main Function Key ––– | ––– Function Key ––– | ––– Low Menus ––––––––––––––––––––––––––––––––––––– Coupled F Coupled Function Manual Auto Manual Sweep Sweep Time Time Auto Manual Attenuator RB,VB,SWP Auto Auto...
- Page 125 Appendix A Soft-Key Menu Menu Tree ( 6 / 9 ) ––– Main Function Key ––– | ––– Function Key ––– | ––– Low Menus ––––––––––––––––––––––––––––––––––––– Trace-Freq Trace-Freq Storage Storage Trace-A Normal Cumulative Trace-B Hold Count Sweep Overwrite Max Hold Count Trace AonB Min Hold...
- Page 126 Appendix A Soft-Key Menu Menu Tree ( 7 / 9 ) ––– Main Function Key ––– | ––– Function Key ––– | ––– Low Menus ––––––––––––––––––––––––––––––––––––– Trace-Time Source • Selects time domain (zero span) display. Trace-Time Sets the delay time, time span, trigger mode, Delay Time 10.0ms trigger source, storage mode, detection mode,...
- Page 127 Appendix A Soft-Key Menu Menu Tree ( 8 / 9 ) ––– Main Function Key ––– | ––– Function Key ––– | ––– Low Menus ––––––––––––––––––––––––––––––––––––– Measure Noise C/N Ratio Measure Noise Meas On Measure C/N Ratio Measure Occ BW Measure Adj Ch Pwr Measure...
- Page 128 Appendix A Soft-Key Menu Menu Tree ( 9 / 9 ) ––– Main Function Key ––– | ––– Function Key ––– | ––– Low Menus ––––––––––––––––––––––––––––––––––––– (Previous Page) Burst Avg Execute Start Point Stop Point return A-10...
- Page 129 Appendix A Soft-Key Menu Soft-key Menu List Menu Menu Tree (page/ 9 ) A) Active trace Ajd ch Pwr Measure Amplitude Attenuator 2, 5 Average Averaging Count B Band Burst Avg Power C) C/N Ratio Measure Center Freg CF Step Size Coupled Function Cumulative D) Delay Time...
- Page 130 Appendix A Soft-Key Menu Menu Menu Tree (page/ 9 ) P) Peak Search Peak → CF Peak → RLV Pos Peak R) RBW Reference Level Ref Level Step Size Resolution Restart S) Sample Span Start Freq Stop Freq Storage 6, 7 Sweep Time Sweep Count T) Threshold...
-
Page 131: Appendix B Keywords Index
Appendix B Keywords Index The followiong lists the main keywords used in this operation manual and the number of the pages on which they are used. Use it to search for the soft keys, function descriptions, etc. - Page 132 Appendix B Keywords Index [KEYWORDS INDEX] Key Word Paragraph No. *Mark 3.1.2 1 div 3.5.1 (1) Absolute Value 3.5.7 (1) A on B 3.8.1 (3) Abobe Below 3.6.6 3.5.7 (1) Active Trace A B 3.8.1.(4) Adj ch pwr Measure 3.10.1.(4), 3.10.2.(4) Adjacent Channel Leakage Power 3.10.1.(4), 3.10.2.(4) All Auto...
- Page 133 Appendix B Keywords Index Key Word Paragraph No. C/N Ratio Measure 3.10.1 (2), 3.10.2 (1) C/N Ratio 3.10.1 (2), 3.10.2 (1) 3.7.4 Cancel 2.1.1, 3.1.1 Center-Span 3.3.1 CF Step Size 3.3.3 Ch BW 3.10.1 (4), 3.10.2 (4) Ch Sepa-1 3.10.1 (4), 3.10.2 (4) Continuous 2.1.1, 3.9.1 Continuous Sweep Mode...
- Page 134 Appendix B Keywords Index Key Word Paragraph No. Floppy Disk 2.5, 3.1.3 Free run 3.9.3 (1) Free run / Trigger 3.9.3 (1) Frequency 3.1.1 Frequency Domain 3.8.1 Frequency Span 3.3.1 (2), 3.3.4 Full Span 3.3.4 (1) Function Key 2.1.1, 3.1.2 Gate Cursor 3.9.6 Gate Control Signal...
- Page 135 Appendix B Keywords Index Key Word Paragraph No. Max Hold 3.8.3, 3.8.4 Measure 3.10.1 Measurement Envelop 3.8.7 Measuring Noise Power 3.10.1 (1), 3.10.2 (2) Measuring Power 3.10.1 (2) Measuring Occupied Bandwidth 3.10.1 (3) Mkr → CF 3.5.4 Mkr → RLV 3.5.4 N% of Power 3.10.1 (3), 3.10.2 (3)
- Page 136 Appendix B Keywords Index Key Word Paragraph No. RB, VB, SWT Auto 3.7.1 3.7.1 Ref Level Step Size 3.4.3 Reference Marker 3.5.3 Reference Level Set 3.4.1 3.5.7 (1) Resolution dB 3.6.5 Restart 3.8.4, 3.8.5 Sample 3.8.7, 3.8.8 Sample Point 3.8.7 Search Above Below 3.6.6 Search...
- Page 137 Appendix B Keywords Index Key Word Paragraph No. Threshold 3.6.6 Time Gate Function 3.9.4 Time Span 3.8.2 (2) (3) Trace A 3.8.1 (1) Trace A on B 3.8.1 (3) Trace B 3.8.1 (2) Trace Memory 3.8.7 Trace Time 3.6.5 Trig Slope 3.9.3 (3) Trigger Freerun 3.8.2 (2), 3.9.3 (2)
Need help?
Do you have a question about the MT8801C and is the answer not in the manual?
Questions and answers