Table of Contents

Related Manuals for Fluke OptiView III Series


Summary of Contents for Fluke OptiView III Series
- Page 1 OptiView Series III Integrated Network Analyzer Getting Started Guide PN 2720569 November 2006 © 2004 - 2006 Fluke Corporation. All rights reserved. Printed in USA. All product names are trademarks of their respective companies.
- Page 2 Fluke Networks authorized resellers shall extend this warranty on new and unused products to end- user customers only but have no authority to extend a greater or different warranty on behalf of Fluke Networks. Warranty support is available only if product is purchased through a Fluke Networks authorized sales outlet or Buyer has paid the applicable international price.
- Page 3 Cryptix General License Note This Cryptix General License only applies to the data encryption software used by the OptiView remote user interface. Copyright © 1995-2006 The Cryptix Foundation Limited. All rights reserved. Cryptix is a trademark of The Cryptix Foundation Limited. Copyright ©...
-
Page 5: Table Of Contents
Before You Start ....................1 Safety Information..................1 Cleaning the Analyzer................2 Has This Instrument Been Damaged in Shipping? ........2 Contacting Fluke Networks Sales, Service, and Support Centers..... 3 Series III Integrated Network Analyzer Support ....3 OptiView Updating Your Analyzer ................3 The Analyzer and Accessories................. - Page 6 OptiView Series III Getting Started Guide Generating Network Traffic..............28 Measuring Bidirectional Data Flow – The Throughput Option....28 Testing Network Cables................28 Setting Up a Printer .................. 29 Changing the SFP Fiber Adapter .............. 30 Windows Network Configuration............. 30 Using the OptiView Browser and User Interface Software ....
- Page 7 Contents (continued) Unexpected IP Discovery or Device Details results? ......51 Do the touch targets seem to be off?............. 52 Are you connected to the network?............52 Does Cable Test pass? ................52 Does the battery charge state appear erratic or inconsistent, or is the battery not consistently holding a normal charge?......
- Page 8 OptiView Series III Getting Started Guide...
-
Page 9: Before You Start
Before You Start Safety Information The following symbols are used on the product and in this document: NOT FOR CONNECTION TO PUBLIC TELEPHONE SYSTEMS PLEASE READ MANUAL FOR SAFETY COMPLIES WITH EUROPEAN UNION DIRECTIVE SHOCK HAZARD CLASS 1 LASER PRODUCT. DO NOT LOOK INTO LASER RECYCLE LITHIUM ION BATTERIES COMPLIES WITH CAN/CSA-C22.2 NO. -
Page 10: Cleaning The Analyzer
OptiView Series III Getting Started Guide • No serviceable parts. Do not try to service. • Do not connect a telephone line to this product. • If this product is used in a manner not specified by the manufacturer, the protection provided by the product may be impaired. -
Page 11: Contacting Fluke Networks Sales, Service, And Support Centers
Integrated Network Analyzer Before You Start Contacting Fluke Networks Sales, Service, and Support Centers To order accessories or get the location of the nearest Fluke Networks distributor or service center, visit the Fluke Networks contact website at www.flukenetworks.com/contact. Send email to support@flukenetworks.com. -
Page 12: The Analyzer And Accessories
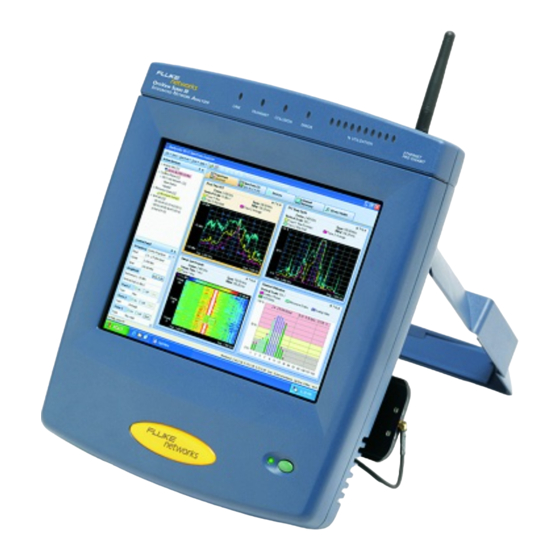
OptiView Series III Getting Started Guide The Analyzer and Accessories The analyzer is designed for troubleshooting and monitoring Local Area Networks (LANs). The analyzer tests all seven OSI layers. It tests from the cable to the application layer and everything in between, so problems have nowhere to hide. OptiView Series III supports 10/100/1000 Ethernet through 10/100/1000 Port (RJ-45 jack) along with a 1000BASE-X port (fiber optic interface) that supports... -
Page 13: Supplied Items
FTP Server software, OptiView Help, and Getting Started Guide (Multiple languages in PDF format). Fluke Networks can serve you best by registering Registration Card online at www.flukenetworks.com. If you cannot register online, please fill out and return the supplied registration card. - Page 14 OptiView remote user interface on a PC. OptiView Expert Adds expert analysis to the Fluke OptiView Integrated OPVS2-EXPT Analysis Option Protocol Expert application on the analyzer. When you purchase this option, you are given a key code that will need to be entered in the OptiView Integrated Protocol Expert application’s Tools | Add New Plug-in “Adding...
- Page 15 Throughput option is accessed, with a maximum of one decrement per day. OptiView Wireless Wireless Network Analyzer contains a Fluke Networks OPV-WNA Network Analyzer PCMCIA wireless network card and software. This option installs in an OptiView Analyzer and provides key wireless configuration and usage information.
-
Page 16: Using The Analyzer
OptiView Series III Getting Started Guide Using the Analyzer Peripheral Support The analyzer provides the following external accessory connectors: PC Card (multi bus PCMCIA) Three USB ports VGA-out DB-15 (see Using the VGA Out Port, later in this manual, for specific information) Registering the OptiView Analyzer... -
Page 17: Verifying The Basic Analyzer Operation
Integrated Network Analyzer Using the Analyzer Caution Make sure all user-installed applications are shut down before powering the analyzer off with the On/Off button. User installed applications may interfere with standby. If the analyzer is left in standby for an extended period of time (days), and the analyzer does not come out of standby by pressing the On/Off button, both the internal and external batteries are probably fully discharged. - Page 18 OptiView Series III Getting Started Guide aww50s.bmp Figure 2. Front Page Screen (Connected to Network) Figure 3 shows an example of the analyzer Front Page screen when it is not connected to a network (no network cable connected). aww51s.bmp Figure 3. Power-up Completion - Analyzer Front Page - No Cable Connected...
-
Page 19: Running The Analyzer On Internal And External Batteries
Integrated Network Analyzer Using the Analyzer Running the Analyzer on Internal and External Batteries The analyzer comes with an internal Lithium-Ion battery which is capable of powering the analyzer for approximately 45 minutes. An external Lithium-Ion battery is shipped with each analyzer. It attaches to the back of the analyzer (see “Connecting the External Battery”... -
Page 20: Connecting The External Battery
OptiView Series III Getting Started Guide Connecting the External Battery Note The external battery can be connected or removed with the analyzer powered on. The external battery is connected to the back of the analyzer as shown in Figure 4. First, slide the external battery tabs into the tab slots on the bottom of the back of the analyzer. -
Page 21: Charging The Internal And External Batteries
Integrated Network Analyzer Using the Analyzer Charging the Internal and External Batteries The external battery and AC adapter/charger (hereafter referred to as the charger) are shipped with every OptiView analyzer. The charger will charge both the internal and external batteries while operating the analyzer. The internal battery takes approximately 5 hours to fully charge (see note on page 8 about initially charging the batteries). - Page 22 OptiView Series III Getting Started Guide The external battery can take up to 5 hours to fully charge. When it is connected to the analyzer, and the analyzer is on, it will not begin charging until the internal battery is close to fully charged (approximately 80% charged). If the analyzer is off, both the internal and external batteries will charge at the same time.
-
Page 23: Power Management
Integrated Network Analyzer Using the Analyzer ahq31f.eps Figure 6. External Battery Charge Status Button By pressing the Charge Status button, the appropriate number of LEDs turn on and indicate the charge state as shown in Table 4. Power Management aww52s.bmp Figure 7. -
Page 24: Using The Front Panel Touch Display
OptiView Series III Getting Started Guide Using the Front Panel Touch Display A stylus or your finger can be used on the touch panel display. Display setup is customized by going to the Setup | Display screen. There you will find the Graphic Controller…... -
Page 25: Using The Virtual Keyboard And Ip Keypad
Integrated Network Analyzer Using the Analyzer Using the Virtual Keyboard and IP Keypad The analyzer is shipped with a virtual keyboard and an IP keypad. The virtual keyboard allows both text and numeric entry, while the IP keypad allows easy entry of IP addresses. - Page 26 OptiView Series III Getting Started Guide The virtual keyboard can be closed by pressing the close button . If you close the virtual keyboard, the icon will no longer be visible in the upper-right corner of the screen. You can start the virtual keyboard through the Windows Start | All Programs menu by selecting Touch Keyboard | Touch Keyboard.
-
Page 27: Right-Clicking The Mouse
Integrated Network Analyzer Using the Analyzer Right-clicking the Mouse Note The analyzer user interface does not require any right-clicking of the mouse. This is provided as a touch panel convenience for use with other applications. To do an equivalent right-click of the mouse with the touch panel display: On the desktop, in the system tray , select the mouse icon (Event Selector) -
Page 28: Extending The Stand, Finding The Stylus
OptiView Series III Getting Started Guide Stylus PC Card Stylus stores at bottom of stand Pull on the recessed portion of the stand to open aww03f.eps Figure 11. USB Connectors Extending the Stand, Finding the Stylus Figure 11 shows the stand extended. To open the stand, pull at the recessed portion located at the bottom of the stand. -
Page 29: Analyzer Network Connections
Integrated Network Analyzer Using the Analyzer Analyzer Network Connections Figure 12 shows the top view of the OptiView Series III Analyzer. VGA Out Port aww10f.eps Figure 12. Top View of the OptiView Series III Integrated Network Analyzer Setting Up the Analyzer to Test Your Network Simply turn on the analyzer and connect a cable from the 10/100/1000 BASE-T connector (or fiber cable) to the network. -
Page 30: Led Status
OptiView Series III Getting Started Guide LED Status aww15f.eps Figure 13. Analyzer Status LEDs The LEDs on the front of the analyzer represent the following conditions: Link – Green indicates link present. Transmit - Indicates the analyzer is transmitting packets. Packets are transmitted while running Traffic Generator, and routinely transmitted by the analyzer discovery process. -
Page 31: Front Page Screen
Integrated Network Analyzer Using the Analyzer Note The 10/100/1000 port and 1000BASE-X fiber port on the top of the analyzer also show link and utilization. The 10/100/1000 port's left LED shows link as: 10Mb = green, 100Mb = blue, 1000Mb = white The 10/100/1000 and Fiber port's right LED shows utilization as: 10 - 50% utilization = green, 60 - 80% utilization = yellow, 90 - 100% utilization = red... - Page 32 OptiView Series III Getting Started Guide The percent complete indicator appears in the Front Page screen's Device Discovery and Network Discovery buttons while active discovery is running. When active discovery is completed, the discovery percent complete indicator goes away and passive discovery resumes.
- Page 33 (silent mode) is turned on in the Setup | Ethernet screen. This button generates tabular HTML reports on select screens. The reports are stored by default in C:\Program Files\Fluke Networks\OptiView\Reports. When this button is pressed you are prompted to specify a filename or to use the default name provided.
- Page 34 OptiView Series III Getting Started Guide to quickly dismiss some hypotheses during troubleshooting without "drilling-in." Some buttons show a (good) or (error) to draw your attention to potential problem areas. The OptiView analyzer button represents the configuration status of the analyzer. indicates that the analyzer passed power on self test and obtained a valid IP address for the local network.
- Page 35 Integrated Network Analyzer Using the Analyzer The Protocol Statistics button shows protocol mix information. The OptiView Analyzer continuously updates the protocol list based on protocols used on the network segment the analyzer is connected to. Pressing this button takes you to the Statistics | Protocols screen for more detail.
-
Page 36: Generating Network Traffic
Help for usage. Measuring Bidirectional Data Flow – The Throughput Option The Throughput option measures bidirectional data flow between two Fluke Networks devices. The Throughput test will communicate with either an OptiView Analyzer, an EtherScope Network Assistant, or a OneTouch. The Throughput option is purchased separately. -
Page 37: Setting Up A Printer
Integrated Network Analyzer Using the Analyzer MDI-X Network monitoring Cable test live network NIC testing Cable test open cable Cable test terminated cable aww06f.eps Figure 16. Cable Test Capabilities Note If you have purchased the optional OptiView Fiber Inspector product, it can be launched from the Cable Test screen by pressing button. -
Page 38: Changing The Sfp Fiber Adapter
OptiView Series III Getting Started Guide Changing the SFP Fiber Adapter To install a SFP Fiber adapter, remove the protect cap and simply slide the adapter into the fiber port until it clicks. To remove a SFP Fiber adapter, press and hold the tabs on the sides of the SFP adapter and pull gently out of the fiber port. - Page 39 Integrated Network Analyzer Using the Analyzer part of the data acquisition board. DO NOT modify the Windows IP address settings for the data acquisition board. You may add additional interfaces that have their own TCP/IP protocol settings. You may need to modify other network configurations such as WINS (the DNS server should be 192.168.111.112).
-
Page 40: Using The Optiview Browser And User Interface Software
OptiView Series III Getting Started Guide Using the OptiView Browser and User Interface Software The OptiView Browser allows you access to OptiView Integrated Network, Workgroup, and WAN analyzers through a user interface installed on your analyzer or PC. Note On your OptiView Series III Integrated Network Analyzer, the remote OptiView user interface session will display the IP address and name (if specified in the Setup | SNMP screen) in the user... - Page 41 Integrated Network Analyzer Using the Analyzer OptiView Series III OptiView Workgroup Analyzer Integrated Network Analyzer OptiView Series I and II OptiView WAN Analyzers Integrated Network Analyzer Launch user interface for selected analyzer Launch web browser for selected OptiView Integrated Network Analyzer Refresh Analyzer list Update firmware for selected...
-
Page 42: Refresh Analyzer List
OptiView Series III Getting Started Guide Refresh analyzer list Re-displays the analyzer list with current active analyzers. Launch user interface for selected analyzer Launches the user interface for the selected analyzer. The selected analyzer is the device that is highlighted in the OptiView Browser analyzer list or the IP address entered in the OptiView Browser IP address field. -
Page 43: Installing The Remote User Interface Software
Integrated Network Analyzer Using the Analyzer Installing the Remote User Interface Software The remote user interface software can be installed on the following operating systems: • Windows 2000 Professional SP4 or later • Windows 2000 Server SP4 or later • Windows 2000 Advanced Server SP4 or later •... -
Page 44: User Interface Events That Will Terminate A Remote Session
OptiView Series III Getting Started Guide aww46s.bmp Figure 20. OptiView Personal Web Server Home Page User Interface Events that will Terminate a Remote Session The active TCP/IP session between the user interface software and the analyzer can be severed under the following conditions: •... -
Page 45: Setting Up Security On The Analyzer
Integrated Network Analyzer Setting Up Security on the Analyzer Setting Up Security on the Analyzer Setting up the analyzer security is done in the Setup | Users, Setup | Remote, and Setup | SNMP screens. Each area is described in this section. Setup | Users Screen The User Accounts screen (Setup | Users) allows you to add and modify user security information. -
Page 46: User Account Rules
OptiView Series III Getting Started Guide By default, the following users have been pre-configured. aww83s.bmp Figure 22. Default Users The default user accounts can not be deleted. They can only be disabled and modified. As a user with administrative privileges, you may add new users and customize your own and other user’s security privileges. -
Page 47: User Account Properties
Integrated Network Analyzer Setting Up Security on the Analyzer • Users can change their own password • Maximum length of the user and password field is 40 characters • All characters are allowed for both the user and password fields •... - Page 48 OptiView Series III Getting Started Guide Administrator - When this check box is checked, the highlighted user is granted administrative privileges. Users with administrative privileges can: add, delete, modify rights, modify passwords, and see the list of users in the User Accounts screen Packet Capture - When this check box is checked, the highlighted user is given permission to use the Capture/Generate | Packet Capture Filter screen.
-
Page 49: Creating And Removing User Accounts
Integrated Network Analyzer Setting Up Security on the Analyzer When Remote user interface is disabled (unchecked) while a user is logged into that remote session, they will be prompted with the Login screen. The Login screen will only popup when they move between certain screens. -
Page 50: Changing A User Account Password
OptiView Series III Getting Started Guide Enter an account name up to 40 characters long. Any character may be used. Enter a password in the Password and Confirm Password fields. If you enter a password in this dialog, the account name will be automatically enabled in the User Accounts screen. -
Page 51: Setting The Analyzer Name
Integrated Network Analyzer Setting Up Security on the Analyzer Setting the Analyzer Name In the Setup | SNMP screen, the Analyzer Name field allows you to change the default analyzer name as seen in the Discovery | Devices screen and in the remote user interface OptiView Browser screen. -
Page 52: Entering The Location And Contact Information
Console Address The OptiView Console field enhances the interoperability of the analyzer and Fluke Networks' OptiView Console product. The address you enter should be the IP address of the PC running the OptiView Console agent. The analyzer will send packets to this address when it attaches to the network, and when the IP address of... -
Page 53: Setting The Syslog Server Ip Addresses
Setting Up Security on the Analyzer These packets assist the OptiView Console product in keeping its information current. OptiView Console maintains a special list of all Fluke Networks' products that are connected to the network and can even be used to launch a user interface session on any OptiView analyzer. -
Page 54: Other Security Measures
OptiView Series III Getting Started Guide Warning The encryption can be set from a remote UI, but should only be done on the analyzer to prevent unauthorized detection of the encryption key while it is being set. What this means is, a remote UI could be capturing packets while another remote UI is setting the data encryption, and capture the encryption key. -
Page 55: Installing Options
Integrated Network Analyzer Installing Options Installing Options Analyzer options that are purchased separately, such as the OptiView Internet Throughput option, require you to enter a unique key code in the Setup | Options screen. This unique 16-digit key code is given to you when you purchase the option. -
Page 56: Using The Built-In Help System
OptiView Series III Getting Started Guide Using the Built-in Help System Accessing and Navigating the Help System The help system is an integral part of the analyzer. While using the analyzer user interface, help can be accessed by selecting the Help button located on the bottom-right of the user interface screen. -
Page 57: Changing The Default Help Language
Integrated Network Analyzer Using the Built-in Help System ahq48s.tif Figure 33. Help Navigation Tabs You can also press the Back and Forward buttons to move to and from previous viewed topics. The Hide button collapses the left pane of the Help screen giving you more room to view Help topics. -
Page 58: Troubleshooting Your Analyzer
OptiView Series III Getting Started Guide Troubleshooting Your Analyzer Resetting and Powering the Analyzer Completely Off If you suspect the Windows environment has locked-up, you may have to reset the analyzer. This is done by pressing the Reset button. If you are not sure if the Windows environment or the analyzer (hardware) has locked-up, you may have to completely power-down the analyzer by forcing the power off as described below. -
Page 59: Before Calling Technical Support
Integrated Network Analyzer Troubleshooting Your Analyzer Before Calling Technical Support Before calling technical support, you can perform these basic analyzer troubleshooting steps to pinpoint many problems: Do you suspect Windows has locked up? If yes, press the Reset button (see Figure 35). Do you suspect the analyzer has locked up? If yes, completely power-down the analyzer. -
Page 60: Do The Touch Targets Seem To Be Off
OptiView Series III Getting Started Guide Do the touch targets seem to be off? Try touching around the target to verify if the touch target calibration is off (this is rare). If you suspect the touch target is off, select Setup | Display, press Touch Screen Controller…, then Calibrate. -
Page 61: Windows Configuration Precautions
Integrated Network Analyzer Troubleshooting Your Analyzer If none of the above corrects the problem, press and hold the On/Off button for 7 seconds to shutdown. Press the On/Off button again to power-up the analyzer. Note A Windows Restart (either holding the on/off button for 7 seconds or pressing Start | Shut Down | Shut down) will erase information collected on the data acquisition card. - Page 62 Attach an external USB keyboard. 2. Power-up or restart the analyzer. Keep pressing the F9 key during the boot-up sequence. At the point when the black screen with the Fluke Networks logo is briefly displayed, the F9 key needs to be pressed.
-
Page 63: Specifications
Integrated Network Analyzer Specifications Specifications Table 5. General Specifications Weight without external battery 2.2 kilograms (5.0 lbs) Weight with external battery 3.0 kilograms (6.6 lbs) Dimensions 26.0 x 23.4 x 6.4 centimeters (10.3 x 9.2 x 2.5 inches) LCD touch screen display 800 x 600 pixels, active color panel, CCFT backlight and bezel, touch pad LED indicators... -
Page 64: Supported Network Standards
OptiView Series III Getting Started Guide Supported Network Standards Table 6. Supported Network Standards LAN Interfaces Standard SNMP MIBs Used IEEE 10BASE-TX, RFCs: 1213, 1231, 1239, 1285, 1315, IEEE 100BASE-TX, 1493, 1512, 1513, 1643, 1757, 2021, IEEE 1000BASE-TX, 2108, 2115, 2127, 2495, 2496, 2515, IEEE 1000BASE-X 2558 Cable Types... - Page 65 Integrated Network Analyzer Specifications Approvals The AC Adapter/charger for the instrument has UL, CSA, CE , SEMKO, CCIB, BCIQ, and GS valid Electromagnetic Interference Complies to EN61326, Class A requirements. Connection to public The analyzer network interfaces are NOT FOR telephone network CONNECTION TO PUBLIC TELEPHONE SYSTEMS.
- Page 66 OptiView Series III Getting Started Guide...
Need help?
Do you have a question about the OptiView III Series and is the answer not in the manual?
Questions and answers