Table of Contents
Advertisement
Quick Links
MMDSP Debugger
TRACE32 Online Help
TRACE32 Directory
TRACE32 Index
TRACE32 Documents ......................................................................................................................
ICD In-Circuit Debugger ................................................................................................................
Processor Architecture Manuals ..............................................................................................
MMDSP .....................................................................................................................................
MMDSP Debugger ................................................................................................................
Introduction .......................................................................................................................
Brief Overview of Documents for New Users
Warning ..............................................................................................................................
Quick Start .........................................................................................................................
Troubleshooting ................................................................................................................
SYStem.Up Errors
FAQ .....................................................................................................................................
Configuration .....................................................................................................................
System Overview
CPU specific Implementations .........................................................................................
Breakpoints
Software Breakpoints
On-chip Breakpoints
On-chip Breakpoints on instructions
Downloading Program Code to the Video Core
Changing the FLAG Register
Memory Classes
CPU specific SYStem Commands ...................................................................................
SYStem.CONFIG
Daisy-chain Example
TapStates
SYStem.CONFIG.CORE
SYStem.CPU
SYStem.CpuAccess
SYStem.DictionaryReset
SYStem.JtagClock
SYStem.LOCK
MMDSP Debugger
Configure debugger according to target topology
©1989-2019 Lauterbach GmbH
1
Assign core to TRACE32 instance
Select the used CPU
Run-time memory access (intrusive)
Reset dictionary memory STN8810V
Define JTAG frequency
Lock and tristate the debug port
1
3
3
4
5
7
7
7
8
8
9
9
9
10
10
11
11
12
14
14
16
17
18
19
20
20
21
21
Advertisement
Table of Contents

Related Manuals for Lauterbach MMDSP


Summary of Contents for Lauterbach MMDSP
- Page 1 TRACE32 Documents ........................ ICD In-Circuit Debugger ........................ Processor Architecture Manuals .................... MMDSP ............................. MMDSP Debugger ........................ Introduction ........................Brief Overview of Documents for New Users Warning ..........................Quick Start ......................... Troubleshooting ........................ SYStem.Up Errors FAQ .............................
- Page 2 JTAG Connection ......................Mechanical Description of the 20-pin Debug Cable Electrical Description of the 20-pin Debug Cable Operation Voltage ......................Support ..........................Available Tools Compilers Target Operating Systems 3rd-Party Tool Integrations Products ..........................Product Information Order Information ©1989-2019 Lauterbach GmbH MMDSP Debugger...
-
Page 3: Introduction
(the document you are reading at the moment) is CPU specific, while all other parts of the online help are generic for all CPUs supported by Lauterbach. So if there are questions related to the CPU, the Processor Architecture Manual should be your first choice. - Page 4 Switch the target power ON. Configure your debugger e.g. via a start-up script. Power down: Switch off the target power. Disconnect the debug cable from the target. Close the TRACE32 software. Power OFF the TRACE32 hardware. ©1989-2019 Lauterbach GmbH MMDSP Debugger...
-
Page 5: Quick Start
D.S 0xE0000024 %be %b 0x80 ; only Video MMDSP (STN8810V) Start the MMDSP debugger, select the device prompt B:, if the device prompt is not active after the TRACE32-Software is started. Select the core on your target, if automatic detection is not possible: SYStem.CPU... - Page 6 The load command depends on the file format generated by your compiler. Be sure to load a file compiled for the correct core. A full description of the Data.Load command is given in the “General Commands Reference”. ©1989-2019 Lauterbach GmbH MMDSP Debugger...
-
Page 7: Troubleshooting
Troubleshooting SYStem.Up Errors No information available. No information available No information available ©1989-2019 Lauterbach GmbH MMDSP Debugger... -
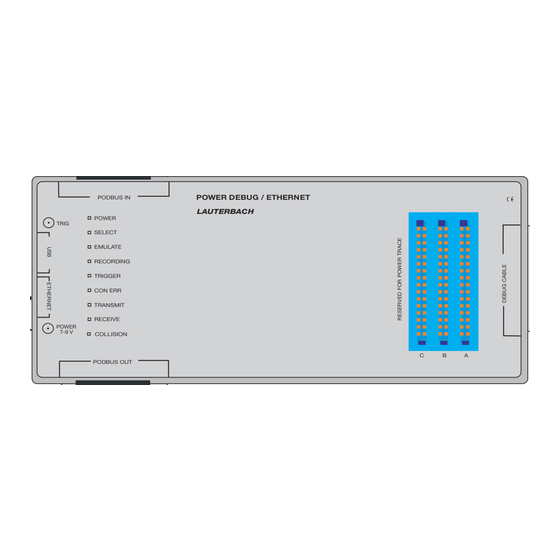
Page 8: System Overview
100 MBit Ethernet Target Debug Cable PODBUS IN POWER DEBUG / ETHERNET LAUTERBACH POWER TRIG SELECT Ethernet EMULATE RECORDING Cable TRIGGER CON ERR TRANSMIT RECEIVE POWER 7-9 V COLLISION PODBUS OUT POWER DEBUG / ETHERNET AC/DC Adapter ©1989-2019 Lauterbach GmbH MMDSP Debugger... -
Page 9: Cpu Specific Implementations
Software breakpoints • On-chip breakpoints For MMDSP it is only possible to set breakpoints when the clock is stopped. This applies to both software and on-chip breakpoints. Software Breakpoints In order to stop the program execution at a selected instruction, the code at the break location is patched by a software break instruction. -
Page 10: On-Chip Breakpoints
This implementation is called on-chip, because the debugger uses resources provided by the processor to set a breakpoint. The MMDSP core is equipped with 2 watchpoint/breakpoint units. The following list gives an overview of the usage of the on-chip breakpoints by TRACE32-ICD: •... -
Page 11: Downloading Program Code To The Video Core
Therefore the /verify option for the data.load command may produce false error message when used for download code to the video core. Changing the FLAG Register Changing the FLAG register through the debugger is not supported. ©1989-2019 Lauterbach GmbH MMDSP Debugger... -
Page 12: Memory Classes
The DBG memory class gives access to memory resources like host register, indirect host registers, and dictionary ram (Video core only). The mapping of these resources to addresses is arbitrary and does not relate to any MMDSP or system address mappings. The mapping is only valid in the context of the DBG memory class. - Page 13 Note that for MMDSP it is not possible to access memory through the debugger while the core is executing code. For not CPU-specific keywords, see non-declarable input variables “ICE/FIRE Analyzer Trigger Unit Programming Guide” (analyzer_prog.pdf). ©1989-2019 Lauterbach GmbH MMDSP Debugger...
-
Page 14: System Config
To bundle several cores in one processor as required by the system this command has to be used to define core and processor coordinates within the system topology. Further information can be found in SYStem.CONFIG.CORE. ©1989-2019 Lauterbach GmbH MMDSP Debugger... - Page 15 (default: OFF) If more than one debugger share the same debug port, all except one must have this option active. JTAG: Only one debugger - the “master” - is allowed to control the signals nTRST and nSRST (nRESET). ©1989-2019 Lauterbach GmbH MMDSP Debugger...
-
Page 16: Daisy-Chain Example
SYStem.CONFIG.IRPOST 8 ; IR Core A + B SYStem.CONFIG.DRPRE 1 ; DR Core D SYStem.CONFIG.DRPOST 2 ; DR Core A + B SYStem.CONFIG.CORE 0. 1. ; Target Core C is Core 0 in Chip 1 ©1989-2019 Lauterbach GmbH MMDSP Debugger... -
Page 17: Tapstates
TapStates Exit2-DR Exit1-DR Shift-DR Pause-DR Select-IR-Scan Update-DR Capture-DR Select-DR-Scan Exit2-IR Exit1-IR Shift-IR Pause-IR Run-Test/Idle Update-IR Capture-IR Test-Logic-Reset ©1989-2019 Lauterbach GmbH MMDSP Debugger... - Page 18 GUI uses a new chipindex according to its CORE= parameter of the configuration file (config.t32). If the system contains fewer chips than initially assumed, the chips must be merged by calling SYStem.CONFIG.CORE. ©1989-2019 Lauterbach GmbH MMDSP Debugger...
- Page 19 SYStem.CPU <cpu> <cpu>: ST8810A | ST8810V | STN8815A | STN8815V | STN8820A | STN8820V | STN8820 I … Selects the processor type. Default selection: STN8810A. STN881xA is the Audio DSP, STN881xV is the Video DSP. ©1989-2019 Lauterbach GmbH MMDSP Debugger...
- Page 20 StopAndGo, conditional breakpoints etc. For MMDSP the option NonStop reduces the functionality to tracing the program flow as no memory access can be performed by the debugger while the clock is running.
-
Page 21: System Lock
If the system is locked, no access to the debug port will be performed by the debugger. While locked, the debug connector of the debugger is tristated. The main intention of the lock command is to give debug access to another tool. ©1989-2019 Lauterbach GmbH MMDSP Debugger... -
Page 22: System Mode
In general the SYStem.MemAccess command controls how the debugger accesses system memories while the clock is running. Due to the design of MMDSP there is no way for the debugger to access memory resources without stopping the clock. Therefore the only possible selection for this option is denied. - Page 23 DSP core is in. For changing the DCU mode in the target, the FLAGS register needs to be modified in the target. SYStem.Option DIAG System diagnosis command Format: SYStem.DIAG [code [P1] [P2] [P3]] System diagnosis command. Execute only when demanded by LAUTERBACH support engineer. ©1989-2019 Lauterbach GmbH MMDSP Debugger...
- Page 24 SYStem.Option EnReset [ON | OFF] Default: OFF. The command controls whether the debugger will (ever) pull the reset line. As the MMDSP is normally used as "slave" in multi-core systems, the default setting for the option is OFF. Consequently the reset line will never be activated on default.
- Page 25 ; print the value of pThis SYStem.Option OP9compatible Compatibility mode OP9 Format: SYStem.Option OP9compatible [ON | OFF] This command enables the compatibility mode for the hcMOS 9 MMDSP+ core by setting the register COMPATIBLE_REG @ MMIO(0xF60A). ©1989-2019 Lauterbach GmbH MMDSP Debugger...
-
Page 26: System Reset
SYStem.RESet Reset all settings of the TRACE32 debugger to default values. NOTE: This does not reset the target system! SYStem.Softreset Soft reset of the core Format: SYStem.Softreset Performs a soft reset of the DSP core. ©1989-2019 Lauterbach GmbH MMDSP Debugger... - Page 27 Data.LOAD.Elf Load ELF file Format: Data.LOAD.Elf <filename> Downloads an ELF file to the target. Note that for MMDSP targets the debugger performs a soft reset for setting the program counter to the program entry point at P:0x0. Register.RESet Soft reset Format: Register.RESet...
- Page 28 StopAndGo is that for "stopandgo" the debugger will indicate real-time violations (red "s" in the bottom status line). Also, snooping is much faster than StopAndGo and thus done more frequently which results in a more detailed statistical analysis. ©1989-2019 Lauterbach GmbH MMDSP Debugger...
- Page 29 If the option TrOnchip.VarCONVert is set to ON, the breakpoint will automatically be converted into a single address breakpoint. This is the default setting. Otherwise an error message is generated. TrOnchip.state Display on-chip trigger window Format: TrOnchip.state Opens the TrOnchip.state window. ©1989-2019 Lauterbach GmbH MMDSP Debugger...
- Page 30 TrOnchip.RESet Set on-chip trigger to default state Format: TrOnchip.RESet Sets the TrOnchip settings and trigger module to the default settings. ©1989-2019 Lauterbach GmbH MMDSP Debugger...
-
Page 31: Jtag Connection
We strongly recommend to use a connector on your target with housing and having a center polarization (e.g. AMP: 2-827745-0). A connection the other way around indeed causes damage to the output driver of the debugger. ©1989-2019 Lauterbach GmbH MMDSP Debugger... - Page 32 JTAG connector is tristated by the debugger and it is pulled low otherwise. This signal is normally not required, but can be used to detect the tristate state if more than one debug tools are connected to the same JTAG port. ©1989-2019 Lauterbach GmbH MMDSP Debugger...
-
Page 33: Operation Voltage
Operation Voltage Adapter OrderNo Voltage Range JTAG Debugger for MMDSP (ICD) LA-7836 1.8 .. 3.6 V ©1989-2019 Lauterbach GmbH MMDSP Debugger... -
Page 34: Available Tools
Support Available Tools A9500 A9540 DB8500 DB8540 STN8810 STN8815 STN8820 Compilers Language Compiler Company Option Comment MMDSP+ STMicroelectronics ELF/DWARF Target Operating Systems Not supported yet. ©1989-2019 Lauterbach GmbH MMDSP Debugger... - Page 35 Razorcat Development Windows GmbH DA-C RistanCASE Windows TRACEANALYZER Symtavision GmbH Windows ECU-TEST TraceTronic GmbH Windows UNDODB Undo Software Linux TA INSPECTOR Vector Windows VECTORCAST UNIT Vector Software Windows TESTING VECTORCAST CODE Vector Software Windows COVERAGE ©1989-2019 Lauterbach GmbH MMDSP Debugger...
-
Page 36: Product Information
This is needed if you want to connect the Debug Cable without a Preprocessor and if there is only a Mictor on the target. Suitable for MMDSP and ARC as well. Order Information Order No.
Need help?
Do you have a question about the MMDSP and is the answer not in the manual?
Questions and answers