Hioki IM3570 Instruction Manual
Impedance analyzer
Hide thumbs
Also See for IM3570:
- Instruction manual (76 pages) ,
- Communication instruction manual (74 pages) ,
- Instruction manual (66 pages)

Related Manuals for Hioki IM3570


Summary of Contents for Hioki IM3570
- Page 1 IM3570 Instruction Manual IMPEDANCE ANALYZER Dec. 2018 Revised edition 8 IM3570A981-08 18-12H...
-
Page 3: Table Of Contents
Contents Contents 4.2.3 Setting the Measurement Range ..49 Setting AUTO Ranging ......49 Chapter 1 Overview Setting the Ranging to HOLD ....51 Low Z High Accuracy Mode ..... 53 Product Overview Features ....9 4.2.4 Perform Measurements with User-defined Names and Functions of Parts ... - Page 4 Contents Setting the Upper or Lower Limit Value as a 5.2.3 Setting the Trigger ......137 Percentage (%) Relative to a Reference Value 5.2.4 Setting the Display Timing ....139 (Percentage mode) ......... 98 5.2.5 Setting the Trigger Delay ....140 ...
- Page 5 Contents 5.9.2 Detecting OPEN during 2-terminal Mea- surement (HIGH-Z Reject Function) 222 Chapter 6 Continuous 5.9.3 Setting the Detection Sensitivity for Measurement Function Measurement Errors (Overflow or Underflow) ....224 Initial Screen ........265 5.9.4 Setting the Delay Time from the Output Setting Continuous Measurement ..266 of Comparator Judgment Results until Performing Continuous Measurement...
- Page 6 Contents 11.2.1LCR Measurement ......369 11.2.2Analyzer Measurement ....372 Chapter 9 Saving and Loading 11.2.3Continuous Measurement Panel Information (Sequential Operation) ..... 373 11.2.4Continuous Measurement Saving Measurement Conditions (Step Operation) ......375 (Panel Save Function) ......317 11.3 Internal Circuitry ....... 376 Loading Measurement Conditions ...
- Page 7 Contents Appendix Appendix 1 Measurement Parameters and Arithmetic Expressions .....A 1 Appendix 2 Measurement of High Impedance . Components ......A 3 Appendix 3 Measurement of In-circuit Components ......A 4 Appendix 4 Countermeasures Against Incorporation of External Noise A 5 Appendix 5 Supplying DC Bias....A 7 Appendix 6 The Residual Charge Protection Function ........A 10 Appendix 7 Series Equivalent Circuit Mode and...
- Page 8 Contents...
- Page 9 Introduction Introduction Thank you for purchasing the HIOKI Model IM3570 Impedance Analyzer.To obtain maximum perfor- mance from the instrument, please read this manual first, and keep it handy for future reference. In this document, the "instrument" means the Model IM3570 Impedance Analyzer.
- Page 10 Safety Information Safety Information This instrument is designed to comply with IEC 61010 Safety Standards, and has been thoroughly tested for safety prior to shipment. However, mishandling during use could result in injury or death, as well as damage to the instrument. However, using the instrument in a way not described in this manual may negate the provided safety features.
- Page 11 Safety Information Notation Marks for individual functions Indicates the function is enabled in LCR mode. ANALYZER Indicates the function is enabled in ANALYZER mode. CONTINUOUS Indicates the function is enabled in CONTINUOUS mode. Symbols in this manual Indicates the prohibited action. ...
- Page 12 Before using the instrument the first time, verify that it operates normally to ensure that the no damage occurred during storage or shipping. If you find any damage, contact your dealer or Hioki representative. Before using the instrument, make sure that the insulation on the voltage cords is undamaged and that no bare conductors are improperly exposed.
- Page 13 Operating Precautions Shipping precautions Hioki disclaims responsibility for any direct or indirect damages that may occur when this instrument has been combined with other devices by a systems integrator prior to sale, or when it is resold. Handling the Instrument •...
- Page 14 Operating Precautions About Handling of Cords and Fixtures • For safety reasons, disconnect the power cord when the instrument is not used.To avoid damaging the power cord, grasp the plug, not the cord, when unplugging it from the power outlet. •...
- Page 15 Never use abrasives or solvent cleaners. • Hioki shall not be held liable for any problems with a computer system that arises from the use of this CD, or for any problem related to the purchase of a Hioki product.
- Page 16 Operating Precautions...
-
Page 17: Chapter 1 Overview
Chapter 1 Overview 1.1 Product Overview Features The HIOKI IM3570 impedance analyzer is an impedance measuring instrument which achieves high speed and high accuracy. It has two functions: an impedance analyzer capable of the sweep measurement of frequencies and mea- surement signals, and an LCR meter capable of simultaneously displaying up to four items under individ- ual measurement conditions. -
Page 18: Names And Functions Of Parts
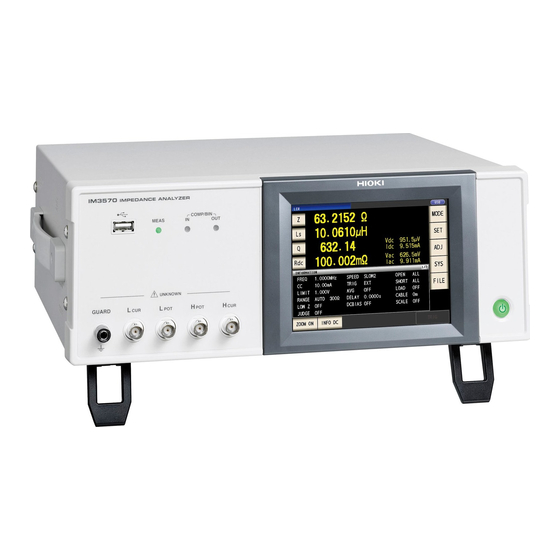
1.2 Names and Functions of Parts 1.2 Names and Functions of Parts Front Measurement LEDs Judgment Result LCD Display Indication LEDs Lights during measurement. This is a touch panel display. Press the keys displayed on the Indicates the judgment results for screen to operate the instrument. - Page 19 The RS-232C interface can be used to connect to a PLC or computer. (Communication Instruction Manual "Chapter 2” (CD)) You can connect the IM3570 to an RS-232C printer in order to print data. (p. 381) Manufacturer's Serial Number Shows the serial number.
-
Page 20: Screen Configuration And Operation
1.3 Screen Configuration and Operation 1.3 Screen Configuration and Operation This instrument allows you to use a touch panel to set and change all measurement conditions. Gently touch a key on the screen to select the item or numerical value set for that key. A selected key turns black. -
Page 21: Measurement Mode Selection Screen
1.3 Screen Configuration and Operation 1.3.2 Measurement Mode Selection Screen Select the measurement mode. Procedure LCR Initial Screen Press Mode Selection Select the measurement mode.Select LCR measurement (p. 37) ANALYZER measurement (p. 131) CONTINUOUS measurement (p. 265) Initial screen is displayed. -
Page 22: Advanced Settings Screen
1.3 Screen Configuration and Operation 1.3.3 Advanced Settings Screen This screen is for configuring the measurement conditions you want to change and other advanced settings. Select the measurement mode (p. 13) before configuring the advanced settings. Procedure LCR Initial Screen Press LC on figure the settings of each of the LCR mode, analyzer mode, and continuous measure- ment mode. - Page 23 1.3 Screen Configuration and Operation DC resistance measurement setting Measurement signal level setting (p. 66) Measurement range setting (p. 69) DC adjustment setting (p. 75) Measurement speed setting (p. 77) Voltage and current limit settings (p. 78) Average setting (p. 80) Initial screen is displayed.
- Page 24 1.3 Screen Configuration and Operation Checking the setting information You can check the settings on the measurement screen. Displays information regarding the AC signal. Displays information regarding the DC signal.
- Page 25 1.3 Screen Configuration and Operation ANALYZER Mode Basic setting Measurement parameter setting (p. 133) Sweep parameter setting (p. 135) Trigger setting (p. 137) Display timing setting (p. 139) Trigger delay setting (p. 140) Segment setting (p. 142) Initial screen is displayed. Sweep point setting (p.
- Page 26 1.3 Screen Configuration and Operation Graph setting Overwrite setting (p. 176) Horizontal axis scale setting (p. 177) Span setting (p. 179) Draw color setting (p. 181) Vertical axis scale setting (p. 183) Manual scaling setting (p. 184) Initial screen is displayed. Grid display setting (p.
- Page 27 1.3 Screen Configuration and Operation List settings Sweep point editing (p. 217) Initial screen is displayed. Application settings Memory function setting (p. 219) I/O output setting of judgment results (p. 226) IO trigger setting (p. 228) EOM output method setting (p. 229) HIGH-Z reject function setting (p.
- Page 28 1.3 Screen Configuration and Operation Continuous Measurement Mode Basic setting Removes item from targets for continuous measurement(p. 266) Sets item as target for continuous measurement(p. 266) Removes all items from targets for continuous measurement(p. 266) Sets all items as targets for continuous measurement(p.
-
Page 29: Compensation Settings Screen
1.3 Screen Configuration and Operation 1.3.4 Compensation Settings Screen Procedure LCR Initial Screen Press Set the compensation condition. Open circuit compensation setting (p. 273) Short circuit compensation setting (p. 280) Load circuit compensation setting (p. 288) Cable length compensation setting (p. 301) Scaling setting (p. -
Page 30: System Settings Screen
1.3 Screen Configuration and Operation 1.3.5 System Settings Screen Procedure LCR Initial Screen Press To set the details of the system. Interface type settings RS-232C Setting (Communication Instruction Manual (CD)) GP-IB Setting (Communication Instruction Manual (CD)) USB Setting (Communication Instruction Manual (CD)) LAN Setting (Communication Instruction Manual (CD)) Printer Setting (p. - Page 31 1.3 Screen Configuration and Operation Check the version of the instrument (p. 306) Initial screen is displayed. Checking the Display Screen Panel test (p. 307) Panel calibration (p. 308) Display test (p. 310) ROM/RAM test (p. 312) I/O test (p. 313) Initial screen is displayed.
-
Page 32: Save Settings Screen
1.3 Screen Configuration and Operation 1.3.6 Save Settings Screen Procedure LCR Initial Screen Press Set the save destination and type. Save method setting Save type setting (p. 333) Save destination folder setting (p. 344) Initial screen is displayed. Save the measurement condition Saves the setting conditions (p. -
Page 33: Parameter Settings Screen
1.3 Screen Configuration and Operation 1.3.7 Parameter Settings Screen This screen is for selecting the measurement parameters to display. "4.1.2 Setting Display Parameters" (p. 39), "Appendix 7 Series Equivalent Circuit Mode and Parallel Equivalent Circuit Mode"(p. A11) Procedure LCR Initial Screen Press the key to set. - Page 34 1.3 Screen Configuration and Operation...
-
Page 35: Chapter 2 Measurement Preparations
Refer to "Appendix 10 Rack Mounting"(p. A14) for rack mounting. 2.1 Preparation Flowchart Installing the Instrument (p. 4) Connecting the Power Cord (p. 29) Connect measurement cables, optional Hioki probes or test fixture (p. 30) Connect the external interface (as needed) Using the printer •... -
Page 36: Pre-Operation Inspection
2.2 Pre-Operation Inspection Before using the instrument for the first time, verify that it operates normally to ensure that no damage occurred during storage or shipping. If you find any damage, contact your dealer or Hioki representative. Peripheral Device Inspection... -
Page 37: Connecting The Power Cord
2.3 Connecting the Power Cord 2.3 Connecting the Power Cord Be sure to read the “Usage Notes” (p. 7) before connecting power. Connect the power cord to the power inlet on the instrument, and plug it into an outlet. Connection Procedure Check that the instrument’s power switch is turned off. -
Page 38: Connecting The Measurement Cables, Probes, Or Fixture
2.4 Connecting the Measurement Cables, Probes, or Fixture Be sure to read the “Usage Notes” (p. 7) before connecting measurement cables, probes or test fixture. Connect your measurement cables, optional Hioki probes or test fixture to the measurement terminal Refer to for details. -
Page 39: Turning The Power On And Off
2.5 Turning the Power On and Off 2.5 Turning the Power On and Off Connect the power cord and voltage and current measurement cables before turning the instrument on. Main power switch Turning main power on Turn the MAIN POWER switch on ( When the power is turned on, the same setting as when the power was last turned off appears. - Page 40 2.5 Turning the Power On and Off Be on standby ON the main power in the state, hold down the front POWER switch 2 seconds approximately. Lights red To cancel the standby The instrument is in standby state, press the POWER switch on the front. Lights green...
-
Page 41: Chapter 3 Measurement
3.1 When LCR Measurement Mode Measurement Chapter 3 Example The following shows measurement examples of the LCR measurement mode and analyzer measurement mode. 3.1 When LCR Measurement Mode ANALYZER Measuring a Laminated Ceramic Capacitor Necessary items: 9263 SMD test fixture Laminated ceramic capacity you want to measure Connect the 9263 SMD test fixture to the measurement terminals. - Page 42 3.1 When LCR Measurement Mode Connect the test sample to the 9263 SMD test fixture. For the connection procedure of the test sam- ple, refer to the instruction manual supplied with the fixture. Check the measurement results. • When you want to measure under desired condition and timing See: "4.2.4 Perform Measurements with User-defined...
-
Page 43: When Analyzer Measurement Mode
3.2 When Analyzer Measurement Mode 3.2 When Analyzer Measurement Mode ANALYZER In analyzer measurement mode, the sweep can be performed with frequencies and signal levels within the desired range. "Chapter 5 ANALYZER Function" (p. 131) Measuring Element with Resonance Point Necessary items: 9262 Test fixture Element you want to measure Connect the 9262 Test Fixture to the measurement terminals. - Page 44 3.2 When Analyzer Measurement Mode Connect the test sample to the 9263 Test Fixture. Execute the sweep. • When you want to check the measurement values. See: "5.6.1 Setting the Cursor" (p. 188) • When you want to check the local maximum and local minimum values quickly.
-
Page 45: Chapter 4 Lcr Function
4.1 About LCR function Chapter 4 LCR Function 4.1 About LCR function ANALYZER The LCR function allows you to measure the impedance, phase angle, and other items by applying any fre- quency or level (effective value) signal to the element you want to measure. This function is suitable for evalu- ating the passive element of a capacitor, coil, or the like. -
Page 46: Initial Screen
4.1 About LCR function 4.1.1 Initial screen This is the screen that is first displayed when the power is turned on. It allows you to perform measurement while checking the measurement conditions. When the power is turned on again, display is in accordance with the measurement mode used immediately before the power was turned off. -
Page 47: Setting Display Parameters
4.1 About LCR function 4.1.2 Setting Display Parameters You can select up to four measurement parameters to display in any location from 15 types. "1.3.7 Parameter Settings Screen" (p. 25) "Appendix 2 Measurement of High Impedance Components"(p. A3) "Appendix 7 Series Equivalent Circuit Mode and Parallel Equivalent Circuit Mode"(p. A11) Example: 1st: Capacitance Cs, 3rd: Loss coefficient D Procedure LCR Initial Screen... - Page 48 4.1 About LCR function Parameter Setting Press Press to confirm the setting. LCR Initial Screen are set as the parameters. is selected in the parameter setting, a measurement value is not displayed.
-
Page 49: Setting Basic Settings Of Measurement Conditions
4.2 Setting Basic Settings of Measurement Conditions 4.2 Setting Basic Settings of Measurement Conditions ANALYZER 4.2.1 Setting the Measurement frequency Set the frequency of the signal to apply to the test sample. For some test samples, the value may vary depending on the measurement frequency. - Page 50 4.2 Setting Basic Settings of Measurement Conditions Frequency Setting Frequency Setting Use the numeric keypad to enter the to enter each digit of the frequency. frequency. If you make a mistake during input: Holding down a digit key changes the value continuously. Press the to cancel the input so far, and start again.
-
Page 51: Setting The Measurement Signal Level
4.2 Setting Basic Settings of Measurement Conditions 4.2.2 Setting the Measurement signal level The value of the test signal level may change according to the sample which is being tested. This instrument is possible to vary the level of the test signal applied to the object under test over a wide range using the following three methods. - Page 52 4.2 Setting Basic Settings of Measurement Conditions Measurement Signal Level Setting To select the measurement signal level. open circuit voltage (p. 45) Voltage level between test sample termi- nals (p. 45) Current level through test sample (p. 47) The accuracy of testing varies according to the test signal level.
- Page 53 4.2 Setting Basic Settings of Measurement Conditions About the test signal level Relationship between the measurement signal level of the instrument and the sample is as follows. Open circuit voltage level (V) Constant current level (CC) This voltage value is the value which is applied across the two terminals of You should select this if you wish the series combination of the object which is being tested and the output to set the current passing through...
- Page 54 4.2 Setting Basic Settings of Measurement Conditions • When Low Z high accuracy mode (p. 54) Measurement frequency Open circuit voltage Open circuit voltage setting range setting range accuracy 4 Hz to 100 kHz 0.005 V to 1 V ±10%±10 mV 1.000 V 0.005 V 4 Hz...
- Page 55 4.2 Setting Basic Settings of Measurement Conditions Constant current level (CC) setting • When normal mode (p. 54) However, the constant current operation range differs depending on the test sample to be measured. Measurement frequency Constant current Constant current setting range setting range accuracy ...
- Page 56 4.2 Setting Basic Settings of Measurement Conditions Testing some types of sample is not possible using constant current. In this case, the following symbol appears on the display: In such a case, constant current testing is not performed. Change the constant current level to a value not more than the value being shown as Imoni.
-
Page 57: Setting The Measurement Range
4.2 Setting Basic Settings of Measurement Conditions 4.2.3 Setting the Measurement Range There are the following two methods for setting the measurement range. The most suitable test range is set automatically. (This allows the most suitable measurement range to be set when measuring, for AUTO example, a test sample whose impedance varies greatly with frequency or a test sample whose nature is unknown.) - Page 58 4.2 Setting Basic Settings of Measurement Conditions Range Setting Press If the instrument is being used outside the lim- its of its specification, the suitable range may not be set in auto ranging function. In this case, check the accuracy assured ranges in "13.2 Measure- ment Range and Accuracy"...
-
Page 59: Setting The Ranging To Hold
4.2 Setting Basic Settings of Measurement Conditions Setting the Ranging to HOLD Procedure LCR Initial Screen LCR Basic Settings LCR Basic Settings Press Range Setting Press... - Page 60 4.2 Setting Basic Settings of Measurement Conditions Range Selection To select the measurement range. Accuracy Test range AUTO Ranging Range guaranteed range 8 M to 200 M 8 M to 999.999 M 100 M 10 M 800 k to 100 M 800 k...
-
Page 61: Low Z High Accuracy Mode
4.2 Setting Basic Settings of Measurement Conditions Low Z High Accuracy Mode This mode balances the L terminal at 0 V to reduce the influence of contact resistance during low imped- ance measurement. Furthermore, since the output resistance becomes 10 and sufficient current can flow to the test sample to be measured, this mode enables highly accurate measurement. - Page 62 4.2 Setting Basic Settings of Measurement Conditions With low Z high accuracy mode, the possible setting ranges of the frequency and measure- ment signal level differ. Refer to the following. Measurement to 1 kHz to 10 kHz to 100 kHz to 1 MHz to 5 MHz range...
-
Page 63: Perform Measurements With User-Defined Timing (Trigger Measurement)
4.2 Setting Basic Settings of Measurement Conditions 4.2.4 Perform Measurements with User-defined Timing (Trigger Measurement) Triggering is the process of controlling the start and stop of recording by specific signals or conditions (crite- ria). When recording is started or stopped by a specific signal, we say the trigger is "gapplied" or "triggering occurs". - Page 64 4.2 Setting Basic Settings of Measurement Conditions Trigger Setting Select the trigger type. Perform continuous measure- Internal trigger ment automatically. Input the trigger manually via External trigger EXT I/O or from the interface. When is selected There are the following three types of input method for a trigger. •...
-
Page 65: Setting The Dc Bias
4.2 Setting Basic Settings of Measurement Conditions 4.2.5 Setting the DC bias You can superimpose a DC voltage on the measurement signal during capacitor measurement. You can superimpose a DC signal on the measurement signal. Procedure LCR Initial Screen LCR Basic Settings LCR Basic Settings Press DC Bias Setting... - Page 66 4.2 Setting Basic Settings of Measurement Conditions DC Bias Setting to set the DC level to super- impose. • Settable range: 0.00 V to 2.50 V (Normal mode) 0.00 V to 1.00 V (low Z high accuracy mode) • If you make a mistake during input: press to cancel the input and start again.
-
Page 67: Setting The Measurement Speed
4.2 Setting Basic Settings of Measurement Conditions 4.2.6 Setting the Measurement speed The testing speed can be set. The slower the testing speed is, the more accurate are the results. Procedure LCR Initial Screen LCR Basic Settings LCR Basic Settings Press Measurement Speed Setting To select the measurement speed. -
Page 68: Setting The Voltage/Current Limit
4.2 Setting Basic Settings of Measurement Conditions 4.2.7 Setting the Voltage/Current Limit Depending on the measurement signal level, in some cases it is possible to damage the sample which is being tested by applying to it a voltage or a current greater than its rated value. For this reason, set a limit value to restrict the voltage that can be applied to the test sample or current that can flow to the test sample. - Page 69 4.2 Setting Basic Settings of Measurement Conditions Current Limit Setting Select ON/ OFF for the limit function. Sets the limit function to OFF. Sets the limit function to ON. Current Limit Setting to enter the limit value. Limit range Measure- ment signal Limit set Setting range...
-
Page 70: Displaying Average Values (Averaging Set)
4.2 Setting Basic Settings of Measurement Conditions 4.2.8 Displaying Average Values (Averaging Set) With the averaging function, the measured values can be averaged. Using this function, it is possible to reduce fluctuations in the measured value display. A rolling average of the tested values over the set number of times for averaging is always calculated backwards from the present. - Page 71 4.2 Setting Basic Settings of Measurement Conditions Procedure LCR Initial Screen LCR Basic Settings LCR Basic Settings Press Number of Averaging Times Setting to enter the number of aver- aging times. Settable range: 1 to 256 times When you want to cancel the averaging function: Press The number of averaging times is set to 001, and the...
-
Page 72: Measuring At Desired Time (Trigger Delay)
4.2 Setting Basic Settings of Measurement Conditions 4.2.9 Measuring at Desired Time (Trigger Delay) The delay time period from input of the trigger signal to reading of the test data can be set. With this function it is possible to ensure that testing is started after the connection condition of the object being tested and the test cables has stabilized. -
Page 73: Setting Dc Resistance Measurement
4.3 Setting DC Resistance Measurement 4.3 Setting DC Resistance Measurement ANALYZER You can output a DC signal of any level (up to 2.5 V) and measure the DC resistance Rdc. • To measure DC resistance, you need to set in the measurement parameters before- hand. -
Page 74: Setting The Measurement Signal Level
4.3 Setting DC Resistance Measurement 4.3.1 Setting the Measurement signal level The value of the test signal level may change according to the sample which is being tested. This instrument is possible to vary the level of the test signal applied to the object under test over a wide range using the following three methods. - Page 75 4.3 Setting DC Resistance Measurement Measurement Signal Level Setting To select the measurement signal level. open circuit voltage (p. 45) Voltage level between test sample termi- nals (p. 45) Current level through test sample (p. 47) The accuracy of testing varies according to the test signal level.
- Page 76 4.3 Setting DC Resistance Measurement About the test signal level Relationship between the measurement signal level of the instrument and the sample is as follows. Open circuit voltage level (V) Constant current level (CC) This voltage value is the value which is applied across the two terminals of You should select this if you wish the series combination of the object which is being tested and the output to set the current passing through...
-
Page 77: Setting The Measurement Range
4.3 Setting DC Resistance Measurement 4.3.2 Setting the Measurement Range There are the following two methods for setting the measurement range. The most suitable test range is set automatically. AUTO (This allows the most suitable measurement range to be set when, for example, measuring a test sample whose nature is unknown.) The test range is fixed, and may only be altered manually. - Page 78 4.3 Setting DC Resistance Measurement Range Setting Press If the instrument is being used outside the lim- its of its specification, the suitable range may not be set in auto ranging function. In this case, check the accuracy assured ranges in "13.2 Measure- ment Range and Accuracy"...
-
Page 79: Setting The Ranging To Hold
4.3 Setting DC Resistance Measurement Setting the Ranging to HOLD Procedure LCR Initial Screen Rdc Basic Settings Rdc Basic Settings Press Range Selection Press... - Page 80 4.3 Setting DC Resistance Measurement Range Selection To select the measurement range. Accuracy guaran- Test range AUTO Ranging Range teed range 8 M to 200 M 8 M to 999.999 M 100 M 10 M 800 k to 100 M 800 k...
-
Page 81: Low Z High Accuracy Mode
4.3 Setting DC Resistance Measurement Low Z High Accuracy Mode This mode balances the L terminal at 0 V to reduce the influence of contact resistance during low imped- ance measurement. Furthermore, since the output resistance becomes 10 and sufficient current can flow to the test sample to be measured, this mode enables highly accurate measurement. - Page 82 4.3 Setting DC Resistance Measurement With low Z high accuracy mode, the possible setting range of the measurement signal level differs. Refer to the table below. Measurement range 100 M 10 M 100 k 30 k Normal mode only (setting invalid for ...
-
Page 83: Setting The Dc Adjustment Function
4.3 Setting DC Resistance Measurement 4.3.3 Setting the DC Adjustment Function DC adjustment sets the generation voltage to 0 V, obtains the offset value generated in the internal circuit of the instrument, and reduces the measurement error. Procedure LCR Initial Screen Rdc Basic Settings Rdc Basic Settings Press... - Page 84 4.3 Setting DC Resistance Measurement DC Adjustment Setting Select ON/ OFF for DC adjustment. Obtains the offset value with the CALIB signal of EXT I/O or a communication command (: DCResistance:ADJust :DEMand Obtains the offset value for each measure- ment. •...
-
Page 85: Setting The Measurement Speed
4.3 Setting DC Resistance Measurement 4.3.4 Setting the Measurement speed The testing speed can be set. The slower the testing speed is, the more accurate are the results. Procedure LCR Initial Screen Rdc Basic Settings Rdc Basic Settings Press Measurement Speed Setting To select the measurement speed. -
Page 86: Setting The Voltage/Current Limit
4.3 Setting DC Resistance Measurement 4.3.5 Setting the Voltage/Current Limit Depending on the measurement signal level, in some cases it is possible to damage the sample which is being tested by applying to it a voltage or a current greater than its rated value. For this reason, set a limit value to restrict the voltage that can be applied to the test sample or current that can flow to the test sample. - Page 87 4.3 Setting DC Resistance Measurement Measurement Signal Level Setting Select ON/ OFF for the limit function. Set the limit function to OFF. Set the limit function to ON. Measurement Signal Level Setting to enter a limit value. Limit range: Measurement Limit set Setting range signal level...
-
Page 88: Displaying Average Values (Average Set)
4.3 Setting DC Resistance Measurement 4.3.6 Displaying Average Values (Average set) With the averaging function, the measured values can be averaged. Using this function, it is possible to reduce fluctuations in the measured value display. After the signal level and range are set, measurement is performed for the set number of averaging times and the measurement values are displayed. - Page 89 4.3 Setting DC Resistance Measurement No. of Averaging Times Setting to enter the number of aver- aging times. Settable range: 1 to 256 When you want to cancel the averaging function: Press The number of averaging times is set to 1. Press to close the setting screen.
-
Page 90: Setting The Delay Time
4.3 Setting DC Resistance Measurement 4.3.7 Setting the Delay Time In cases such as the following, set the time to wait before starting DC resistance measurement. • When measurement is changed from AC signal measurement to DC resistance measurement. • When the voltage level is changed. •... - Page 91 4.3 Setting DC Resistance Measurement The time required until the DC signal level stabilizes differs depending on the test sample to be measured. To ensure measurement is performed accurately, observe the measurement waveform in advance and then set the delay time required until the DC signal level stabi- lizes.
-
Page 92: Judging Measurement Results
4.4 Judging Measurement Results 4.4 Judging Measurement Results ANALYZER The measurement results are compared to an arbitrarily set reference and then the judgment results are dis- played. This function is useful for quality evaluation and the like. There is comparator measurement which compares one judgment reference and the measurement values, and BIN measurement which compares multiple judgment reference values (up to 10) and the measurement values. - Page 93 4.4 Judging Measurement Results Application Settings Press Judgment Mode Setting To select the judgment mode. Cancels the comparator and BIN measure- ment settings. Sets comparator measurement. (p. 86) Sets BIN measurement. (p. 93) When comparator measurement and BIN measurement are performed, only the first and third parameters can be set.
-
Page 94: Judging With Upper And Lower Limit Values(Comparator Measurement Mode)
4.4 Judging Measurement Results 4.4.1 Judging with Upper and Lower Limit Values (Comparator Measurement Mode) The comparator measurement allows you to do the following. • Preset a reference value and upper and lower limit values as the judgment reference, and display a judgment result as (higher than the upper limit value), (within the range set for the upper and... - Page 95 4.4 Judging Measurement Results 1: The following equation is used to calculate the comparison upper limit value and comparison lower limit value. (In the case of the comparison lower limit value, if a value that is lower than the reference value is set, the minus (-) sign is required for the percentage setting value.) Percentage set value Upper limit comparison value (Lower limit comparison value) = reference value+ |reference value| ×...
-
Page 96: Setting The Upper Or Lower Limit Value As An
4.4 Judging Measurement Results Setting the Upper or Lower Limit Value as an Absolute Value (ABS) (Absolute Value mode) Procedure LCR Initial Screen Press Comparator Condition Setting Press Upper Limit Value Setting Press and use the numeric keypad to set the upper limit value. Settable range: -9.999999 G to 9.999999 G ... -
Page 97: Setting The Upper Or Lower Limit Value As A Percentage (%) Relative To A Reference Value (Percentage Mode)
4.4 Judging Measurement Results Setting the Upper or Lower Limit Value as a Percentage (%) Relative to a Ref- erence Value (Percentage mode) Procedure LCR Initial Screen Press Comparator Condition Setting Press Reference Value Setting Press and use the numeric keypad to set the reference value. - Page 98 4.4 Judging Measurement Results Upper Limit Value Setting Press and use the numeric keypad to set the upper limit value. Set the upper limit value as a percentage relative to the reference value. When you do not want to set the upper limit: Press •...
-
Page 99: Setting Upper And Lower Limit Values As ( %) Values Relative To The Offset From The Reference Value (Deviation Percentage Mode)
4.4 Judging Measurement Results Setting Upper and Lower Limit Values as ( %) Values Relative to the Offset from the Reference Value (Deviation Percentage Mode) Procedure LCR Initial Screen Press • In the deviation percentage mode, the measurement value is displayed as a deviation ( %) from the refer- ence value. - Page 100 4.4 Judging Measurement Results Upper Limit Value Setting Press and use the numeric keypad to set the upper limit value. Settable range: -999.9999% to 999.9999% When you do not want to set the upper limit: Press Press to confirm the upper limit value. Return to step , press , and use the numeric keypad to enter the lower limit...
-
Page 101: Classifying Measurement Results (Bin Measurement)
4.4 Judging Measurement Results 4.4.2 Classifying Measurement Results (BIN Measurement) Set the upper and lower limit values for two parameters and display up to 10 classifications of judgment results.You can also output the judgment results to an external device. Select the judgment mode for BIN measurement (Front panel LEDs) before setting the judgment conditions. - Page 102 4.4 Judging Measurement Results The comparator decision mode can be set as one of the following: Absolute value (ABS) setting (p. 88) Set absolute values for the upper limit and lower limit values of upper limit value the measurement parameters. The measurement values displayed are the same as those of the mea- surement parameters.
-
Page 103: Setting The Upper Or Lower Limit Value As An
4.4 Judging Measurement Results Setting the Upper or Lower Limit Value as an Absolute Value (ABS) (Absolute Value mode) Procedure Press BIN Settings Press The button display differs depending on the measurement parameter. BIN Mode Setting Press Press to return to the BIN setting screen. - Page 104 4.4 Judging Measurement Results BIN Settings to select the BIN number to set, and press Upper/Lower Limit Value Settings Press Upper Limit Value Setting Use the numeric keypad to set the upper limit value of the first parameter. Settable range: -9.999999G to 9.999999G Press to confirm the upper limit value.
- Page 105 4.4 Judging Measurement Results Return to step , press , and use the numeric keypad to set the lower limit value. Settable range: -9.999999G to 9.999999G Press to confirm the lower limit value. Return to step , and set the upper and lower limit values of the second parameter in the same way. Press to return to the BIN setting screen.
-
Page 106: Setting The Upper Or Lower Limit Value As A Percentage (%) Relative To A Reference Value (Percentage Mode)
4.4 Judging Measurement Results Setting the Upper or Lower Limit Value as a Percentage (%) Relative to a Ref- erence Value (Percentage mode) Procedure Press BIN Settings Press The button display differs depending on the measurement parameter. BIN Mode Setting Press to select percentage mode. - Page 107 4.4 Judging Measurement Results Reference Value Setting Press Use the numeric keypad to enter the reference value and press Settable range: -9.999999G to 9.99999G BIN Mode Setting Press to return to the BIN setting screen. BIN Settings to select the BIN number to set, and press...
- Page 108 4.4 Judging Measurement Results Upper/Lower Limit Value Settings Press Upper Limit Value Setting Use the numeric keypad to enter the upper limit value of the first parameter. Settable range: -999.9999% to 999.9999% Press to confirm the upper limit value. When you do not want to set the upper and lower limit values: Press Return to step , press...
-
Page 109: Setting Upper And Lower Limit Values As
4.4 Judging Measurement Results Setting Upper and Lower Limit Values as ( %) Values Relative to the Offset from the Reference Value (Deviation Percentage Mode) Procedure Press BIN Settings Press The button display differs depending on the measurement parameter. BIN Mode Setting Press to select percentage mode. -
Page 110: Reference Value
4.4 Judging Measurement Results Reference Value Setting Press Use the numeric keypad to enter the reference value and press Settable range: -9.999999G to 9.999999G BIN Mode Setting Press to return to the BIN setting screen. BIN Settings to select the BIN number to set, and press... - Page 111 4.4 Judging Measurement Results Upper/Lower Limit Value Settings Press Upper Limit Value Setting Use the numeric keypad to enter the upper limit value of the first parameter. Settable range: -999.9999% to 999.9999% Press to confirm the upper limit value. When you do not want to set the upper and lower limit values: Press Return to step , press...
-
Page 112: Setting Application Settings
4.5 Setting Application Settings 4.5 Setting Application Settings ANALYZER 4.5.1 Synchronizing Measurement (Trigger Synchronous Output Function) This function enables the measurement signal to be output after measurement is triggered and ensures that the signal is applied to the sample only during measurement. Thus reducing the generation of heat in the sample and decreasing electrode wear. -
Page 113: Trigger Synchronous Output Function
4.5 Setting Application Settings Trigger Sync Setting Select ON/ OFF for the trigger synchronous output function. Sets the trigger synchronous output function to OFF. Sets the trigger synchronous output function to ON. Trigger Sync Setting to set the wait time from after the measurement signal is output by applying a trigger to the start of measurement. -
Page 114: Saving Measurement Results (Memory Function)
4.5 Setting Application Settings 4.5.2 Saving Measurement Results (Memory function) You can save the measurement results inside the instrument. (Up to 32,000 items) The saved measurement results can be saved to a USB flash drive. They can also be acquired using a communication command. (The memory function is the same in mode and mode.) - Page 115 4.5 Setting Application Settings Memory Function Setting Select ON/ OFF for the memory function. Sets the memory function to OFF. Saves the measurement results to memory only when a pass judgment is made for all of the parameters judged with the comparator and BIN functions.
-
Page 116: Detecting Open During 2-Terminal Measurement (High-Z Reject Function)
4.5 Setting Application Settings 4.5.3 Detecting OPEN during 2-terminal Measurement (HIGH-Z Reject Function) This function is for outputting a measurement terminal connector error when the measurement result is high relative to the set judgment reference value. The setting value can be set as an absolute value, and the error is output via the EXT I/O. - Page 117 4.5 Setting Application Settings HIGH-Z Setting Select ON/ OFF for the HIGH-Z reject function. Sets the HIGH-Z reject function to OFF. Sets the HIGH-Z reject function to ON. HIGH-Z Setting to set the judgment reference value. Settable range: 0 to 30000% •...
-
Page 118: Monitoring The Detection Level (Monitoring The Detection Level Function)
4.5 Setting Application Settings 4.5.4 Monitoring the Detection Level (Monitoring the Detection Level Function) Measurement waveform errors that occur when the test sample and instrument contact each other can be detected by monitoring the voltage effective value and current effective value. The voltage effective value and current effective value are calculated several times during analog measure- ment. -
Page 119: Monitoring The Detection Level Function
4.5 Setting Application Settings Detection Level Monitoring Function Setting Select ON/OFF for the function to monitor the detection level. Sets the detection level monitoring function to OFF. Sets the detection level monitoring function to Detection Level Monitoring Function Setting to enter the limit value. Settable range: 0.01 to 100.00% Press to close the setting screen. - Page 120 4.5 Setting Application Settings • If a detection level error is detected, the following comment is displayed at the top of the screen. • The detection level error is reflected in the response result of :MEASure? :MEMory? :MEASure? :MEMory? Description of communications commands on the included CD Furthermore, it is output as a measurement error to the ERR terminal (10-pin) of the EXT I/O.
- Page 121 4.5 Setting Application Settings 4.5.5 Setting the Detection Sensitivity for Measure- ment Errors (Overflow or Underflow) The instrument monitors the detectable range of the measurement signals (voltage and current) during mea- surement, and displays a measurement error (OVERFLOW or UNDERFLOW) if that range is exceeded. However, if measurement is performed under a noisy environment, the detection range may be exceeded resulting in a measurement error regardless of whether an appropriate measurement range is set.
- Page 122 4.5 Setting Application Settings Level Value Setting to enter the level value. Settable range: 1 to 32 Press to close the setting screen. The higher the setting value, the greater the measurement errors. If the setting value is set to 2 or higher, the accuracy specifications may not be able to be satisfied. Furthermore, shifting to the most suitable range may not occur during auto range opera- tion.
-
Page 123: Setting The Delay Time From The Output Of Comparator And Bin Judgment Results Until Output Of Eom (Low) And Resetting Judgment Results
4.5 Setting Application Settings 4.5.6 Setting the Delay Time from the Output of Com- parator and BIN Judgment Results until Output of EOM (LOW) and Resetting Judgment Results You can set the delay time for the period from the output of the comparator and BIN judgment results until the output of EOM (LOW) from the EXT I/O. - Page 124 4.5 Setting Application Settings I/O Judgment Setting to set the delay time for the period from the output of the comparator and BIN judgment results until the output of EOM (LOW). • Settable range: 0.0000 s to 0.9999 s • If you make a mistake during input: press to cancel the input and start again.
-
Page 125: Enabling Trigger Input For During Measurement And Setting The Valid Edge Of Trigger Input
4.5 Setting Application Settings 4.5.7 Enabling Trigger Input for during Measurement and Setting the Valid Edge of Trigger Input You can select whether to enable or disable trigger input from the EXT I/O during measurement (during EOM (HI) output after trigger is received). Furthermore, you can also select either the rising edge or falling edge as the valid edge of trigger input from the EXT I/O. - Page 126 4.5 Setting Application Settings I/O Trigger Setting Select the I/O trigger function setting. Disables trigger input from the EXT I/O during measurement (during EOM (HI) output after trigger is received). Enables trigger input from the EXT I/O during measurement (during EOM (HI) output after trigger is received).
-
Page 127: Setting The Eom Output Method
4.5 Setting Application Settings 4.5.8 Setting the EOM Output Method The higher the measurement frequency, the shorter the time that INDEX and EOM are high (off). When the high (off) time is too short due to characteristics of the input circuit, the instrument can be configured to maintain the low (on) state for a preset time once EOM changes to low (on) before reverting the signal to high (off) after the completion of measurement. - Page 128 4.5 Setting Application Settings Setting the EOM output method Setting the output method. For HOLD and PULSE timing charts, see "Chapter 11 External Control" (p. 363). to set the EOM output time for the PULSE setting. Settable range: 0.0001 to 0.9999 s Press to close the setting screen.
-
Page 129: Disabling Key Operation (Key-Lock Function)
4.5 Setting Application Settings 4.5.9 Disabling Key Operation (Key-lock Function) If you turn the key-lock function ON, all operations except disabling the key-lock are disabled to protect the settings. You can also set a passcode (security code). Procedure LCR Initial Screen Application Settings Application Settings Press... - Page 130 4.5 Setting Application Settings Setting the Passcode of the Key-lock Input Passcode Press when the key-lock setting is Use the numerical keypad to enter the pass- code, press , and then press Settable range: 1 to 4 digits If a passcode is set, it needs to be entered to disable the key-lock. Take care not to forget the set passcode.
- Page 131 4.5 Setting Application Settings Key Lock Disable Error If the error indication shown on the left appears, check the following items. Cause Remedy Press and enter the passcode. was pressed before you entered the passcode. Press and enter the passcode again. The entered passcode is incorrect.
-
Page 132: 10Setting The Number Of Display Digits
4.5 Setting Application Settings 4.5.10 Setting the Number of Display Digits You can set the number of effective digits of the measurement value for each parameter. Procedure LCR Initial Screen Application Settings Application Settings Press... - Page 133 4.5 Setting Application Settings No. of Display Digits Setting to set the number of display digits. (For each parameter) Settable range: 3 to 7 digits Setting Parameter Value Other Up to three decimal places Up to six decimal places Up to three decimal places Up to four decimal places Up to 7 digits Up to second decimal Up to three decimal places Up to five decimal places Up to three decimal places Up to 6 digits...
-
Page 134: 11Enlarging Display Of Measurement Values
4.5 Setting Application Settings 4.5.11 Enlarging Display of Measurement Values The measurement values and comparator decision results can be displayed in enlarged form. This function is convenient when the unit is used under constant measurement conditions. If the power is turned off when is displayed, will be displayed when the instrument starts the next time you turn the power on. -
Page 135: 12Setting The Lcd To On/ Off
4.5 Setting Application Settings 4.5.12 Setting the LCD to ON/ OFF You can turn the LCD ON/ OFF. Setting the LCD to OFF saves power because the LCD turns off if the panel is not touched for 10 seconds. Procedure LCR Initial Screen Application Settings Application Settings... -
Page 136: 13Setting Operation Sounds (Beep Sounds)
4.5 Setting Application Settings 4.5.13 Setting Operation Sounds (Beep Sounds) You can set the operation sound and each of the beep sounds for judgment results. Procedure LCR Initial Screen Application Settings Application Settings Press Beep sound settings for when comparator judgment When a comparator judgment is made, no beep Beep Sound Settings sound is emitted. -
Page 137: 14Initializing (System Reset)
4.5 Setting Application Settings 4.5.14 Initializing (System Reset) In the event of the instrument malfunctioning, check "Before returning for repair" (p. 405). If you do not know the cause of the problem, perform a system reset to restore the instrument to its factory default settings. - Page 138 4.5 Setting Application Settings...
-
Page 139: Chapter 5 Analyzer
5.1 About ANALYZER function ANALYZER Chapter 5 Function 5.1 About ANALYZER function ANALYZER The analyzer function allows you to perform measurement while sweeping the measurement frequency and measurement signal level. The measurement results can be displayed in a graph. Use this function for measuring frequency characteris- tics and level characteristics. -
Page 140: Initial Screen
5.1 About ANALYZER function 5.1.1 Initial screen This is the screen that is first displayed when the power is turned on. It allows you to perform measurement while checking the measurement conditions. For details on the screen configuration, refer to page 17. Indicates that a Indicates the Indicates the maximum... -
Page 141: Setting Basic Settings Of Measurement
5.2 Setting Basic Settings of Measurement 5.2 Setting Basic Settings of Measurement ANALYZER You can set the basic settings for any of first. 5.2.1 Setting the measurement parameter Set the measurement parameter for analyzer mode. DC resistance measurement cannot be performed in analyzer mode. Procedure Analyzer Initial Screen Analyzer Basic Settings... - Page 142 5.2 Setting Basic Settings of Measurement Measurement Parameter Setting Select the first parameter. Select the second parameter. • In analyzer mode, two types of parameter mea- surement can be performed: PARA1 and PARA2. • The parameter settings of LCR mode and parame- ter settings of analyzer mode are synchronized as shown below.
-
Page 143: Setting The Sweep Parameter
5.2 Setting Basic Settings of Measurement 5.2.2 Setting the Sweep Parameter Set the sweep parameter. In analyzer mode, measurement is performed during sweeping for the parameter set for this item. The following four types of parameter can be set as the sweep parameter. •... - Page 144 5.2 Setting Basic Settings of Measurement Sweep Parameter Setting Select the sweep parameter. Performs frequency sweep. Performs open circuit voltage sweep. Performs constant voltage sweep. Performs constant current sweep. Press to close the setting screen.
-
Page 145: Setting The Trigger
5.2 Setting Basic Settings of Measurement 5.2.3 Setting the Trigger Set the trigger. In analyzer mode, sweeping is performed in accordance with the trigger setting that is set for this item. The following three types of trigger can be set as the trigger setting. •... - Page 146 5.2 Setting Basic Settings of Measurement Trigger Setting Select the trigger setting. Performs a sequential sweep. When an external trigger is input, sweep measurement is performed once only. Performs a repeat sweep. An internal trigger results in a sweep being performed repeatedly.
-
Page 147: Setting The Display Timing
5.2 Setting Basic Settings of Measurement 5.2.4 Setting the Display Timing Set the timing for drawing the graph or list. If the display timing is set to , the time for one sweep becomes long because the screen is updated every time each sweep point is measured. -
Page 148: Setting The Trigger Delay
5.2 Setting Basic Settings of Measurement 5.2.5 Setting the Trigger Delay Set the delay time from when a trigger is input until measurement starts. There are two delay settings: “Trigger Delay” and “Point Delay.” With this item, only the setting for the trigger delay is configured. When sequential sweep Trigger delay Point delay... - Page 149 5.2 Setting Basic Settings of Measurement Procedure Analyzer Initial Screen Analyzer Basic Settings Analyzer Basic Settings Press Trigger Delay Setting to set the delay time. • Settable range: 0 to 9.9999 s with resolution of 0.1 ms • If you make a mistake during input: press cancel the input and start again.
-
Page 150: Segment Setting
5.2 Setting Basic Settings of Measurement 5.2.6 Segment Setting Set whether to perform a normal sweep or segment sweep. Set the sweep range and number of sweep points and then perform measurement. Normal Sweep (p. 143) (For each sweep point, the measurement conditions, except for the sweep parameter, are the same. -
Page 151: Normal Sweep
5.3 Normal Sweep 5.3 Normal Sweep ANALYZER Set just one type for each of the sweep range and number of sweep points and then perform measurement. 5.3.1 Setting Sweep Points The sweep range setting differs depending on the setting of the sweep parameter ( ). - Page 152 5.3 Normal Sweep Sweep Range Setting Select the setting method of the sweep range. For details on the settings, refer to the following figures. When you want to cancel the setting: Press Sets the start value and end value of the sweep. Sets the start value of the sweep and the step Each sweep point is automatically calculated width of sweep points.
- Page 153 5.3 Normal Sweep Setting the start value and end value of the sweep Press and use the numeric keypad to set the START-STOP Settings start value of the sweep. Settable range: 4 Hz to 5 MHz Press , or key to confirm the setting. Press and use the numeric keypad to set the end value of the sweep.
- Page 154 5.3 Normal Sweep Setting the center value of the sweep range and the sweep width Press and use the numeric keypad to set the CENTER-SPAN Setting center value of the sweep range. Settable range: 4 Hz to 5 MHz Press , or key to confirm the setting.
- Page 155 5.3 Normal Sweep Fixing sweep parameter and setting measurement to be per- formed at a set time interval (Time interval measurement) Press and use the numeric keypad to set the INTERVAL Setting start value of the sweep. Settable range: 4 Hz to 5 MHz Press , or key to confirm the setting.
- Page 156 5.3 Normal Sweep When the setting is Procedure Example: When Analyzer Initial Screen Press...
- Page 157 5.3 Normal Sweep START-STOP Settings Select the setting method of the sweep range. For details on the settings, refer to the following figures. When you want to cancel the setting: Press Sets the start value and end value of the sweep. Sets the start value of the sweep and the step Each sweep point is automatically calculated width of sweep points.
- Page 158 5.3 Normal Sweep Setting the start value and end value of the sweep START-STOP Settings Press and use the numeric keypad to set the start value of the sweep. Settable range: 0.005 to 5.000 V Press key to confirm the setting. Press and use the numeric keypad to set the end value of the sweep.
- Page 159 5.3 Normal Sweep Setting the start value of the sweep and the step width of the sweep point Press and use the numeric keypad to set the START-STEP Settings start value of the sweep. Settable range: 0.005 to 5.000 V Press key to confirm the setting.
- Page 160 5.3 Normal Sweep When the setting is Procedure Analyzer Initial Screen Press...
- Page 161 5.3 Normal Sweep START-STOP Settings Select the setting method of the sweep range. For details on the settings, refer to the following figures. When you want to cancel the setting: Press Sets the start value and end value of the sweep. Sets the start value of the sweep and the step Each sweep point is automatically calculated width of sweep points.
- Page 162 5.3 Normal Sweep Setting the start value and end value of the sweep Press and use the numeric keypad to set the Sweep start value and end value settings start value of the sweep. Settable range: 0.01 mA to 50 mA Press key to confirm the setting.
- Page 163 5.3 Normal Sweep Setting the start value of the sweep and the step width of the sweep point Press and use the numeric keypad to set the START-STEP Settings start value of the sweep. Settable range: 0.01 mA to 50 mA Press key to confirm the setting.
- Page 164 5.3 Normal Sweep How to Check the Set Sweep Points You can check the sweep point setting values in the sweep parameter setting section of the numerical value list display screen. Analyzer Initial Screen Measurement Value List Display Sweep parameter setting values...
-
Page 165: Setting The Measurement Signal
5.3 Normal Sweep 5.3.2 Setting the Measurement Signal For the measurement signal setting, either the measurement frequency or measurement signal level can be set as a measurement signal other than the sweep parameter, depending on the setting of the sweep parameter. Frequency Sweep You can set the measurement voltage or measurement current. - Page 166 5.3 Normal Sweep Open-circuit Voltage, Constant Voltage, & Constant Current Settings Frequency Setting Select the measurement level. to enter each digit of the frequency. Open circuit voltage level (p. 45) • Settable range: 4.00 Hz to 5.0000 MHz Voltage level between test sample terminals •...
- Page 167 5.3 Normal Sweep How to Check the Set Measurement Signal Analyzer Initial Screen You can check the measurement signal setting value in the measurement signal setting section of the graph display screen.
-
Page 168: Setting The Measurement Range
5.3 Normal Sweep 5.3.3 Setting the Measurement Range When measuring, for example, a test sample whose impedance varies greatly with frequency or a test sample whose nature is unknown, the most suitable measurement range can be set with AUTO. And, fixing the range with HOLD enables high speed measurement. - Page 169 5.3 Normal Sweep Range Setting Press If the instrument is being used outside the lim- its of its specification, the suitable range may not be set in auto ranging function. In this case, check the accuracy assured ranges in "13.2 Measurement Range and Accuracy" (p. 395) and then change the test conditions.
- Page 170 5.3 Normal Sweep Setting the Ranging to HOLD Procedure Analyzer Initial Screen Analyzer Basic Settings Analyzer Basic Settings Press Range Hold Setting Press...
- Page 171 5.3 Normal Sweep Range Hold Setting To select the measurement range. Accuracy guaran- Test range AUTO ranging range teed range 100 M 8 M to 200 M 8 M to 999.999 M 10 M 800 k to 10 M 800 k to 100 M 1 M...
-
Page 172: Setting The Measurement Range
5.3 Normal Sweep 5.3.4 Setting the Measurement speed The testing speed can be set. The slower the testing speed is, the more accurate are the results. Procedure Analyzer Initial Screen Analyzer Basic Settings Analyzer Basic Settings Press Measurement Speed Setting To select the measurement speed Performs high-speed measurement. -
Page 173: Displaying As Average Values (Average Set)
5.3 Normal Sweep 5.3.5 Displaying as Average Values (Average set) With the averaging function, the measured values can be averaged. Using this function, it is possible to reduce fluctuations in the measured value display. The measurement values are averaged by arithmetic averaging during analyzer measure- ment regardless of the trigger setting. -
Page 174: Setting The Point Delay
5.3 Normal Sweep 5.3.6 Setting the Point Delay For the point delay setting, set the delay time for each sweep point. "5.2.5 Setting the Trigger Delay" (p. 140) Procedure Analyzer Initial Screen Analyzer Basic Settings Analyzer Basic Settings Press Point Delay Setting to enter the delay time. -
Page 175: Setting The Dc Bias
5.3 Normal Sweep 5.3.7 Setting the DC Bias For the DC bias setting, set the DC bias value for when sweep measurement is performed. If the DC bias is set, a DC signal can be superimposed on the measurement signal. Procedure Analyzer Initial Screen Analyzer Basic Settings... - Page 176 5.3 Normal Sweep DC Bias Setting to set the DC bias. Settable range: 0.00 V to 2.5 V If you make a mistake during input: press to cancel the input and start again. Press to close the setting screen. • The DC bias function is specifically for capacitor measurement. If it is used for resistor, inductor, and other elements with low DC resistance, the following are likely.
-
Page 177: Segment Sweep
5.4 Segment Sweep 5.4 Segment Sweep ANALYZER You can set multiple sweep ranges (up to 20) for the frequency or level and perform the sweep continuously. What is a Segment? A segment refers to one block for which individual settings such as the sweep range, number of sweep points, and measurement signal level can be set. - Page 178 5.4 Segment Sweep When segment sweep Sweep Settings Segment 1 Segment 2 Segment 3 Sweep parameter Frequency Frequency Frequency Sweep Range 1.0000kHz to 5.0000kHz 10.000kHz to 100.00kHz 100.00 kHz to 5.0000MHz Number of sweep point 201 points 201 points 399 points Setting method of sweep Linear points...
- Page 179 5.4 Segment Sweep Procedure Analyzer Initial Screen Analyzer Basic Settings Segment Selection to select the segment for which to change the setting, and press When you want to add a segment: Press When you want to delete a segment: to select the segment and press Segment Setting Select the segment setting.
- Page 180 5.4 Segment Sweep Sweep Point Setting Segment Setting • The setting method of the sweep points is fixed to (sweep start value and end value set- tings). • For the advanced setting method of sweep points, refer to "5.3.1 Setting Sweep Points" (p. 143). Setting the measurement level.
- Page 181 5.4 Segment Sweep Setting the measurement frequency. (When the setting is , or Measurement Frequency Setting Press to set the frequency. Settable range: 4.00 Hz to 5.0000 MHz Press to close the setting screen. Press to change the input method. The measurement frequency that can be set varies depending on the set sweep point range.
- Page 182 5.4 Segment Sweep Setting the measurement speed. Measurement Speed Setting Press Select the measurement speed. High-speed measurement Normal-speed measurement Increases measurement accuracy. Measurement accuracy is better than SLOW. Press to close the setting screen. Setting the average. Measurement Averaging Setting Press to enter the number of averaging times.
- Page 183 5.4 Segment Sweep Setting the DC bias Press DC Bias Setting Select ON/ OFF for the DC bias. Sets the DC bias to OFF. Sets the DC bias to ON. Press this button when using an external DC bias unit. The DC bias will be set to ON, and the bias value will be set to 0.00 V.
-
Page 184: Setting The Graph Display Method
5.5 Setting the Graph Display Method 5.5 Setting the Graph Display Method ANALYZER 5.5.1 Setting the Horizontal Axis Overwrite Setting When sweep measurement is to be performed repeatedly, set the graph draw method. If you set overwrite, you can check the variations of the element in a graph. Procedure Analyzer Initial Screen Graph Settings... -
Page 185: Horizontal Axis Scale Setting
5.5 Setting the Graph Display Method Horizontal Axis Scale Setting Set the scale of the horizontal axis. Procedure Analyzer Initial Screen Graph Settings Graph Settings Press Horizontal Axis Scale Setting Select the draw type. Sets the horizontal axis to linear (linear axis). Sets the horizontal axis to log (logarithmic axis). - Page 186 5.5 Setting the Graph Display Method How to Check the Set Horizontal Axis Scale If the horizontal axis display scale is changed, the horizontal axis scale of the graph display screen changes as shown in the figures below. (The horizontal axis scale of the graph also changes when the setting method of the sweep points is changed.) See"Setting the start value and end value of the sweep"...
-
Page 187: Span Setting
5.5 Setting the Graph Display Method Span Setting The span can only be set for segment sweep. With this instrument, you can select single span mode and segment span mode. Draws the measurement result for each segment on the same hori- Single Span Mode zontal axis. - Page 188 5.5 Setting the Graph Display Method Comparison of Single Span Mode and Segment Span Mode The following shows an example of the graph display methods for single span mode and segment mode. In this example, sweep ranges such as the following are set for the sweep parameter frequency. Sweep Settings Segment1 Segment2...
-
Page 189: Setting The Vertical Axis
5.5 Setting the Graph Display Method 5.5.2 Setting the Vertical Axis Draw Color Setting Set the color of the graph to display on the screen. You can set a graph color for each parameter. Further- more, in the case of segment sweep, you can set a color for each segment. Procedure Analyzer Initial Screen Graph Settings... - Page 190 5.5 Setting the Graph Display Method Select the segment for which to set the color. The setting differs depending on "5.2.6 Segment Setting" (p. 142). When the setting is When the setting is Graph Color Setting When Segment Sweep To reflect the color of segment 1 to all segments: Press To restore the colors of all segments to...
-
Page 191: Vertical Axis Scale Setting
5.5 Setting the Graph Display Method Vertical Axis Scale Setting Set the draw method for the vertical axis scale to linear axis or logarithmic axis. Procedure Analyzer Initial Screen Graph Settings Graph Settings Press Horizontal Axis Scale Setting Select the draw type. Sets the vertical axis to linear (linear axis). - Page 192 5.5 Setting the Graph Display Method Manual Scaling Setting Set the upper and lower limit values for the vertical axis. Procedure Analyzer Initial Screen Graph Settings Graph Settings Press Manual Scaling Setting Select the draw mode. Sets the upper and lower limit values manually. Sets the upper and lower limit values from the measurement values automatically.
- Page 193 5.5 Setting the Graph Display Method MANUAL setting Manual Scaling Setting Set the upper and lower limit values. Press Press and use the numeric keypad to en- ter the upper limit value. Settable range: -9.9999G to 9.9999G Press to confirm the setting. Press and use the numeric keypad to enter the lower limit value.
-
Page 194: Setting Grid Display
5.5 Setting the Graph Display Method 5.5.3 Setting Grid Display Set the sweep parameter for which to display grid lines. Procedure Analyzer Initial Screen Graph Settings Graph Settings Press Grid Display Setting Select the sweep parameter for which to display grid lines. - Page 195 5.5 Setting the Graph Display Method About the Timing for Graph Drawing With this instrument, in order to perform analog measurement efficiently, the timing with which measurement is actually performed and timing with which the data is reflected in the graph differs slightly. The following shows the timing with which analog measurement is performed continuously for multiple mea- surement points and the timing with which the graph is drawn.
-
Page 196: Checking The Measurement Values
5.6 Checking the Measurement Values 5.6 Checking the Measurement Values ANALYZER You can display a cursor in the measurement screen to check the measurement value of a measurement point. You can use the search function to easily find the maximum value, minimum value, and peak value. 5.6.1 Setting the Cursor Set the cursor to display in the measurement screen. -
Page 197: Cursor Display Setting
5.6 Checking the Measurement Values Cursor Move Setting Cursor display setting (p. 189) Cursor move setting (p. 190) Cursor A search setting (p. 190) Cursor B search setting (p. 190) Auto search setting (p. 192) Press to close the setting screen. Cursor Display Setting Cursor Display Setting Set the cursor to display in the measurement... -
Page 198: Cursor Move Setting
5.6 Checking the Measurement Values Cursor Move Setting This can only be set when is selected for the display cursor setting. Cursor Move Setting Select the cursor to move using the cursor move keys on the measurement screen. "5.6.2 Moving the Cursor" (p. 193) Moves cursor A. -
Page 199: Search Target Parameter Setting
5.6 Checking the Measurement Values Search Target Parameter Setting Search Function Setting Set the search target parameter. "Performing Measurement Value Search" (p. 194) Sets the measurement result of parameter 1 as the search target. Sets the measurement result of parameter 2 as the search target. -
Page 200: Auto Search Setting
5.6 Checking the Measurement Values Set the filter. This can be set when is selected for the search function setting. "Performing Measurement Value Search" (p. 194) • When judging the local maximum value or local minimum value, set a filter. •... -
Page 201: Moving The Cursor
5.6 Checking the Measurement Values 5.6.2 Moving the Cursor You can move a cursor and check the measurement value at the current cursor position. The cursor(s) set in of "Cursor Display Setting" (p. 189) and of "Cursor Move Setting" (p. 190) can be moved. Procedure Analyzer Initial Screen Measurement Value List Display... -
Page 202: Performing Measurement Value Search
5.6 Checking the Measurement Values 5.6.3 Performing Measurement Value Search You can perform a measurement value search for the measurement results of one sweep using the method set in the search function setting ( , or When you perform a search, the cursor moves to the search result point so that you can check the search execution result. - Page 203 5.6 Checking the Measurement Values Search Execution Result for Each Search Function Setting In the search example, only parameter 1 is enabled. Maximum value search result Minimum value search result Maximum Value Search Minimum Value Search Minimum Maximum Target value search result The target value is set to 10.00000.
- Page 204 5.6 Checking the Measurement Values Local minimum value search result Local Minimum Value Search Local minimum value Local minimum value point In the search results, the sweep point that is considered to be the local minimum value is indicated bellows the X axis. The measurement values of the local maximum value are indicated in order from the smallest point to largest point as "1, 2, 3,...,"...
-
Page 205: Judging Measurement Results (Comparator Function)
5.7 Judging Measurement Results (Comparator Function) 5.7 Judging Measurement Results (Comparator Function) ANALYZER With the comparator function, you can preset a judgment area and judge whether measurement values are within the judgment area. Judges whether the measurement values of sweep points are within Area Judgment the judgment area. - Page 206 5.7 Judging Measurement Results (Comparator Function) Procedure Analyzer Initial Screen Comparator Setting Comparator Setting Press Comparator Mode Setting Press Press to confirm the setting.
- Page 207 5.7 Judging Measurement Results (Comparator Function) Comparator Setting Press Judgment Parameter Setting Select the parameter to judge. Sets the upper and lower limit values and judges the measurement results for the first measurement parameter. Sets the upper and lower limit values and judges the measurement results for the second measurement parameter.
- Page 208 5.7 Judging Measurement Results (Comparator Function) Comparator Setting Press Set the judgment area to display in the mea- Judgment Area Setting surement screen. Displays the judgment area of the first measurement parameter. Displays the judgment area of the second measurement parameter. Displays no judgment area.
- Page 209 5.7 Judging Measurement Results (Comparator Function) When the setting is Set the judgment area. Upper/Lower Limit Value Settings Sets the upper and lower limit values based on the current measurement values. Sets the reference value, upper limit value, and lower limit value. Sets the upper and lower limit values as percentage values relative to the reference value.
- Page 210 5.7 Judging Measurement Results (Comparator Function) Set the reference value, upper limit value, and lower limit value. Press and use the numeric keypad to set the Upper/Lower Limit & Reference Value Settings reference value. Settable range: -9.999999G to 9.999999G Press to confirm the reference value.
- Page 211 5.7 Judging Measurement Results (Comparator Function) When the setting is When the segment function is enabled, a different judgment area can be set for each segment. Judgment Area Setting Set the judgment area. Sets the upper and lower limit values based on the current measurement values.
- Page 212 5.7 Judging Measurement Results (Comparator Function) Set the upper and lower limit values based on the current measurement values. Press and use the numeric keypad to set the Upper/Lower Limit Value Settings upper limit value. • Settable range: -999.9999 to999.9999 (Set as a % value) •...
- Page 213 5.7 Judging Measurement Results (Comparator Function) Set the reference value, upper limit value, and lower limit value. Press and use the numeric keypad to set the Upper/Lower Limit & Reference Value Settings reference value. Settable range: -9.999999G to 9.999999G Press to confirm the reference value.
- Page 214 5.7 Judging Measurement Results (Comparator Function) Upper/Lower Limit Value Settings Press , and set the judgment area of the second parameter in the same way. (When the Setting is Press to return to the measurement screen.
- Page 215 5.7 Judging Measurement Results (Comparator Function) The comparator range is displayed in gray, and the judgment result is displayed after the sweep ends. When Judgment Result is IN When Judgment Result is NG Judgment result of each parameter Judgment result of each sweep point When Judgment Result of Each Sweep is LO When Judgment Result of Each Sweep is HI...
-
Page 216: Peak Judgment
5.7 Judging Measurement Results (Comparator Function) Peak Judgment With peak judgment, you can judge whether the peak value is within the judgment area. The judgment area can be set with the upper, lower, left, and right limit values. Indicates the overall judgment result. When all of the peak values are within the judgment area. - Page 217 5.7 Judging Measurement Results (Comparator Function) Comparator Mode Setting Press Press to confirm the setting. Comparator Setting Press Judgment Parameter Setting Select the parameter to judge. Sets the judgment area and judges the measurement results for the first measure- ment parameter. Sets the judgment area and judges the measurement results for the second mea- surement parameter.
- Page 218 5.7 Judging Measurement Results (Comparator Function) Comparator Setting Press Judgment Area Setting Set the judgment area to display in the mea- surement screen. Displays the judgment area of the first measurement parameter. Displays the judgment area of the second measurement parameter. Displays no judgment area.
- Page 219 5.7 Judging Measurement Results (Comparator Function) Peak No. Setting to select the number of the local maximum value or local minimum value for peak judgment. L-MAX • Select the number of the local maxi- mum value. With regards to the numbers, the val- ues are numbered like “1, 2, 3..."...
- Page 220 5.7 Judging Measurement Results (Comparator Function) to select the condition to set for the judgment area. Select any of the following items for the condition to set for the judgment area. • Segment No. • Measurement parameter • Local maximum value/Local minimum value judgment area condition Setting Local maximum value (MAX), Local minimum value (MIN)
- Page 221 5.7 Judging Measurement Results (Comparator Function) Use the numeric keypad to set the left, right, upper, and lower limit values. Press and use the numeric keypad to enter the Left/Right Limit Value Settings left limit value. The possible setting range differs depending on the sweep parameter.
- Page 222 5.7 Judging Measurement Results (Comparator Function) When Editing Local Minimum Value to select the local minimum value (MIN) you want to edit, and press Set the left, right, upper, and lower limit values in the same way. Press to return to the measurement screen. The comparator range, overall judgment indication, and details of the judgment result are displayed in the graph.
- Page 223 5.7 Judging Measurement Results (Comparator Function) When the judgment result is IN Analyzer Initial Screen When you want to display details of the judg- ment result Press Measurement Result List Press Judgment Result Details Display Display details of the judgment result. "Viewing Details of the Judgment Result"...
- Page 224 5.7 Judging Measurement Results (Comparator Function) Viewing Details of the Judgment Result Whether the peak value set in "Peak Judgment" (p. 208) is within the judgment area is indicated as shown below. Example: When segment sweep Segment No. Measurement value maximum or parameter Judgment result...
-
Page 225: Editing Judgment Points
5.8 Editing Judgment Points 5.8 Editing Judgment Points ANALYZER You can edit the setting of each sweep point. For comparator measurement, you can set the upper and lower limit values of each sweep point. • When the segment function is ON, the settings of judgment points cannot be edited. •... - Page 226 5.8 Editing Judgment Points Edit Sweep Point Sweep Point & Upper/Lower Limit Value Settings Set each of the following settings. Press Set the sweep point. Set the upper limit value of the comparator. Set the lower limit value of the comparator. Sweep Point Setting Sweep Point Setting Use the numeric keypad to enter the setting of the sweep point and press a unit key to confirm the...
-
Page 227: Application Settings
5.9 Application Settings 5.9 Application Settings ANALYZER 5.9.1 Saving Measurement Results (Memory function) You can save the measurement results inside the instrument. (Up to 32,000 items) The saved measurement results can be saved to a USB flash drive. They can also be acquired using a communication command. (The memory function is the same in mode and mode.) The items saved to memory are in accordance with the... - Page 228 5.9 Application Settings Memory Function Setting to set the number of mea- surement results. Settable range: 1 to 32000 The number of measurement results can only be set when the memory function is set to OFF. Memory Function Setting Select ON/OFF for the memory function. Sets the memory function to OFF.
- Page 229 5.9 Application Settings Saving Data in Instrument Memory to USB Flash Drive Memory Function Setting Connect a USB flash drive. (p. 329) Press to save the data in the instru- ment memory to a USB flash drive. When this function is used to save the data in the in- strument memory to a USB flash drive, the data is cleared from the instrument memory automatically.
-
Page 230: Detecting Open During 2-Terminal Measurement (High-Z Reject Function)
5.9 Application Settings 5.9.2 Detecting OPEN during 2-terminal Measurement (HIGH-Z Reject Function) This function is for outputting a measurement terminal connector error when the measurement result is high relative to the set judgment reference value. The setting value can be set as an absolute value, and the error is output via the EXT I/O. - Page 231 5.9 Application Settings HIGH-Z Setting Select ON/ OFF for the HIGH-Z reject function. Sets the HIGH-Z reject function to OFF. Sets the HIGH-Z reject function to ON. HIGH-Z Setting to set the judgment reference value. Settable range: 0% to 30000% •...
-
Page 232: Setting The Detection Sensitivity For
5.9 Application Settings 5.9.3 Setting the Detection Sensitivity for Measure- ment Errors (Overflow or Underflow) The instrument monitors the detectable range of the measurement signals (voltage and current) during mea- surement, and displays a measurement error (OVERFLOW or UNDERFLOW) if that range is exceeded. However, if measurement is performed under a noisy environment, the detection range may be exceeded resulting in a measurement error regardless of whether an appropriate measurement range is set. - Page 233 5.9 Application Settings Level Value Setting to enter the level value. Settable range: 1 to 32 Press to close the setting screen. The higher the setting value, the greater the measurement errors. If the setting value is set to 2 or higher, the accuracy specifications may not be able to be satisfied. Furthermore, shifting to the most suitable range may not occur during auto range opera- tion.
-
Page 234: Setting The Delay Time From The Output Of Comparator Judgment Results Until Output Of Eom (Low) And Resetting Judgment Results
5.9 Application Settings 5.9.4 Setting the Delay Time from the Output of Com- parator Judgment Results until Output of EOM (LOW) and Resetting Judgment Results You can set the delay time for the period from the output of the comparator and BIN judgment results until the output of EOM (LOW) from the EXT I/O. - Page 235 5.9 Application Settings I/O Judgment Setting Select whether to reset the comparator judg- ment results simultaneously with the measure- ment start signal. Stores the last judgment results until the next judgment results are output. Resets the judgments results at the time of the measurement start signal.
-
Page 236: Enabling Trigger Input For During Measurement And Setting The Valid Edge Of Trigger Input
5.9 Application Settings 5.9.5 Enabling Trigger Input for during Measurement and Setting the Valid Edge of Trigger Input You can select whether to enable or disable trigger input from the EXT I/O during measurement (during EOM (HI) output after trigger is received). Furthermore, you can also select either the rising edge or falling edge as the valid edge of trigger input from the EXT I/O. -
Page 237: Setting The Eom Output Method
5.9 Application Settings 5.9.6 Setting the EOM Output Method The higher the measurement frequency, the shorter the time that INDEX and EOM are high (off). When the high (off) time is too short due to characteristics of the input circuit, the instrument can be configured to main- tain the low (on) state for a preset time once EOM changes to low (on) before reverting the signal to high (off) after the completion of measurement. -
Page 238: Disabling Key Operation (Key-Lock Function)
5.9 Application Settings 5.9.7 Disabling Key Operation (Key-lock Function) If you turn the key-lock function ON, all operations except disabling the key-lock are disabled to protect the settings. You can also set a passcode (security code). Procedure Analyzer Initial Screen Application Settings Application Settings Press... - Page 239 5.9 Application Settings Setting the Passcode of the Key-lock Passcode Setting Press when the key-lock setting is Use the numerical keypad to enter the pass- code, press , and then press Settable range: 1 to 4 digits If a passcode is set, it needs to be entered to disable the key-lock. Take care not to forget the set passcode.
- Page 240 5.9 Application Settings If you forget the passcode, perform a full reset to restore the instrument to the factory default settings.(p. 406) Key Lock Disable Error If the error indication shown on the left appears, check the following items. Cause Remedy Press and enter the passcode.
-
Page 241: Setting The Lcd To On/ Off
5.9 Application Settings 5.9.8 Setting the LCD to ON/ OFF You can turn the LCD ON/ OFF. Setting the LCD to OFF saves power because the LCD turns off if the panel is not touched for 10 seconds. Procedure Analyzer Initial Screen Application Settings Application Settings Press... -
Page 242: Setting Operation Sounds (Beep Sounds)
5.9 Application Settings 5.9.9 Setting Operation Sounds (Beep Sounds) You can set the operation sound and each of the beep sounds for judgment results. Procedure Analyzer Initial Screen Application Settings Application Settings Press Beep sound settings for when comparator judgment When a comparator judgment is made, no beep Beep Sound Settings sound is emitted. -
Page 243: Synchronous Output Function)
5.9 Application Settings 5.9.10 Applying the Signal to the Sample Only during Measurement (Trigger Synchronous Output Function) This function enables the measurement signal to be output after measurement is triggered for the initial sweep point only, ensuring that the signal is applied to the sample during measurement only. Thus reducing the generation of heat in the sample and decreasing electrode wear. - Page 244 5.9 Application Settings Trigger Sync Setting to set the wait time from after the measurement signal is output by applying a trigger to the start of measurement. Settable range: 0.0010 s to 9.9999 s When you want to return the time to the ini- tial state: Press The set time is set to 0.0010 s.
-
Page 245: 11Initializing (System Reset)
5.9 Application Settings 5.9.11 Initializing (System Reset) In the event of the instrument malfunctioning, check "Before returning for repair" (p. 405). If you do not know the cause of the problem, perform a system reset to restore the instrument to its factory default settings. -
Page 246: Equivalent Circuit Analysis Function
The equivalent circuit analysis function estimates equivalent circuit constants based on measurement results. The IM3570 can estimate 3-element model and 4-element model constants as illustrated below. By using the simulation function, you can display frequency characteristic ideal values using estimation results or user-con- figured constants. -
Page 247: 2Configuring Basic Settings For Analysis
5.10 Equivalent Circuit Analysis Function 5.10.2 Configuring Basic Settings for Analysis Setting the equivalent circuit model Select the equivalent circuit model you wish to use for equivalent circuit analysis. By selecting the appropriate equivalent circuit model, you will be able to estimate constants more accurately. Procedure Analyzer Initial Screen Application Settings... - Page 248 5.10 Equivalent Circuit Analysis Function Select the model to use in equivalent circuit Selecting the equivalent circuit model analysis. Sets the method used to select the equivalent circuit model. Turns off the equivalent circuit function. Selects the equivalent circuit model manually. Automatically selects the optimal equivalent cir- cuit model.
-
Page 249: Setting The Method Of Analysis
5.10 Equivalent Circuit Analysis Function Setting the method of analysis This section describes how to set whether to perform equivalent circuit analysis automatically after measure- ment completes or to wait until is pressed. Procedure Analyzer Initial Screen Application Settings Application Settings Press Setting the equivalent circuit Press... - Page 250 5.10 Equivalent Circuit Analysis Function Setting the method of analysis Selects the method of analysis. Performs analysis when is pressed. Performs analysis automatically after measure- ment completes. Press to close the setting screen. • is valid only when the trigger is set to "Sequential sweep" or "Step sweep." Analysis will not be performed automatically when the trigger is set to "Repeat sweep."...
-
Page 251: Setting The Frequency Range To Analyze
5.10 Equivalent Circuit Analysis Function Setting the frequency range to analyze This section describes how to set the frequency range for which to perform equivalent circuit analysis when using normal sweep. By using this function, you can limit the local extreme values used in analysis when there are multiple local extreme values in the sweep range. - Page 252 5.10 Equivalent Circuit Analysis Function Setting the frequency range to analyze Press and enter the frequency at which to start analysis with the numeric keypad. Press and enter the frequency at which to stop analysis with the numeric keypad. Settable range: 4 Hz to 5 MHz To clear the analytical range, press Press to accept the frequency range.
-
Page 253: Selecting The Segment To Analyze
5.10 Equivalent Circuit Analysis Function Selecting the segment to analyze This section describes how to select which segment to target for estimation during a segment sweep. By using this function, you can specify which segment to use in analysis when dividing the frequency range into multiple segments for measurement. - Page 254 5.10 Equivalent Circuit Analysis Function Setting the segment to analyze Select the segment number to use in equivalent circuit analysis with Targets all segments for analysis. 1 to 20 Targets only the set segment number for analy- sis. Press to close the setting screen. Example of analysis using a selected segment Analysis result The No.
-
Page 255: Configuring Calculation Of The Electromechanical Coupling Coefficient (K)
5.10 Equivalent Circuit Analysis Function Configuring calculation of the electromechanical coupling coefficient (K) This section describes how to configure settings for calculating the electromechanical coupling coefficient using the E model. Procedure Analyzer Initial Screen Application Settings Application Settings Press Electromechanical Coupling Coefficient Settings Press... - Page 256 5.10 Equivalent Circuit Analysis Function Oscillation Mode Settings Select the oscillation mode. Electromechanical coupling coefficient for pla- nar oscillation – ------------------------------------------------------- - – Electromechanical coupling coefficient for long-side extension oscillation -- - ---- - -------------------------------------------------------- ...
- Page 257 5.10 Equivalent Circuit Analysis Function Coefficient Settings Set a different coefficient relative to Poisson's ratio only when selecting (planar oscillation) as the oscillation mode. Press and set the coefficient with the numeric keypad. Press to accept the coefficient. Settable range: 0.000001 to 1.000000 To return to the previous screen without making any change to the set value, press the key when the...
-
Page 258: Setting The Position At Which To Display Analysis Results
5.10 Equivalent Circuit Analysis Function Setting the position at which to display analysis results This section describes how to set the position at which to display analysis results. If the graph and analysis results displays overlap, set the position so that estimated values are easy to read. Procedure Analyzer Initial Screen Application Settings... - Page 259 5.10 Equivalent Circuit Analysis Function Setting the analysis result display position Select the position at which to display analysis results. Displays estimate results on the left. Displays estimate results on the right. Displays estimate results on the top. Displays estimate results on the bottom. Press to close the setting screen.
-
Page 260: 3Performing Equivalent Circuit Analysis
Since the local maximum and local minimum measurement points are used when performing equivalent cir- cuit analysis with the IM3570, the frequency range should be set to the range for which the local extreme val- ues can be measured. When performing analysis using the B and C models, configure the settings so that the lowest possible frequencies are measured since low-frequency values are used. -
Page 261: Performing Equivalent Circuit Analysis
5.10 Equivalent Circuit Analysis Function Performing equivalent circuit analysis When the method of analysis is set to AUTO, analysis is performed automatically after measurement com- pletes, and the results are displayed. Equivalent circuit analysis results (normal measurement) Equivalent circuit analysis results (X-Y display) Analysis result (X-Y display) Analysis result... - Page 262 When performing analysis using the B and C models, it is necessary to measure frequencies that are as low as possible, but low-frequency measurement is time-consuming. The IM3570 uses measured values for the lowest frequency in the measurement range. By setting a low frequency for one point in the sweep range, it is possible to conduct a precise analysis in a short period of time.
- Page 263 5.10 Equivalent Circuit Analysis Function Sweep point settings Enter as low a frequency as possible. Sweep point list Verify that a low frequency has been set for just one point on the sweep point list. Example of a proper analysis Measured is performed and followed by equivalent circuit estimation.
- Page 264 5.10 Equivalent Circuit Analysis Function When unable to detect resonance points If the instrument is unable to detect the resonance points that are used in analysis, the following error mes- sage will be displayed. Set the sweep range so that it includes resonance points. Additionally, verify that the frequency range and segments used in the analysis are appropriately configured.
- Page 265 5.10 Equivalent Circuit Analysis Function When there are no measured values that can be analyzed When there are no measured values that can be analyzed, the following error message will be displayed. If measurement has not yet been performed, perform equivalent circuit analysis after measurement. Screen displayed when there are no measured values that can be analyzed...
-
Page 266: 4Simulating Frequency Characteristics
5.10 Equivalent Circuit Analysis Function 5.10.4 Simulating Frequency Characteristics This section describes how to simulate frequency characteristics using estimated or user-defined constants. Procedure Measurement Screen Press Measurement Screen To perform a simulation based on analysis results, press To set constants, press Differences between observed values and simulation values (For more information, refer to the notes.) - Page 267 5.10 Equivalent Circuit Analysis Function The difference between observed values and simulated values is calculated for each mea- surement parameter in order to judge the suitability of equivalent circuit analysis results. The frequency range that was analyzed or the frequency range for the segment number that was analyzed is used as the range for calculating this difference.
-
Page 268: 5Judging Analysis Results
5.10 Equivalent Circuit Analysis Function 5.10.5 Judging analysis results This section describes how to use the comparator function to determine whether estimation results fall within judgment standards. Setting the Upper or Lower Limit Value Before using the comparator function, you must set upper and lower limit values for the judgment standards. Procedure Analyzer Initial Screen Application Settings... - Page 269 5.10 Equivalent Circuit Analysis Function Comparator Setting Press to enable the comparator function. Press key to confirm the setting. Setting the equivalent circuit Select the constant for which you wish to set judgment standards. Press and use the numeric keypad to Upper/Lower Limit Value Settings set the upper limit value.
-
Page 270: Making Judgments Using Analysis Results
5.10 Equivalent Circuit Analysis Function Setting the equivalent circuit You can check the set upper and lower limit values on the Equivalent Circuit Settings screen. Top row : Upper limit values Bottom row : Lower limit values Press to close the setting screen. Making judgments using analysis results When the comparator is on and a judgment area has been set, the estimated values and judgment results will be displayed after equivalent circuit estimation. -
Page 271: 6Generating X-Y Displays
5.10 Equivalent Circuit Analysis Function 5.10.6 Generating X-Y Displays When the IM9000 Equivalent Circuit Analysis Firmware is installed, you can generate an X-Y display of mea- surement results. This display consists of a graph with measured values for the No. 1 parameter on the X-axis and measured values for the No. - Page 272 5.10 Equivalent Circuit Analysis Function...
-
Page 273: Chapter 6 Continuous Measurement Function
6.1 Initial Screen Continuous Measurement Chapter 6 Function 6.1 Initial Screen CONTINUOUS The continuous measurement function reads in order the measurement conditions saved with the panel save function, and performs a number of measurements continuously. It is possible to mix the measurement condi- tions of the LCR and analyzer. -
Page 274: Setting Continuous Measurement
6.2 Setting Continuous Measurement 6.2 Setting Continuous Measurement CONTINUOUS Before you perform continuous measurement, set which panels are target for continuous measurement. Save the measurement conditions with the panel save function in LCR mode or analyzer mode in advance. Procedure Continuous Measurement Initial Screen Basic Settings A list of the measurement conditions saved with... -
Page 275: Performing Continuous Measurement
6.3 Performing Continuous Measurement 6.3 Performing Continuous Measurement CONTINUOUS Execute Continuous Measurement Panels that were set to in the setting screen are displayed in the list. Press Stop Continuous Measurement When you want to stop continuous measurement: Press In the following circumstances, measurement will not continue after it: •... -
Page 276: Checking The Continuous Measurement Results
6.4 Checking the Continuous Measurement Results 6.4 Checking the Continuous Measurement Results CONTINUOUS Example: When you want to check the measurement results of analyzer mode Indicates the Indicates the Indicates the judgment results. panel numbers. measurement LCR mode: First parameter and third parameter values. -
Page 277: Setting Application Settings
6.5 Setting Application Settings 6.5 Setting Application Settings CONTINUOUS 6.5.1 Setting the Display Timing Set the draw timing for during continuous measurement. If the display timing is set to , the time for continuous measurement becomes long because the screen is updated every time measurement is performed. If it is set to to give priority to the measurement time, the screen update time becomes short. -
Page 278: Setting The Trigger
6.5 Setting Application Settings 6.5.2 Setting the Trigger This section describes how to set the trigger. In continuous measurement mode, measurement will be per- formed in accordance with the trigger settings configured as described in this section. Two types of triggers can be set: sequential measurement and step measurement. -
Page 279: Halting Continuous Measurement At A Fail Judgment Result
6.5 Setting Application Settings 6.5.3 Halting Continuous Measurement at a FAIL judg- ment result Measurement can be halted when the judgment result is FAIL (HI/ LO/ OUT OF BINS) and the judgment func- tion for the measured panel (comparator, BIN function) is enabled. Continuous measurement is halted regard- less of the settings when the measurement result yields a contact check error or HIGH-Z reject error in low Z high accuracy mode. -
Page 280: Setting The Lcd To On/ Off
6.5 Setting Application Settings 6.5.4 Setting the LCD to ON/ OFF You can turn the LCD ON/ OFF. Setting the LCD to OFF saves power because the LCD turns off if the panel is not touched for 10 seconds. Procedure Continuous Measurement Initial Screen Application Settings Application Settings... -
Page 281: Chapter 7 Error Compensation
7.1 Setting Open Circuit Compensation Error Chapter 7 Compensation Compensate for errors caused by a fixture or measurement cable. 7.1 Setting Open Circuit Compensation ANALYZER With open circuit compensation, it is possible to reduce the influence of the floating impedance of the test cables and thereby to enhance the accuracy of measurement. -
Page 282: All Compensation
7.1 Setting Open Circuit Compensation 7.1.1 All Compensation Simultaneously acquire the open compensation values for all measurement frequencies. Procedure LCR Initial Screen Compensation Screen Open Compensation Press Open Compensation Setting Select and press to close the setting screen. - Page 283 7.1 Setting Open Circuit Compensation The compensation values from last time are dis- All Compensation played in a confirmation screen. (If compensation has never been performed, the compensation values become 0.) Check that the measurement cable is in an open circuit state.
- Page 284 7.1 Setting Open Circuit Compensation Acquiring open compensation values for some frequencies only Procedure All Compensation Press in the all compensation screen. Configuring DC open compensation Setting the compensation range Performs DC open compensation. Does not perform DC open compensation. Configuring AC open compensation Press and set the start frequency...
-
Page 285: Spot Compensation
7.1 Setting Open Circuit Compensation 7.1.2 Spot Compensation Acquire the compensation values at the set measurement frequencies. Measurement frequencies can be set for up to five points. Procedure Open Compensation Setting Select in the open circuit compensa- tion screen, and press to confirm the selection. - Page 286 7.1 Setting Open Circuit Compensation The compensation values from last time are dis- Spot Compensation Value Setting played in a confirmation screen. (If compensation has never been performed, the compensation values become 0.) Check that the measurement cable is in an open circuit state.
- Page 287 7.1 Setting Open Circuit Compensation When Open Compensation Failed If compensation fails, a window such as the following will be displayed. When an error message appears and compensation has stopped (when is touched), open cir- cuit compensation is turned OFF. Error The open circuit compensation process is quite sensitive to noise - both noise originating externally and induced noise.Therefore, if open circuit compensation has been interrupted with a fault, you should check...
-
Page 288: Short Circuit Compensation
7.2 Short Circuit Compensation 7.2 Short Circuit Compensation ANALYZER With short circuit compensation, it is possible to reduce the influence of the residual impedance of the test cables and thereby to enhance the accuracy of measurement. It is effective for test samples whose impedance is relatively low. The comparator decision mode can be set as one of the following: All Compensation Compensation values are obtained for all test frequencies. - Page 289 7.2 Short Circuit Compensation Before Performing Screen Operations Necessary item: Shorting bar This shorting bar is for short circuiting together the ends of the test leads. Use an object whose impedance is as low as possible. If you use a metallic wire or the like as a shorting bar, try to ensure that it is as thick and short as possible.
-
Page 290: All Compensation
7.2 Short Circuit Compensation 7.2.1 All Compensation Simultaneously acquire the short compensation values for all measurement frequencies. Procedure LCR Initial Screen Compensation Screen Short Compensation Press Short Compensation Setting Select and press to close the setting screen. - Page 291 7.2 Short Circuit Compensation The compensation values from last time are dis- All Compensation played in a confirmation screen. (If compensation has never been performed, the compensation values become 0.) Check that the measurement cable is in a short-circuit state. Press When you do not want to acquire the compen- sation values: Press...
- Page 292 7.2 Short Circuit Compensation Acquiring short compensation values for some frequencies only Procedure All Compensation Press in the all compensation screen. Configuring DC short compensation Setting the compensation range Performs DC short compensation. Does not perform DC short compensation. Configuring AC short compensation Press and set the start frequency for short compensation with the numeric...
-
Page 293: Spot Compensation
7.2 Short Circuit Compensation 7.2.2 Spot Compensation Acquire the compensation values at the set measurement frequencies. Measurement frequencies can be set for up to five points. Procedure Short Compensation Setting Select in the short circuit compen- sation screen, and press to confirm the selection. - Page 294 7.2 Short Circuit Compensation The compensation values from last time are dis- Spot Compensation Value Setting played in a confirmation screen. (If compensation has never been performed, the compensation values become 0.) Check that the measurement cable is in a short-circuit state.
- Page 295 7.2 Short Circuit Compensation When Short Compensation Failed When an error message appears and compensation has stopped, short circuit compensation is turned off. Error Check the following points before starting the short circuit compensation process again: • Check that the test cables are properly connected. •...
-
Page 296: Compensating Values To Match Reference Values (Load Compensation)
7.3 Compensating Values to Match Reference Values (Load Compensation) 7.3 Compensating Values to Match Refer- ence Values (Load Compensation) ANALYZER Compensate measurement values to match the element that will be the reference. With load compensation it is possible to calculate the compensation coefficient by measuring a reference sample with known data and perform the compensation for the test data obtained from the target sample. -
Page 297: 7.3 Compensating Values To Match
7.3 Compensating Values to Match Reference Values (Load Compensation) • When all of the compensation conditions match for load compensation, compensation is performed under the optimal conditions. • If the current measurement frequency and compensation frequency do not match, an error like the following is displayed in the initial screen. -
Page 298: 7.3 Compensating Values To Match
7.3 Compensating Values to Match Reference Values (Load Compensation) Procedure LCR Initial Screen Compensation Screen Load Compensation Value List Press Load Compensation Setting Select , and press confirm the selection. -
Page 299: 7.3 Compensating Values To Match
7.3 Compensating Values to Match Reference Values (Load Compensation) Load Compensation Value List to select the number of the load compensation condition to set. Press Set the compensation condition. • Compensation frequency (p. 293) • Compensation range (p. 294) • Type and value of the compensation level (p. 295) •... -
Page 300: 7.3 Compensating Values To Match
7.3 Compensating Values to Match Reference Values (Load Compensation) Load Compensation Value List If you select , the compensation values are acquired. • When data acquisition is completed, the reference sample compensation data is displayed on the screen. • When an error occurs during data acquisition, a “beep”... -
Page 301: 7.3 Compensating Values To Match
7.3 Compensating Values to Match Reference Values (Load Compensation) LCR Initial Screen When the load compensation is valid for the set measurement conditions, ON appears on the LOAD parameter in the Initial Screen. When the same compensation frequency has been set to multiple load compensation groups, only the group with the smallest number will be valid. -
Page 302: 7.3 Compensating Values To Match
7.3 Compensating Values to Match Reference Values (Load Compensation) Setting the Compensation Range Compensation Range Setting Press Select the range for compensation. Compensation Range Setting The range that can be set varies depending on the com- pensation frequency. Settable Frequency Range Setting Screen Range Entire... -
Page 303: 7.3 Compensating Values To Match
7.3 Compensating Values to Match Reference Values (Load Compensation) Setting the Type and Value of the Compensation Level Level Setting Press Level Setting Select the compensation level type. Open voltage level (p. 45) Voltage level between test sample terminals (p. 45) Current level between test sample terminals (p. -
Page 304: 7.3 Compensating Values To Match
7.3 Compensating Values to Match Reference Values (Load Compensation) Setting the DC Bias DC Bias Setting Press DC Bias Setting Select ON/ OFF for the DC bias. Sets the DC bias to OFF. Sets the DC bias to ON. to enter the DC bias value. Settable range: 0.00 to 2.50 V Press to close the setting screen. -
Page 305: 7.3 Compensating Values To Match
7.3 Compensating Values to Match Reference Values (Load Compensation) Setting of Parameter to Use for Reference Value Parameter Setting Press Parameter Setting Select the parameter mode of the reference value to be set. Press to close the setting screen. "1.3.7 Parameter Settings Screen" (p. 25) •... -
Page 306: 7.3 Compensating Values To Match
7.3 Compensating Values to Match Reference Values (Load Compensation) Reference Value Settings Reference Value Setting Press Reference Value Setting Use the numeric keypad to enter the reference value. Press a unit key to confirm the setting. Press to confirm the setting. Also set in the same way. -
Page 307: 7.3 Compensating Values To Match
7.3 Compensating Values to Match Reference Values (Load Compensation) When You Want to Reset All Settings If you press , all settings are cancelled and you can start again from the compensation fre- quency settings. Load Compensation Setting When You Want to Use the Current Measurement Conditions as the Load Compensation Conditions Press to acquire the current measurement conditions (frequency, range, measurement sig-... -
Page 308: 7.3 Compensating Values To Match
7.3 Compensating Values to Match Reference Values (Load Compensation) When Load Compensation Failed If compensation fails, a window like the following appears. An error message is displayed, and if compen- sation is cancelled with , load compensation is turned OFF. Screen When Compensation Failed When You Want to Disable Load Compensation Press... -
Page 309: Compensating Measurement Cable Errors (Cable Length Compensation)
7.4 Compensating Measurement Cable Errors (Cable Length Compensation) 7.4 Compensating Measurement Cable Errors (Cable Length Compensation) ANALYZER With high frequency measurement, the influence of the cable results in large measurement errors. Setting the cable length enables you to reduce the measurement errors. Use a coaxial cable with 50 ... -
Page 310: Calculating Values Scaling
7.5 Calculating Values Scaling 7.5 Calculating Values Scaling ANALYZER Scaling applies a compensation function to the measurement value.This function can be used to provide com- patibility among measurement devices. Set the compensation coefficients a and b for the measurement val- ues of the first to fourth parameters to compensate by the following expression. - Page 311 7.5 Calculating Values Scaling Scaling Compensation Setting Select the compensation coefficient of the parameter you want to change. The parameters and compensation coefficient numbers correspond as shown below. Parameter 1 Parameter 2 Parameter 3 Parameter 4 Compensation Coefficient Setting Press Compensation Coefficient Setting Use the numeric keypad to set compensation coefficient A.
- Page 312 7.5 Calculating Values Scaling Compensation Coefficient Setting Press and use the numeric keypad to set compensation coefficient in the same way as for A. Settable range: -9.999999G to 9.999999G To return to the previous screen without making any change to the set value, press the key when the screen is in the state with nothing being displayed (the state after pressing the...
-
Page 313: Chapter 8 Setting The System
8.1 Setting the Interface Setting the Chapter 8 SYSTEM 8.1 Setting the Interface ANALYZER You can control the instrument from a computer via the GP-IB, RS-232C, USB, and LAN interfaces. Printing can also be performed with an RS-232C printer. Procedure This operation is possible in any of the mode, mode. -
Page 314: Checking The Version Of The Instrument
8.2 Checking the Version of the Instrument 8.2 Checking the Version of the Instrument Procedure This operation is possible in any of the mode, mode. LCR Initial Screen Instrument Info Instrument Info Check the version of the instrument. This text is displayed only when the IM9000 Equivalent Circuit Analysis Firmware has been installed. -
Page 315: Self Checks (Self Diagnosis)
Perform panel compensation (p. 308) if they are not highlighted or the red appears. If there is still problem after performing panel calibration, the panel may be malfunctioning. Contact your dealer or Hioki representative. - Page 316 8.3 Self Checks (Self Diagnosis) Panel Compensation You can perform position compensation of the touch panel. Procedure This operation is possible in any of the mode, mode. LCR Initial Screen Self Checks Self Checks Press Panel Compensation Press in the location of continuously until the green appears.
- Page 317 8.3 Self Checks (Self Diagnosis) Panel Compensation Complete Press to close the setting screen. Press to start panel calibration from the beginning. If the indication does not appear, the instru- ment needs to be repaired. Contact your dealer or Hioki representative.
- Page 318 8.3 Self Checks (Self Diagnosis) Screen Display Test Check the display state of the screen and lighting state of the LEDs. Procedure This operation is possible in any of the mode, mode. LCR Initial Screen Self Checks Self Checks Press...
- Page 319 LEDs do not turn on as All LEDs turn on shown in the figure on the left, the instrument needs to be repaired. Contact your dealer or Hioki representative. All LEDs turn off Green The [OUT] LED turns on...
- Page 320 If the overall judgment result indication is [PASS], the test ended normally. Overall judgment result If the overall judgment result indication is [NG], the in- strument needs to be repaired. Contact your dealer or Hioki representative. Press to close the setting screen.
- Page 321 8.3 Self Checks (Self Diagnosis) I/O Test Check whether an output signal is output normally from the EXT I/O, and whether an input signal is read nor- mally. Procedure This operation is possible in any of the mode, mode. LCR Initial Screen Self Checks Self Checks Press...
-
Page 322: Setting The Date And Time
8.4 Setting the Date and Time 8.4 Setting the Date and Time You can set the date and time of the instrument. Data is recorded and managed based on the set date and time. Procedure This operation is possible in any of the mode, mode. -
Page 323: Chapter 9 Saving And Loading Panel Information
• The instrument contains a built-in backup lithium battery. • When the life of the built-in battery ends, the measurement conditions will no longer be able to be saved. Submit a request for replacement of the battery to the Hioki repair service. (A fee will be charged.) - Page 324 About the Save Screen Indicates the number of panels currently saved.(p. 317) Indicates the Indicates the panel name. The text color changes in accordance with the number of data panel number. When you want to items currently saved as shown in the table below. (001 to 128) change a panel name (p.
-
Page 325: Saving Measurement Conditions (Panel Save Function)
9.1 Saving Measurement Conditions (Panel Save Function) 9.1 Saving Measurement Conditions (Panel Save Function) You can save the measurement condition and compensation value. However, each of the measurement condition and compensation value is counted as one save data item when saved with (Example: When saving is performed with mode, LCR is counted as one item, and the compensation value as one item.) - Page 326 9.1 Saving Measurement Conditions (Panel Save Function) Panel Main Screen Press Select the save type. Saves both the measurement condition and com- pensation value. Saves only the measurement condition. Saves only each of the setting values and com- pensation values of open compensation, short compensation, load compensation, cable length compensation, and scaling compensation.
- Page 327 9.1 Saving Measurement Conditions (Panel Save Function) Setting the Save Conditions Procedure LCR Initial Screen Application Settings Application Settings Press Panel Main Screen to select the number of the panel to save. • Display range: No. 001 to No. 128 •...
- Page 328 9.1 Saving Measurement Conditions (Panel Save Function) When is selected You can check the information of a saved panel: Panel Information Confirmation to switch to the information of the previous or next panel. When you want to return to the panel number selection screen: Press Panel Save...
- Page 329 9.1 Saving Measurement Conditions (Panel Save Function) After you enter the save name, press to return to step , and press confirm saving. Panel Overwrite Confirmation If a panel of the same name already exists, an overwrite confirmation window appears. To enter a different save name: To overwrite the save name: Press...
-
Page 330: Loading Measurement Conditions (Panel Load Function)
9.2 Loading Measurement Conditions (Panel Load Function) 9.2 Loading Measurement Conditions (Panel Load Function) You can read saved measurement conditions with the panel load function. Procedure LCR Initial Screen Application Settings Application Settings Press Panel Main Screen to select the number of the panel to load. - Page 331 9.2 Loading Measurement Conditions (Panel Load Function) When is selected You can check the information of a saved panel: Panel Information Confirmation to switch to the information of the previous or next panel. When you want to return to the panel number selection screen: Press Panel Load Confirmation...
-
Page 332: Changing A Panel Name
9.3 Changing a Panel Name 9.3 Changing a Panel Name You can change the name of a panel saved to the instrument. Procedure LCR Initial Screen Application Settings Application Settings Press Panel Main Screen to select the number of the panel to rename. - Page 333 9.3 Changing a Panel Name Panel Main Screen Press Change Panel Name Change Panel Name Enter the save name. (Up to 12 characters) Deletes all input characters. Deletes the last character. Changes the keyboard type. Change Panel Name After you enter the new save name, press to confirm the name.
-
Page 334: Deleting A Panel
9.4 Deleting a Panel 9.4 Deleting a Panel You can delete a panel saved to the instrument. Procedure LCR Initial Screen Application Settings Application Settings Press Panel Main Screen to select the number of the panel to delete. Press... - Page 335 9.4 Deleting a Panel Panel Main Screen Press Some of the information saved to the panel is displayed. Panel Delete Confirmation Check the information saved to the panel. A panel cannot be restored once it is deleted. When you want to cancel deletion: Press Press Press...
- Page 336 9.4 Deleting a Panel...
-
Page 337: Drive
Compatible USB device USB Mass Storage Class • Hioki cannot recover data from damaged or faulty storage media resulting from abnor- malities. We are also unable to provide compensation for such data loss, regardless of the contents or cause of the failure or damage. We recommend making a backup of all important data such as a computer. -
Page 338: Inserting And Removing Usb Flash Drive
10.1 Inserting and Removing USB flash drive 10.1 Inserting and Removing USB flash drive Inserting a USB Flash Drive Front Inert the USB flash drive into the USB port on the front panel of the instrument. • Do not insert a USB flash drive that is not Mass Storage Class compatible. -
Page 339: About The File Operation Screen
10.2 About the File Operation Screen 10.2 About the File Operation Screen This screen displays a list of the files saved in the USB flash drive. It also allows you to perform file operations such as creating a folder and deleting a file. The instrument can rec- ognize file names of up to 127 single-byte characters. -
Page 340: About The File Save Setting Screen
10.3 About the File Save Setting Screen 10.3 About the File Save Setting Screen You can configure settings such as the file save format, save destination, and text save format. Check the settings before using the file save function. Procedure This operation is possible in any of the mode, mode. -
Page 341: Saving Measurement Data
10.4 Saving Measurement Data 10.4 Saving Measurement Data You can save the measurement data to a USB flash drive in CSV format. LCR mode Saves the measurement values displayed in the current screen in CSV format. ANALYZER mode Saves the measurement values of one sweep in CSV format. CONTINUOUS mode Saves the measurement result of each panel in CSV format. - Page 342 10.4 Saving Measurement Data File Type Setting Turn on the text save setting. Turns off the text save function. Saves measured values as text data. Press File Save Setting Screen Set the header of the text file. Select the header setting. Turns the save date and time ON/ OFF.
- Page 343 Select ON/ OFF for the save date and time. Does not record the save date and time. Records the save date and time. Press to close the setting screen. When ON When OFF "HIOKI E.E. CORPORATION","IM3570","Ver. 1.00" "HIOKI E.E. CORPORATION","IM3570","Ver. 1.00" "DATE","10-05-23" "FREQ","1.0000E+03","Hz" "TIME","12:35:08" "V","1.000","V" "LIMIT","OFF"...
- Page 344 Select ON/ OFF for the measurement condition setting. Does not record the measurement condition. Records the measurement condition. Press to close the setting screen. When ON When OFF "HIOKI E.E. CORPORATION","IM3570","Ver. 1.00" "HIOKI E.E. CORPORATION","IM3570","Ver. 1.00" "DATE","10-05-23" "DATE","10-05-23" "TIME","12:35:08" "TIME","12:35:27" ...
- Page 345 Select ON/ OFF for measurement parameter recording. Does not record the measurement parameter. Records the measurement parameter. Press to close the setting screen. When ON When OFF "DATE","10-05-23" "HIOKI E.E. CORPORATION","IM3570","Ver. 1.00" "TIME","12:35:08" "DATE","10-05-23" "FREQ","1.0000E+03","Hz" "TIME","12:35:35" "V","1.000","V" "LIMIT","OFF" "FREQ","1.0000E+03","Hz" ...
- Page 346 Sets the delimiter to a semicolon (;). Sets the delimiter to a space. Press to close the setting screen. When comma When tab "HIOKI E.E. CORPORATION","IM3570","Ver. 1.00" "HIOKI E.E. CORPORATION" "IM3570" "Ver. 1.00" "DATE","10-05-23" "DATE" "10-05-23" "TIME","12:35:08" "TIME" "12:35:43" "FREQ","1.0000E+03","Hz" "FREQ" "1.0000E+03" "Hz"...
- Page 347 Sets the quotation mark to a double quotation mark ("). Sets the quotation mark to a single quotation mark ('). Press to close the setting screen. When OFF When double quotation mark HIOKI E.E. CORPORATION,IM3570,Ver. 1.00 "HIOKI E.E. CORPORATION","IM3570","Ver. 1.00" DATE,10-05-23 "DATE","10-05-23" TIME,12:36:04 "TIME","12:35:08"...
- Page 348 10.4 Saving Measurement Data Press Saving measurement data Press in the measurement screen. The measurement data is saved. When is pressed, a folder is automatically created in the USB flash drive and the file is saved. • The date is used for the name of the folder cre- ated when you press •...
-
Page 349: Saving A Copy Of The Screen
10.4 Saving Measurement Data Saving a Copy of the Screen You can save the screen currently displayed to the USB flash drive in bmp file format (256-color or mono- chrome [2-color]). The file extension is bmp. Procedure Insert the USB flash drive into the USB port (front panel). LCR Initial Screen File Save Setting Screen File Save Setting Screen... - Page 350 10.4 Saving Measurement Data Saving measurement data Press in the [Measurement Screen]. A copy of the screen is saved. When is pressed, a folder is automatically created in the USB flash drive and the file is saved. • The date is used for the name of the folder cre- ated when you press •...
-
Page 351: Checking The Contents Of Files
10.4 Saving Measurement Data Checking the Contents of Files You can check files saved to a USB flash drive in text format ([TXT], [CSV]) and BMP format on the screen. Procedure Insert the USB flash drive into the USB port (front panel). LCR Initial Screen File List Screen File Selection... -
Page 352: Changing The Save Folder
10.4 Saving Measurement Data Changing the Save Folder You can set the save destination for data automatically or set the desired folder. Procedure Insert the USB flash drive into the USB port (front panel). LCR Initial Screen File Save Setting Screen File Save Setting Screen Press Save Folder Setting... - Page 353 10.4 Saving Measurement Data The following restrictions apply to the folder that can be selected with • The folder name must be all single-byte characters (a folder name containing Japanese or other double-byte characters cannot be specified). • The folder name must be no more than 12 characters. Press to close the setting screen.
-
Page 354: Loading Measurement Data
10.5 Loading Measurement Data 10.5 Loading Measurement Data This section describes how to load analyzer measurement data saved to the instrument’s USB memory and display it in graph form or use it to perform equivalent circuit analysis. Since this function only loads measured values, measurement conditions such as measurement parameters and sweep frequencies must be restored to the same conditions that were used when the loaded measurement data was acquired using panel save/load or similar functionality. - Page 355 10.5 Loading Measurement Data Folder Selection Select the folder in which the measurement data was saved with Press Measurement Data Selection Select the measurement data to load with Press Loading Measurement Data Press on the load confirmation screen. The measurement data will be loaded and applied as measured values.
- Page 356 10.5 Loading Measurement Data When a loading error is displayed Measurement Data Loading Error If an error is displayed after you press you may be experiencing one of the issues listed below. Symptom Check Item, or Cause Solution/reference Load measurement data after changing to analyzer Load Error.(1) The instrument is not in analyzer mode.
-
Page 357: Saving Instrument Settings
10.6 Saving Instrument Settings 10.6 Saving Instrument Settings Saving Instrument Settings Save various setting information of the instrument as a setting file to the USB flash drive. The extension of the setting file is “.SET.” This function is convenient for when you want to back up the setting state of the instrument. - Page 358 10.6 Saving Instrument Settings Save Instrument Settings Press in the save confirmation screen. The measurement data is saved. [SETTING] • The setting file is saved to the folder in the USB flash drive. • The date and time are automatically assigned to the file name.
-
Page 359: Saving Instrument Settings
10.6 Saving Instrument Settings Saving All Settings of Instrument (ALL SAVE Function) Save various setting information of the instrument including the panel save information as a setting file to the USB flash drive. The extension of the setting file is “.SET.” The extension of the panel save is “.PNL.” For the settings that are saved, refer to "Appendix 12 Initial Settings Table"... - Page 360 10.6 Saving Instrument Settings File List Screen Press Press in the save confirmation screen. The measurement data is saved. • The setting file and panel save data are saved to a folder of the save date and time that is created [SETTING] automatically in the folder.
- Page 361 10.7 Reading Setting Conditions 10.7 Reading Setting Conditions Loading instrument settings Read a setting file or panel save file that is saved to the USB flash drive, and restore the settings. Procedure Insert the USB flash drive into the USB port (front panel). LCR Initial Screen File List Screen Folder Selection...
- Page 362 10.7 Reading Setting Conditions Read Settings Press in the read confirmation screen. The measurement data is read, and reflected as the current settings. When you want to cancel reading: Press When the Read Confirmation Screen Appears Setting File Load Error If an error appears when is pressed, one of the following are likely to be cause.
-
Page 363: Reading Setting Conditions
10.7 Reading Setting Conditions Loading all settings saved on a USB flash drive (ALL LOAD Function) Load and restore instrument settings, including panels saved to USB memory using the all save function. "Saving All Settings of Instrument (ALL SAVE Function)" (p. 351) Procedure Insert the USB flash drive into the USB port (front panel). - Page 364 10.7 Reading Setting Conditions Folder Selection Using the buttons, select the folder to which settings were saved with the all save function. Setting File Selection Using the buttons, set [TYPE] [ALL] files. Press Read Settings Press in the read confirmation screen.
-
Page 365: File And Folder Operations
Perform this operation if the USB flash drive to be used is not formatted (initialized). Insert the USB flash drive to be formatted into the USB port (on the front panel) (p. 330) and start the format. The IM3570 formats drives using FAT32. Procedure Insert the USB flash drive into the USB port (front panel). - Page 366 10.8 File and Folder Operations Press Format USB Flash Drive A confirmation screen appears. Press When you want to cancel the format: Press Formatting No operation is possible during formatting. When formatting ends, the file list screen is redisplayed. • When you perform a format, all of the data saved to the USB flash drive is deleted and cannot be restored.
-
Page 367: Deleting Files And Folders
10.8 File and Folder Operations Deleting Files and Folders You can delete a file or folder saved to the USB flash drive. Procedure Insert the USB flash drive into the USB port (front panel). LCR Initial Screen File List Screen File List Screen to select the file or folder you want to delete. - Page 368 10.8 File and Folder Operations Creating Folders Procedure Insert the USB flash drive into the USB port (front panel). LCR Initial Screen File List Screen File List Screen Press File List Screen Press...
- Page 369 10.8 File and Folder Operations Input Folder Name Input Folder Name Enter the save name. (Up to 12 characters) Deletes all input characters. Deletes the last character. Changes the keyboard type. Input Folder Name Press to create a folder. Press to close the setting screen.
-
Page 370: Displaying The Usb Flash Drive Information
10.8 File and Folder Operations Displaying the USB Flash Drive Information You can check the usage rate and file system of the USB flash drive. Procedure Insert the USB flash drive into the USB port (front panel). LCR Initial Screen File List Screen File List Screen Press the part indicating the disc information. -
Page 371: Chapter 11 External Control
11.1 External Input/Output Connector and Signals Chapter 11 External Control The EXT I/O connector on the rear of the instrument supports external control by providing output of the end- of-measurement and comparator decision signals, and accepting input of measurement trigger and panel load signals. All signals are isolated by optocouplers (inputs and outputs share a common signal ground (ISO_COM signal ground).) Confirm input and output ratings, understand the safety precautions for connecting a control system, and use accordingly. -
Page 372: Connector Type And Signal Pinouts
11.1 External Input/Output Connector and Signals Connector Type and Signal Pinouts Connector: (Instrument Side) • 37-pin D-sub female with #4-40 screws Mating Connectors: • DC-37P-ULR (solder type) • DCSP-JB37PR (pressure weld type) Japan Aviation Electronics Industry Ltd. LCR Mode Analyzer Mode EXT I/O Connector (Instrument Side) The connector shell is conductively connected to the metal instrument chassis and the protective earth pin of the power plug. - Page 373 11.1 External Input/Output Connector and Signals LCR Mode ANALYZER Mode Logic Signal name Function Signal name Function TRIG External trigger TRIG External trigger Pos Edge (Unused) (Unused) (Unused) (Unused) Select panel number Select panel number Neg Level Select panel number Select panel number Neg Level Select panel number...
- Page 374 11.1 External Input/Output Connector and Signals LCR Mode ANALYZER Mode Logic Signal name Function Signal name Function 19 OUT OUT_OF_BINS BIN judgment results CIRCUIT_NG Equivalent circuit analysis comparator Neg Level judgment result output (output when log- ical AND of judgment results is FAIL) (Unused) (Unused) DC adjustment request (Unused)
-
Page 375: Signal Descriptions
11.1 External Input/Output Connector and Signals Signal Descriptions You can select rising or falling for the valid edge of a trigger. "Enabling Trigger Input for during Measurement and Setting the Valid Edge of Trigger Input" (p. 117), (p. 228) Input •... - Page 376 11.1 External Input/Output Connector and Signals Output LCR mode: Outputs the comparator judgment result for the measurement values of the first PARA1-HI, PARA1-LO, parameter. PARA1-IN Analyzer mode: Outputs the analyzer comparator result of the first parameter in AREA mode. LCR mode: Outputs the comparator judgment result for the measurement values of the third PARA3-HI, PARA3-LO, parameter.
-
Page 377: Timing Chart
11.2 Timing Chart 11.2 Timing Chart 11.2.1 LCR Measurement If you set the judgment condition for the comparator (the trigger setting is external trigger) and then in that state a trigger signal is input from the EXT I/O or is pressed in the screen, the judgment result is output from the signal line for comparator result output of the EXT I/O after measurement ends. - Page 378 11.2 Timing Chart Timing Chart Interval Descriptions Time Interval Description (Approximate) From Comparator, BIN Judgement Result to EOM (LOW): Setting value for delay time 2, 5 From EOM width (LOW) to TRIG (LOW): Minimum time from end of measurement to next trigger ...
- Page 379 11.2 Timing Chart • The higher the measurement frequency, the shorter the time that INDEX and EOM are high (off). When the high (off) time is too short due to characteristics of the input circuit, the instrument can be configured to maintain the low (on) state for a preset time once EOM changes to low (on) before reverting the signal to high (off) after the completion of measurement.
-
Page 380: 2Analyzer Measurement
11.2 Timing Chart 11.2.2 Analyzer Measurement In analyzer mode, if a trigger signal is input from the EXT I/O or is pressed in the screen, the judgment results are output from the signal line for comparator result output of the EXT I/O. Furthermore, if the panel number is selected with the panel load signal when a trigger signal is input from the EXT I/O, the measurement condition of that panel number is loaded and then measurement is performed. -
Page 381: (Sequential Operation)
11.2 Timing Chart 11.2.3 Continuous Measurement (Sequential Operation) With continuous measurement, if a trigger signal is input from the EXT I/O or is pressed in the screen, after measurement of all of the panel numbers set to be executed on the screen is finished, the judg- ment results are output from the signal line for comparator result output of the EXT I/O. - Page 382 11.2 Timing Chart • ERR transitions to LOW each time measurement completes if a measurement error occurs. • In the continuous measurement screen, comparator result output signals other than AND and panel load signals (LD-VALID, LD0 to LD6) cannot be used. See: "Chapter 6 Continuous Measurement Function"...
-
Page 383: (Step Operation)
11.2 Timing Chart 11.2.4 Continuous Measurement (Step Operation) In continuous measurement mode, pressing on the screen asking whether a trigger signal will be input from EXT I/O will cause the judgment result to be output from the EXT I/O comparator result output sig- nal lines after measurement of the panel set to be executed on the screen completes. - Page 384 11.3 Internal Circuitry 11.3 Internal Circuitry Input Circuit PLC, etc. Internally Isolated 5 V Output Common Internally Isolated Common Signal Ground Do not apply external power Output Circuit PLC, etc. Internally Isolated 5 V ISO_5V Input Zener Voltage BIN1, PARA1-HI, PARA1_LMAX_MEASNG BIN3, PARA1-LO, PARA1_LMAX_CONDNG BIN5, PARA2-IN, PARA2_LMAX_IN...
-
Page 385: Electrical Specifications
11.3 Internal Circuitry Electrical Specifications Input Signals Input type Optocoupler-isolated, non-voltage contact inputs (source input, active-low) Input asserted (ON) voltage 1 V or less Input de-asserted (OFF) Open or 5 to 30 V voltage Input asserted (ON) current 3 mA/ch Maximum applied voltage 30 V Output Signals... -
Page 386: Internal Circuitry
11.3 Internal Circuitry Connection Examples Input Circuit Connection Examples Input Input Switch Connections Relay Connections Common Input Output Input Output Common PLC Output (Source Output) Connections PLC Output (Sink Output) Connections Output Circuit Connection Output Examples Output LED Connection Relay Connections Output Output Active-Low... -
Page 387: External I/O Settings
11.4 External I/O Settings 11.4 External I/O Settings There are the following setting items for the output timing of the judgment result output signal and the logic of the trigger signal. Setting Delay Time from Output of Comparator and BIN Judgment Results until Output of EOM (LOW) The delay time for the period from the output of the comparator and BIN judgment results until the output of EOM (LOW) from the EXT I/O can be set on the instrument or by a communication command. -
Page 388: External Control Q&A
11.5 External Control Q&A 11.5 External Control Q&A Common Questions Answers Connect the (active low) TRIG input pin to an ISO_COM pin using a switch How do I connect external trigger input? or open-collector output. Which pins are common ground for The ISO_COM pins. -
Page 389: Chapter 12 Printing
If the recording paper is skewed on the roller, paper jams may result. Recommended printer The IM3570 has been verified to operate properly with Sanei Electric Inc.'s model SD1-31S thermal printer. The requirements for a printer to be connected to the instrument are as follows. -
Page 390: Connecting The Printer To The Instrument
Turn the instrument and printer on. RS-232C Cable Connector Pinouts 1 2 3 4 5 13 ....... 1 25 ....... 14 6 7 8 9 Printer (25-pin) Connector IM3570 (9-pin) Connector Signal Signal Function Function Name Name Receive Data Transmit Data... -
Page 391: Instrument And Printer Settings
12.2 Instrument and Printer Settings 12.2 Instrument and Printer Settings Make Instrument Settings Procedure This operation is possible in any of the mode, mode. LCR Initial Screen Interface Setting Printer Setting Press and select the printing method. BAUD RATE Communication speed with the printer HANDSHAKE Configuring flow control... -
Page 392: Printing
12.3 Printing 12.3 Printing Before Printing Verify that the instrument and printer settings (p. 383) are correct. When the Printing Method is Set to Prints automatically after measurement completes. When the Printing Method is Set to Prints the state when is pressed in the initial screen. - Page 393 12.3 Printing Example Printouts The print content varies depending on the printer settings of the instrument. "12.2 Instrument and Printer Settings" (p. 383) When LCR Mode When the [TYPE] setting is BIN measurement Normal measurement Comparator measurement When the [TYPE] setting is When the display is enlarged, the print type is text even when [TYPE]...
- Page 394 12.3 Printing When Continuous Measurement Mode The measured value display will be printed in text, or the graph display will be printed as a screen image. Measured value display Graph display Since printer settings cannot be configured in continuous measurement mode, set the instru- ment to either LCR mode or analyzer mode in order to changing the printer settings.
-
Page 395: Chapter 13 Specifications
13.1 General Specifications Chapter 13 Specifications 13.1 General Specifications 1.Basic Specifications Measurement mode (1) LCR mode: Measurement with single condition (2) Analyzer mode: Measurement frequency sweep, measurement level sweep • Measurement points: 2 to 801 • Sweep method: Normal sweep/segment sweep Normal sweep: START-STOP/ CENTER-SPAN/ START-STEP, maximum 801 points Segment sweep: START-STOP, maximum 20 segments (total of 801 points) •... - Page 396 13.1 General Specifications 1.Basic Specifications Measurement signal level (1) Open circuit terminal voltage (V) mode and constant voltage (CV) mode • Level range Normal mode: 5 mV to 5 V, maximum 50 mA (up to 1.0000 MHz) 10 mV to 1 V, maximum 10 mA (from 1.0001 MHz) Low Z high accuracy mode: 5 mV to 1 V, maximum 100 mA (up to 100.00 kHz) •...
- Page 397 13.1 General Specifications 1.Basic Specifications Low Z High Accuracy Mode Improves measurement accuracy in the 100 m and 1 ranges of 100 kHz or less. • The influence of contact resistance is reduced by changing to a circuit configuration that sets the Lp terminal to 0 V.
- Page 398 13.1 General Specifications 2.Function Superimposing a DC voltage and then performing measurement is possible. DC bias measurement DC voltage Normal mode: 0 V to 2.50 V (10 mV resolution) Low impedance high accuracy mode: 0 V to 1.00 V (10 mV resolution) ×...
- Page 399 13.1 General Specifications 2.Function Panel save and load LCR mode (single frequency): 30 different measurement conditions can be saved. function Sweep measurement: 2 different measurement conditions can be saved. Compensation value only: 128 different measurement conditions can be saved. Any measurement condition can be load by key operation or a control signal via the EXT I/O. Memory function 32,000 measurement result items can be saved to the instrument.
- Page 400 13.1 General Specifications 4.Environmental and Safety Specifications ° ° Operating temperature and 0 to 40 C (32 to 104 F),80% RH or less (non-condensating) humidity ° ° Storage temperature and -10 to 50 C (15 to 122 F) 80% RH or less (non-condensating) humidity Operating environment Indoors, Pollution degree 2, altitude up to 2000 m (6562-ft.)
- Page 401 13.1 General Specifications Options L2000 L2001 4-terminal Probe Pincher Probe Alligator-clip-type measure- ment probes. These general-purpose dual- electrode clips fit a wide range of conductor thicknesses. Measurable range: DC to 8 MHz Maximum applied voltage: ±42 Vpeak(AC+DC) Measurable range: DC to 8 MHz Maximum applied current: ±1 Apeak(AC+DC) Maximum voltage: ±42 Vpeak (AC+DC) Electrode tip spacing: 0.3 to approx.
- Page 402 40 V Maximum applied current: DC2 A IM9000 Equivalent Circuit Analysis Firmware This option enables equiva- lent circuit analysis and oth- er IM3570 functionality. • Equivalent circuit analysis (automatic, fixed): 5 patterns • PASS/FAIL judgments for equivalent circuit elements •...
-
Page 403: Measurement Range And Accuracy
13.2 Measurement Range and Accuracy 13.2 Measurement Range and Accuracy The measurement accuracy is calculated from a basic accuracy, which is based on the accuracy for ° impedance Z (% rdg.) and phase angle ), and the following coefficients. Measurement accuracy = Basic accuracy ×... - Page 404 13.2 Measurement Range and Accuracy Accuracy table ° Upper portion: Impedance Z (Unit: %) Lower portion: Phase angle (Unit: 4.00 Hz to 100.00 Hz to 1.0000 kHz to 10.001 kHz to 100.01 kHz to 1.0001 MHz to Range 99.99 Hz 999.99 Hz 10.000 kHz 100.00 kHz...
- Page 405 13.2 Measurement Range and Accuracy Cable length coefficient The coefficient corresponding to the setting for measurement cable length is obtained from the measurement cable length table and then multiplied by the basic accuracy. Cable length coefficient fm: Measurement frequency [kHz] Guaranteed Accuracy Range: 0 m and 1 m = 4 Hz to 5 MHz, 2 m = 4 Hz to 100 kHz, 4 m = 4 Hz to 10 kHz DC bias coefficient The coefficient corresponding to the setting for ON/ OFF of DC bias is obtained from the DC bias coefficient...
- Page 406 13.2 Measurement Range and Accuracy Guaranteed Accuracy Range The guaranteed accuracy range differs depending on the measurement frequency, measurement signal level, and measurement range. 4.00 Hz to 100.00 Hz to 1.0000 kHz to 10.001 kHz to 100.01 kHz to 1.0001 MHz to Range 99.99 Hz 999.99 Hz...
-
Page 407: About Measurement Times And Measurement Speed
13.3 About Measurement Times and Measurement Speed 13.3 About Measurement Times and Measurement Speed Measurement times differ depending on the measurement conditions. Refer to the following values. All of the values are reference values. Note that they may differ depending on the conditions of use. Analog measurement signal (INDEX) FAST SLOW... - Page 408 13.3 About Measurement Times and Measurement Speed Measurement times (EOM) Measurement times= INDEX + A + B + C + D + E + F Calculation time (no OPEN /SHORT/ LOAD compensation, HOLD range, normal measurement) FAST SLOW SLOW2 All frequencies 0.5 ms Tolerance: ±10% ±0.1 ms LOAD compensation...
- Page 409 13.3 About Measurement Times and Measurement Speed Wait time • When the frequency is changed: The wait time differs depending on the frequency changed. Wait time = Frequency before change Frequency after change Furthermore, if the range of the measurement frequencies is divided into the following seven categories and the frequency is changed to one in a different range, a wait time of 1 ms is added.
- Page 410 13.3 About Measurement Times and Measurement Speed...
-
Page 411: Chapter 14 Maintenance And Service
Hioki representative. However, in the following cases, immediately stop using the instrument, unplug the power cord and contact your dealer or Hioki representative. • When the nature of the damage is clearly evident • When measurement is impossible •... - Page 412 14.1 Inspection, Repair and Cleaning Transporting the instrument • Pack the instrument so that it will not sustain damage during shipping, and include a description of existing damage. We do not take any responsibility for damage incurred during shipping. • Use the original packing materials when transporting the instrument, if possible.
-
Page 413: Troubleshooting
14.2 Troubleshooting 14.2 Troubleshooting Before returning for repair In the event of the instrument malfunctioning, check the following items. Symptom Check Item, or Cause Remedy and Reference Confirm that the power cord is properly con- The display does not Is the power cord unplugged? nected. - Page 414 • When you have forgotten the passcode for the key lock. If the instrument still does not operate normally after the full reset, it needs to be repaired. Contact your dealer, or a Hioki representative if you are not sure where the instrument was purchased. Opening Screen Connect the power cable.
-
Page 415: Error Display
The instrument needs to be repaired. The life of the RAM backup battery has Contact your dealer or Hioki representa- ended. tive. Increase the measurement signal level This is displayed when a measurement... - Page 416 (p. 49) This is displayed when measurement The instrument needs to be repaired. does not end because of an internal cir- Contact your dealer or Hioki representa- cuit error. tive. This is displayed when a measurement...
-
Page 417: Discarding The Instrument
14.4 Discarding the Instrument 14.4 Discarding the Instrument When disposing of this instrument, remove the lithium battery and dispose of battery and instrument in accordance with local regulations. • To avoid electric shock, turn off the power switch and disconnect the power cord and measurement cables before removing the lithium battery. - Page 418 14.4 Discarding the Instrument...
-
Page 419: Appendix
Appendix 1 Measurement Parameters and Arithmetic Expressions Appendix Appendix 1 Measurement Parameters and Arithmetic Expressions In general, impedance is used to evaluate the characteristics of, for example, circuit components. Measure voltage and current vectors for circuit components relative to AC measurement frequency sig- ... - Page 420 Appendix 1 Measurement Parameters and Arithmetic Expressions From the voltage which is applied between the terminals of the sample under test, the current I which flows through the test sample at this time, the phase angle between this voltage and this current I, ...
-
Page 421: Appendix 2 Measurement Of High Impedance
Appendix 2 Measurement of High Impedance Components Appendix 2 Measurement of High Impedance Components The measured value obtained when testing a high impedance element (such as, for example, a resistor with resistance higher than 100 k ) is sometimes unreliable, because such an element is vulnerable to the effects of external interference and the like. -
Page 422: Appendix 3 Measurement Of In-Circuit Components
Appendix 3 Measurement of In-circuit Components Appendix 3 Measurement of In-circuit Components Measure an in-circuit component after providing guarding. --------------------------------- - Referring to the following figure, when measuring a resistance value for the resistor , even if the tips of the two probes are contacted against the ends of the resistor , considering the sum of the cur- rent flowing through the resistor... -
Page 423: Appendix 4 Countermeasures Against
Appendix 4 Countermeasures Against Incorporation of External Noise Appendix 4 Countermeasures Against Incorpo- ration of External Noise The unit is designed to be resistant to errors caused by interference from the test cables or the power supply line. However, if the level of the interference is particularly large, this can cause measurement errors or faulty operation. - Page 424 Appendix 4 Countermeasures Against Incorporation of External Noise Attaching an EMI Suppression Ferrite Core to the Power Cord Pass the power cord through a commercially available EMI suppression ferrite core and secure the core as close as possible to the AC power inlet of the unit in order to suppress the incorporation of noise from the power line.
-
Page 425: Appendix 5 Supplying Dc Bias
DC Bias Voltage Circuit R or L (>>Z) Capacitor DC voltage source IM3570 Sample to be tested GUARD • Use a resistance (R) or inductance (L) which has a large enough impedance with reference to the sample under test (Z). - Page 426 Appendix 5 Supplying DC Bias • In order to avoid electric shock accident, be absolutely sure not to touch the test termi- nals while the DC bias voltage is being supplied to them. • If you disconnect the sample under test from the test terminals with the DC bias voltage still being supplied, then the test sample is left charged, which is very dangerous.
- Page 427 Choke coil Capacitor DC current source IM3570 Sample to be tested • Connect the sample to the measuring probe and then gradually raise the voltage of the DC source to the specified DC bias level. To disconnect the sample, gradually reduce the voltage of the DC source until the DC bias supplied to the sample is decreased to zero.
-
Page 428: Appendix 6 The Residual Charge Protection Function
Appendix 6 The Residual Charge Protection Function Appendix 6 The Residual Charge Protection Function The unit has been enhanced by the incorporation of a residual charge protection function. If by mistake a charged capacitor is connected to the measurement terminals, this function protects the internal circuitry of the unit from discharge of such residual charge. -
Page 429: Appendix 7 Series Equivalent Circuit Mode And Parallel Equivalent Circuit Mode
Appendix 7 Series Equivalent Circuit Mode and Parallel Equivalent Circuit Mode Appendix 7 Series Equivalent Circuit Mode and Parallel Equivalent Circuit Mode The instrument measures the current flowing to the test sample and the voltage at both ends of the test sam- ple, and determines Z and . -
Page 430: Appendix 8 Selecting The Equivalent Circuit Model
Appendix 8 Selecting the Equivalent Circuit Model Appendix 8 Selecting the Equivalent Circuit Model When using the equivalent circuit function, it is important to select an appropriate equivalent circuit model. The following table provides examples of measurement targets and equivalent circuit models: Corresponding equivalent Measurement target circuit model... -
Page 431: Appendix 9 Open Circuit Compensation And Short Circuit Compensation
Appendix 9 Open Circuit Compensation and Short Circuit Compensation Appendix 9 Open Circuit Compensation and Short Circuit Compensation The residual impedance component of the test fixture can be considered in terms of an equivalent circuit as shown in the figure. Further, because the measured value for impedance includes this residual compo- nent, therefore, in order to obtain the genuine impedance value, it is necessary to compensate the measured value in terms of the open circuit impedance residual component and the short circuit residual component,... -
Page 432: Appendix 10Rack Mounting
Appendix 10 Rack Mounting Appendix 10 Rack Mounting Rack mounting brackets can be attached to the instrument. Observe the following precautions regarding the mounting screws to avoid instru- ment damage and electric shock accidents. • When installing the Rack Mounting Plate, the screws must not intrude more than 6 mm into either side of the instrument. - Page 433 Appendix 10 Rack Mounting Installation Procedure Protrusions M3 x 6 mm Remove the feed from the bottom of the instrument, and the screws from the sides (four near the front). M4 x 6 mm Rack Mounting Plate (JIS) Installing the spacers on both sides M4 x 12 mm of the instrument, affix the Rack Mounting Plate with the M4 x 12 mm...
-
Page 434: Appendix 11Dimensional Diagram
Appendix 11 Dimensional Diagram Appendix 11 Dimensional Diagram ± ± × 6 (Height of protruding portion) (Unit: mm) 67.95... -
Page 435: Appendix 12Initial Settings Table
Appendix 12 Initial Settings Table Appendix 12 Initial Settings Table The following table shows the initial settings of the instrument. Yes: Available/ : The same as the left/ No: Unavailable *1: When TYPE=ALL is set, the items indicated by Yes (ADJ) are also saved. Return to Panel Save/ Unit... - Page 436 Appendix 12 Initial Settings Table Yes: Available/ : The same as the left/ No: Unavailable *1: When TYPE=ALL is set, the items indicated by Yes (ADJ) are also saved. Panel Save/ Return to Unit initial Load* Reset File settings Setting Items Initial setting :PRESet...
- Page 437 Appendix 12 Initial Settings Table Yes: Available/ : The same as the left/ No: Unavailable *1: When TYPE=ALL is set, the items indicated by Yes (ADJ) are also saved. Panel Save/ Return to Unit initial Load* Reset File settings Setting Items Initial setting :PRESet...
- Page 438 Appendix 12 Initial Settings Table Yes: Available/ : The same as the left/ No: Unavailable *1: When TYPE=ALL is set, the items indicated by Yes (ADJ) are also saved. Panel Save/ Return to Unit initial Load* Reset File settings Setting Items Initial setting :PRESet...
- Page 439 Appendix 12 Initial Settings Table Yes: Available/ : The same as the left/ No: Unavailable *1: When TYPE=ALL is set, the items indicated by Yes (ADJ) are also saved. Panel Save/ Return to Unit initial Load* Reset File settings Setting Items Initial setting :PRESet...
- Page 440 Appendix 12 Initial Settings Table Yes: Available/ : The same as the left/ No: Unavailable *1: When TYPE=ALL is set, the items indicated by Yes (ADJ) are also saved. Panel Save/ Return to Unit initial Load* Reset File settings Setting Items Initial setting :PRESet...
-
Page 441: Appendix 13Device Compliance Statement
Appendix 13 Device Compliance Statement Appendix 13 Device Compliance Statement "Information on compliance to standards" based on the IEEE 488.2 standard Item Description Communication Instruction Manual (CD) 1. IEEE 488.1 interface functions 2. Operation with a device address other than 0 Such a setting is not possible. - Page 442 Appendix 13 Device Compliance Statement Item Description :GRAPh:VERTical:CENTerdiv? ..... 2 :GRAPh:VERTical:UPPerlower? .... 2 :LIST:CENTerspan? ...... 3 :LIST:INTerval? ......3 :LIST:STARt:STEP? ...... 3 :LIST:STARt:STOP? ...... 4 :MEASure:COMParator:PEAK:MAX? ..* :MEASure:COMParator:PEAK:MIN? ..* :SEGMent:STARt:STOP? ....4 :MEASure:CONTinuous:PEAK? ....* * The number of response messages varies depending on the settings.
- Page 443 Appendix 13 Device Compliance Statement Item Description or queries related to identification, explanation Included CD IDN? of the response to the " " query 17. Capacity of the user data storage area reserved PUD PUD? The " " command and the " "...
- Page 444 Appendix 13 Device Compliance Statement...
- Page 445 Index Index EMI Suppression ..........6 Enlarging Display ..........126 Accuracy ............395 Equivalent Circuit Analysis ....... 238 All Compensation ........274, 282 Error display ............. 407 ANALYZER measurement ......A131 EXT I/O Connection Examples ........378 Area Judgment ..........197 EXT I/O Connector ...........
- Page 446 Index Key-lock Function ........121, 230 Rack Mounting ........... 14 Range ........... 49, 69, 160 rdg................ 3 Replaceable Parts ..........A403 ........ 15, 19, 20, 127, 233, 272 Residual Charge Protection ......A10 ..............37 ROM/RAM Test ..........312 Limit value ............
- Page 447 Index Vertical Axis Scale ..........183 Voltage limit ..........60, 78...
- Page 448 Index...
- Page 449 Index Refer- Refer- Description Description ence ence Cursor A display setting and To restore the colors of all seg- movement ments to the initial state Compensation coefficient A setting Average setting 165, Planar oscillation mode coeffi- 169, cient setting Cursor A and cursor B display Susceptance (S) settings and movement Cursor B movement...
- Page 450 Index Refer- Refer- Description Description ence ence Clear all measurement values 106, LCD settings saved to instrument memory Draw color setting Screen display test Saves screen copies as 256- color BMP files. Vertical axis width setting Area judgment setting Detail display of peak judg- ment result Enable falling edge Configuring the equivalent cir-...
- Page 451 Index Refer- Refer- Description Description ence ence Longitudinal oscillation electro- Waveform graph display mechanical coupling coefficient Planar oscillation electrome- Grid display setting chanical coupling coefficient Thickness-mode oscillation Save only measurement condi- electromechanical coupling co- tions with panel save function efficient 320, Upper limit value setting Switch keyboard type...
- Page 452 Index Refer- Refer- Description Description ence ence Inductance in series equiva- Overwrite save name lent circuit mode (H) Setting the equivalent circuit Overwrite setting analysis method Manual scaling setting Set both parameters 1 and 2 Set upper and lower limit val- Confirm save name ues manually in draw mode Specify any folder and then...
- Page 453 Index Refer- Refer- Description Description ence ence Segment settings Reference value settings Segment span mode setting Setting the segment for which Change save name to perform equivalent circuit analysis Repeat sweep setting Check contents of file 129, System Reset Sequential sweep setting Right limit value setting Measurement condition setting 14 Selecting the equivalent circuit...
- Page 454 Index Refer- Refer- Description Description ence ence Impedance ( Sweep end value setting Disable enlarged view of mea- Sweep point setting surement values Trigger synchronous output 104, Enlarge measurement values function setting System settings Set cable length to 0 m Set delimiter to tab Set cable length to 1 m Move cursor to measurement...
Need help?
Do you have a question about the IM3570 and is the answer not in the manual?
Questions and answers