Hioki IM7580 Instruction Manual
Hide thumbs
Also See for IM7580:
- Communication instruction manual (66 pages) ,
- Communication instruction manual (74 pages) ,
- Instruction manual (76 pages)

Related Manuals for Hioki IM7580


Summary of Contents for Hioki IM7580
- Page 3 Contents Contents Introduction ..........1 Setting Basic Settings of Verifying Package Contents ..... 1 Measurement ........69 Options (Sold separately) ......2 4.2.1 Setting the Measurement Parameters ..69 4.2.2 Starting Measurement at Any Arbitrary Safety Information ........3 Timing (Trigger) ...........70 Operating Precautions ......
- Page 4 Contents Common Functions (LCR Mode, 4.9.3 Performing Equivalent Circuit Analysis ..132 4.9.4 Simulating Frequency Characteristics ..135 ANALYZER Mode) ......180 4.9.5 Settings to Judge Analysis Results ..... 137 7.3.1 Saving Measurement Results (Memory Function) ........... 180 Calibration and 7.3.2 Setting the Screen Display ......
- Page 5 Contents 12.2.1 Impedance Measurement ......283 Setting the SYSTEM 12.2.2 Example: Calculation of Accuracy ....284 12.2.3 DCR Measurement ........288 10.1 Setting the Interface ..... 231 12.2.4 Conversion Table ........289 10.2 Checking the Instrument 12.3 Measurement Time ....... 290 Version ..........
- Page 6 Contents...
- Page 7 Refer to “Appx. 6 Rack Mounting” (p. A7) for rack mounting. Install the instrument (p. 6) Connect test head (p. 17) Connect power cord (p. 20) Connect measurement cables, optional Hioki probes or test fixture (p. 21) Connect external interfaces (as required) (p. 231) Inspect all the connections (p. 19) Turn ON the power supply (p. 24) Perform calibration/compensation (p.
- Page 9 Introduction Introduction Thank you for purchasing the HIOKI IM7580 Impedance Analyzer. To obtain maximum performance from the instrument, please read this manual first, and keep it handy for future reference. Verifying Package Contents • When you receive the instrument, inspect it carefully to ensure that no damage occurred during shipping. In particular, check the accessories, panel switches, and connectors. If damage is evident, or if it fails to operate according to the specifications, contact your authorized Hioki distributor or reseller.
- Page 10 Options (Sold separately) Options (Sold separately) Contact your authorized Hioki distributor or reseller when ordering. Test fixtures IM9200 Test Fixture Stand IM9201 SMD Test Fixture (for SMD parts) IM9906 Adapter (3.5 mm/7 mm) Interfaces Z3000 GP-IB Interface Z3001 RS-232C Interface Connection Cables 9151-02...
- Page 11 Safety Information Safety Information This instrument is designed to conform to IEC 61010 Safety Standards, and has been thoroughly tested for safety prior to shipment. However, using the instrument in a way not described in this manual may negate the provided safety features. Before using the instrument, be certain to carefully read the following safety notes.
- Page 12 Safety Information Symbols on the instrument Indicates cautions and hazards. When the symbol is printed on the instrument, refer to a corresponding topic in the Instruction Manual. Indicates AC (Alternating Current). Indicates the ON side of the power switch. Indicates the OFF side of the power switch. Symbols for standards WEEE marking: This symbol indicates that the electrical and electronic appliance is put on the EU market after August 13, 2005, and producers of the Member States are required to display it on the appliances under Article 11.2 of Directive 2002/96/EC (WEEE).
- Page 13 Safety Information Measurement categories To ensure safe operation of measurement instruments, IEC 61010 establishes safety standards for various electrical environments, categorized as CAT II to CAT IV, and called measurement categories. DANGER • Using a measuring instrument in an environment designated with a higher- numbered category than that for which the instrument is rated could result in a severe accident, and must be carefully avoided.
- Page 14 Operating Precautions Operating Precautions Follow these precautions to ensure safe operation and to obtain the full benefits of the various functions. Preliminary checks Before using the instrument for the first time, verify that it operates normally to ensure that no damage occurred during storage or shipping. If you find any damage, contact your authorized Hioki distributor or reseller. WARNING Before using the instrument, check that the coating of the probes or cables are neither ripped nor torn and that no metal parts are exposed. Using the instrument under such conditions could result in electrocution.
- Page 15 Operating Precautions Warranty Hioki disclaims responsibility for any direct or indirect damages that may occur if this instrument has been combined with other devices by a systems integrator prior to sale or during resale. Note. Handling the instrument DANGER • To avoid electric shock, do not remove the instrument’s case. The internal components of the instrument carry high voltages and may become very hot during operation.
- Page 16 Operating Precautions Handling of cords and fixtures WARNING Use only the designated power cord with this instrument. Use of other power cords may cause fire. CAUTION • To avoid damaging the power cord, grasp the plug, not the cord, when unplugging it from the power outlet. •...
- Page 17 Operating Precautions USB flash drives CAUTION • Hioki cannot recover or analyze data from damaged or faulty storage media. We cannot compensate for such data loss, irrespective of the contents or cause for the failure or damage. We recommend you to make a backup of all important data in a computer or other devices. • Avoid inserting the USB flash drive with the wrong orientation. This can damage the USB flash drive or instrument. • When a USB flash drive is being accessed, the color of the USB icon changes from blue to red. Do not turn off the power of the instrument while the USB flash drive is being accessed. Also, do not remove the USB flash drive from the instrument while it is being accessed. This may result in loss of data stored in the USB flash drive. • Do not transport the instrument while a USB flash drive is connected. Damage could result. • Some USB flash drives are susceptible to static electricity. Exercise care when using such products because static electricity could damage the USB flash drive or cause malfunction of the instrument.
- Page 18 Operating Precautions...
- Page 19 The HIOKI IM7580 Impedance Analyzer is an impedance measuring instrument that has achieved high speed and high accuracy. The IM7580 combines the functionality of two devices: an impedance analyzer that can perform frequency and sweep measurement of measurement signal, and an LCR meter that can simultaneously display up to four parameters under a single set of measurement conditions.
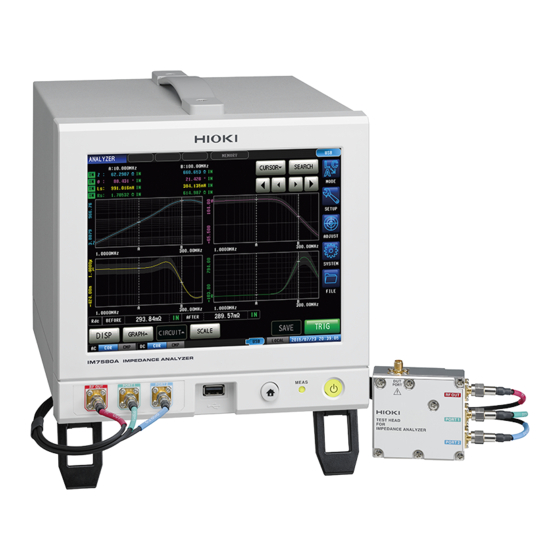
- Page 20 Names and Functions of Parts 1.2 Names and Functions of Parts Front panel of the instrument LCD display This is a touch panel display. Press the keys displayed on the screen to operate the instrument. HOME button • Returns to the measurement screen. •...
- Page 21 Names and Functions of Parts Rear of the instrument Communication interface (option) (p. 231) Optional interfaces can be installed. Refer to the Communication Instruction Manual (LCR Vents (p. 6) Application Disk). Install such that the • Model Z3000 GP-IB Interface vents are not covered. •...
- Page 22 Names and Functions of Parts Side of the test head Measuring terminals 2×M3 Effective depth 6 RF OUT PORT1 PORT2 Bottom of the test head 61 ±1 11.8 57.9 ±1 40 ±0.2 2×M4 Effective depth 5 Threaded holes for fixing the IM9200 Test Fixture Stand These holes can also be used when fixing a test head to an automated machine.
- Page 23 Screen Operations 1.3 Screen Operations This instrument allows you to use a touch panel to set and change all measurement conditions. Gently touch a key on the screen to select the item or numerical value set for that key. In this manual, gently touching the screen is referred to as “press”. CAUTION Do not use excessive force on the touch panel, and do not use sharp objects that could damage the touch screen.
- Page 24 Screen Operations Example: Moving the window You can move the window by pressing the top of the window (green part) and dragging.
- Page 25 Connecting the Test Head Measurement Preparations Please read “Operating Precautions” (p. 6) before installing and connecting this instrument. See “Rack Mounting” (p. A7) for rack mounting. 2.1 Connecting the Test Head Connect the test head. See “5 Calibration and Compensation” (p. 139). CAUTION •...
- Page 26 Connecting the Test Head Check that the power switch of the instrument is turned off. Connect RF OUT, PORT1, and PORT2 of the instrument to RF OUT, PORT1, and PORT2 of the test head with the supplied connection cable. 0.56 N.m (recommended value) If the specified torque is applied to the torque wrench, it will rotate to the position...
- Page 27 Do not use the instrument if damage is found, as it can exposed? result in electric shocks or short-circuit accidents. Contact your authorized Hioki distributor or reseller. Is the insulation on the measurement cable torn, or is If there is any damage, measured values may be unstable any metal exposed? and measurement errors may occur.
- Page 28 Connecting the Power Cord 2.3 Connecting the Power Cord Please read “Before turning ON the power” (p. 7), “Handling of cords and fixtures” (p. 8) before connecting the power cord. Connect the power cord to the power inlet on the instrument, and plug into an outlet. Turn OFF the main power switch before disconnecting the power cord. Check that the main power switch of the instrument is turned off.
- Page 29 Connecting a Measurement Cable/Fixture 2.4 Connecting a Measurement Cable/Fixture Please read “Before turning ON the power” (p. 7), “Handling of cords and fixtures” (p. 8) before connecting the measurement cable/fixture. Connect the measurement cables, or optional Hioki test fixture to the measurement terminals. See “Options (Sold separately)” (p. 2) for options. See the instructions provided with the fixture for operating details. Note the following when extending the distance between test sample and measuring terminals. Ω • Use 50 coaxial cable for the measurement cable.
- Page 30 Use the screws (M3×6 mm) which are mounted during shipment for installing the interface to avoid instrument damage and electric shock accidents. If screws have been lost or damaged, contact the store (distributor) from which you purchased the instrument or your nearest Hioki sales office. CAUTION To disconnect, hold the plate of optional interface. If you touch the board directly, it may be damaged due to static electricity.
- Page 31 Connecting an Interface You will need: A Phillips head screwdriver (No. 2) Installing the interface Attaching the blank panel Unplug the power cord of the instrument Unplug the power cord of the instrument from the wall outlet. from the wall outlet. Disconnect the connection cords. Disconnect the connection cords. Rear Rear (M3 ×...
- Page 32 Turning the Power ON and OFF 2.6 Turning the Power ON and OFF Connect the probe and test fixture before turning the main power on. Rear Front Power switch Start button (main power) Turning the main power ON Turning to the inactive state Turn the main power switch ON ( | ). Press the start button on the front for approximately 1 second in the main power ON state.
- Page 33 Select the Measurement Mode 2.7 Select the Measurement Mode Select any one of the following 3 measurement modes. Press [MODE]. Select the measurement mode. Press [EXIT]. [LCR]: LCR function The LCR function allows you to measure the passive elements of capacitors and coils with a single measurement condition.
- Page 34 Select the Measurement Mode [CONTINUOUS]: Continuous measurement function The continuous measurement function allows you to perform a series of measurements with different conditions. For example, Consecutive Ls measurement with 1 MHz of and Z measurement with 100 MHz and its pass/fail judgment can be made. LCR mode and ANALYZER mode measurement conditions can be combined. Up to 46 measurements (30 for LCR mode, 16 for ANALYZER mode) can be performed continuously.
- Page 35 LCR Function LCR Function 3.1 LCR Function The LCR function allows you to measure the impedance, phase angle, and other items by applying any frequency or level (RMS value) signal to the element you want to measure. This function is suitable for evaluating the passive elements such as capacitors and coils.
- Page 36 LCR Function Screen Map Measurement mode Advanced settings screen (p. 33) setting screen (p. 25) Compensa- tion settings screen (p. 139) [CAL] Calibration p. 143 [Rdc LIMIT] DC measurement limit value p. 150 Electric length [LENGTH] p. 152 compensation [COMPEN] Compensation p.
- Page 37 LCR Function [FREQ] Measurement frequency p. 37 [LEVEL] Measurement signal level p. 38 [SPEED] Measurement speed p. 40 [AVG] Average p. 41 Advanced settings [DELAY] Trigger delay p. 34 screen [SYNC] Trigger synchronous output p. 35 (p. 37) [TRIG] Trigger p.
- Page 38 LCR Function Measurement Switches information to be displayed on the measurement screen. Sets the measurement Displays information [SET] regarding LCR measurement parameter. (p. 32) Displays the measured value. Displays information on [COMP] comparator measurement Sets the upper and lower judgment standards. limit values.
- Page 39 LCR Function Status and error display of this instrument Displays the current measurement mode. Displays the state of calibration/ compensation. LCR function AC measurement Analyzer function Calibration disabled Continuous measurement Calibration function Calibration enabled Compensation disabled Displays error messages. Compen- sation Compensation Outside guaranteed accuracy...
- Page 40 Setting Basic Settings of Measurement Conditions 3.2 Setting Basic Settings of Measurement Conditions 3.2.1 Setting Display Parameters You can select up to 4 types from the 14 types of measurement parameters to display at any arbitrary location. The phase angle θ is shown in reference to impedance Z. When performing measurements using admittance Y as the reference, the sign of the phase angle θ of impedance Z will be reversed. Refer to “Appx. 1 Measurement Parameters and Calculation Formula” (p. A1). Refer to “Appx. 3 Series Equivalent Circuit Mode and Parallel Equivalent Circuit Mode” (p. A4). Parameters Contents Parameters...
- Page 41 Setting Basic Settings of Measurement Conditions 3.2.2 Starting Measurement at Any Arbitrary Timing (Trigger) Starts measurement at an arbitrary timing. Trigger is the function that controls the measurement start timing with specific signals. The following are the two types of trigger that can be set for the instrument. Automatically repeats measurement. (Trigger signals are Internal trigger automatically generated internally.) Measurements are triggered by an external signal. External trigger Trigger is controlled by an EXT I/O, interface, or manually ([TRIG]).
- Page 42 Setting Basic Settings of Measurement Conditions 3.2.3 Setting the Delay Time from Trigger to Measurement Start (Trigger Delay) The delay time period from input of the trigger signal to measurement (delay time) can be set. With this function, it is possible to ensure that measurement is started after the connection condition of the object to be tested and the test probe (fixture) has stabilized. Refer to “8.1 External Input/Output Connector and Signals” (p. 195). Trigger delay: OFF Trigger delay: ON ―...
- Page 43 Setting Basic Settings of Measurement Conditions 3.2.4 Applying the Signal to the Sample During Measurement Only (Trigger Synchronous Output) This function outputs measurement signal after the trigger input and applies the signal only to the sample during measurement. You can also set a delay time to ensure that data is acquired after the sample stabilizes. Thus reducing the generation of heat in the sample and decreasing electrode wear. Output of INDEX signals for switching to the next sample can be delayed till after the measurement signal is completely OFF (0 V) after measurement has been completed. (INDEX delay) Trigger synchronous output: OFF...
- Page 44 Setting Basic Settings of Measurement Conditions Use / to set the wait time (time to stabilize) Wait time from the time a measurement signal has been output by applying a trigger to the start of the next measurement. (With the numeric keypad, press [SET].) INDEX time Settable range 0.00000 s to 9.99999 s Sets to the default value.
- Page 45 Setting Basic Settings of Measurement Conditions 3.2.5 Setting the Measurement Frequency Sets the frequency of the signal applied to the test sample. The value of the measurement frequency level may change according to the sample which is being tested. Press [SETUP]. Press [BASIC] tab. Press [FREQ]. Set the frequency with /...
- Page 46 Setting Basic Settings of Measurement Conditions 3.2.6 Setting the Measurement Signal Level Sets the Measurement signal level. The value of the measurement signal level may change based on the sample tested. This instrument can set the measurement signal applied to the object to be tested using the following three methods. Sets measurement signal level with the power (dBm) at the DUT port Power (P) mode Ω terminal. Sets measurement signal level with the voltage (V) when the DUT Voltage (V) mode port is open.
- Page 47 Setting Basic Settings of Measurement Conditions Set the voltage or current with / or the numeric keypad. (With the numeric pad, press [dBm].) Measurement signal Settable range mode Power (P) mode -40.0 to +7 dBm (resolution, 0.1 dBm) The numeric keypad can be used for input. Voltage (V) mode 4 mV to 1001 mV Current (I) mode 0.09 mA to 20.02 mA Repeats the input.
- Page 48 Setting Basic Settings of Measurement Conditions 3.2.7 Setting the Measurement Speed Change the measurement time. Setting the measurement speed to [FAST] enables high speed measurement. Setting to [SLOW2] enables measurement with high accuracy. • If the measurement speed is changed, calibration and compensation must be performed again. See “5 Calibration and Compensation”...
- Page 49 Setting Basic Settings of Measurement Conditions 3.2.8 Displaying Average Values (Average) The measured values can be averaged using the averaging function. The variations in the displayed measured values can be reduced with this function. The measured values are always the moving average from present to before the number of times of averaging. Internal trigger (When the sample to be tested is changed, it takes time for the values to stabilize and the results are reliable.)
- Page 50 Setting Basic Settings of Measurement Conditions Press [SETUP]. Press [BASIC] tab. Press [AVG]. Use / to enter the averaging number of times. Settable range 1 to 256 times Setting is turned OFF. Press [EXIT] to close the average setting screen. Press [EXIT] to close the advanced settings screen.
- Page 51 Judging Measurement Results 3.3 Judging Measurement Results The judgment results are displayed after the measurement results are compared to an arbitrarily set reference. This function is useful for processes such as shipping inspection. This includes the comparator function to make pass/fail judgments (HI/IN/LO) of measured values with one judgment standard, and the BIN function to classify (rank) measured values based on several judgment standards (up to 10). L_COMP.png One of the following 3 judgment methods can be used. Setting the upper and lower limit values (ABS) (p. 48) Upper limit value Setting the upper limit and lower limit values for the measurement parameters.
- Page 52 Judging Measurement Results The ∆% value is calculated using the following formula: measured value - reference value ∆% = × 100 | reference value| 3.3.1 Setting the Judgment Mode Judgment results can be checked by acquiring the results of beep sounds, screen display, I/O output, and communication commands.
- Page 53 Judging Measurement Results With /, set the beep volume. Settable range 1 to 3 Press [EXIT] to close the judgment settings screen. Press [EXIT] to close the advanced settings screen.
- Page 54 Judging Measurement Results 3.3.2 Judging with Upper and Lower Limit Values (Comparator Judgment Mode) This mode judges if the measurement results are within the specified range. The comparator judgment allows you to do the following. • Preset a judgment reference with reference value, upper and lower limit values, and display the judgment result as HI (higher than the upper limit value), IN (within the range set for the upper and lower limit values), or LO (lower than the lower limit value). • Output the judgment results to an external device (via the EXT I/O connector). • Judges up to four parameters with different settings. •...
- Page 55 Judging Measurement Results • Comparator judgment can be used even if only the upper or lower limit value has been set. When only an upper limit value When only a lower limit value has been set has been set Upper limit value Lower limit value...
- Page 56 Judging Measurement Results Upper and lower limit values mode This mode performs judgment with the upper and lower limits (ABS) that have been set. Press [LMT]. Press [MODE]. Press [ABS]. Press [HI]. Set the upper limit value with the numeric pad and press [SET]. Settable range -9.99999 G to 9.99999 G Inputs the unit with a minus (-) sign. Changing the unit: a/f/p/n/µ/m/None/k/M/G [×10 Increases the prefix of the unit. Decreases the prefix of the unit.
- Page 57 Judging Measurement Results Percent mode The difference between the upper limit and the reference value, and between the lower limit and the reference value is set as a ratio (percentage) relative to the reference value, and it is judged whether measured values are within the range of the upper and lower limit values. The set reference value, upper and lower limit values are common for percentage mode and deviation percentage mode.
- Page 58 Judging Measurement Results Press [LO]. Set the lower limit value with the numeric pad and press [SET]. Set the lower limit value as a percentage relative to the reference value. Settable range -999.999% to 999.999% The actual internal operation calculates the lower limit comparison value with the following formula, and when a value lower than the reference value is set, the minus (-) sign is required for the percentage setting value.
- Page 59 Judging Measurement Results ∆% mode The difference between the upper limit and the reference value, and between the lower limit and the reference value is set as a ratio (percentage) relative to the reference value, and it is judged whether measured values are within the range of the upper and lower limit values. In the deviation percentage mode, the measured values display the deviations (∆%) from the reference value. The ∆% value is calculated using the following formula: measured value - reference value ×...
- Page 60 Judging Measurement Results Press [REF]. Set the reference value with the numeric pad and press [SET]. Settable range -9.99999 G to 9.99999 G Inputs the unit with a minus (-) sign. Changing the unit: a/f/p/n/µ/m/None/k/M/G [×10 Increases the prefix of the unit. Decreases the prefix of the unit. [OFF] Value is not set. Repeats the input. Cancels the setting. CANCEL] Press [HI]. Set the upper limit value with the numeric pad and press [SET].
- Page 61 Judging Measurement Results 3.3.3 Classifying Measurement Results (BIN Judgment) Set the upper and lower limit values for 4 parameters and display up to 10 classifications of judgment results. You can also output the judgment results to an external device. Select the BIN judgment mode before setting the judgment conditions. (p. 44) In case of BIN judgment - - - When BIN is not set When not matching any BIN BIN judgment order: Starts with judgment of the first parameter for BIN1 and proceeds in order to BIN10, as described below. The instrument will display the first BIN number for which the measured value is judged to be within the set judgment standard. If none of the BIN judgments are within the set judgment standard, [OUT] will be displayed. Judgment BIN judgment Second parameter Third parameter Fourth parameter BIN number First parameter results BIN1 Judgment Judgment...
- Page 62 Judging Measurement Results The measurement elements can be ranked by setting a series of severe to lenient judgment standards as shown in the following diagram. • For more information about HI/IN/LO judgment BIN1 BIN2 BIN3 BIN4 BIN5 BIN10 procedures, see p. 46. [OFF] • Set the upper/lower limit values to BIN numbers not requiring BIN judgments. • BIN judgment can be used even if only the upper or lower limit value has been set. (See the following figure.) When only an upper When only a lower limit...
- Page 63 Judging Measurement Results Upper and lower limit values mode This mode performs judgment with the upper and lower limits (ABS) that have been set. Press [LMT]. Press [Z]. The key display differs depending on the measurement parameter. Press [MODE]. Press [ABS]. Press [EXIT] to return to the BIN setting screen. Display the BIN number to be set with / or by scrolling.
- Page 64 Judging Measurement Results Percent mode The difference between the upper limit and the reference value, and between the lower limit and the reference value is set as a ratio (percentage) relative to the reference value, and it is judged whether measured values are within the range of the upper and lower limit values. Press [LMT]. Press [Z]. The key display differs depending on the measurement parameter.
- Page 65 Judging Measurement Results Use the numeric keypad to set the upper limit value of the first parameter and press [SET]. Settable range -999.999% to 999.999% Press the part corresponding to LO of the first parameter. Use the numeric keypad to set the lower limit value and press [SET]. Settable range -999.999% to 999.999% The screen returns to the state in step 7. Set the upper and lower limit values of the second to fourth parameters, and press [SET].
- Page 66 Judging Measurement Results ∆% mode The difference between the upper limit and the reference value, and between the lower limit and the reference value is set as a ratio (percentage) relative to the reference value, and it is judged whether measured values are within the range of the upper and lower limit values. The set reference value, upper and lower limit values are common for percentage mode and deviation percentage mode.
- Page 67 Judging Measurement Results Display the BIN number to be set with / or by scrolling. Press the part corresponding to HI of the first parameter. Use the numeric keypad to set the upper limit value of the first parameter and press [SET]. Settable range -999.999% to 999.999% Press the part corresponding to LO of the first parameter. Use the numeric keypad to set the lower limit value and press [SET].
- Page 68 Judging Measurement Results...
- Page 69 Analyzer Function Analyzer Function 4.1 Analyzer Function The analyzer function allows you to perform measurement while sweeping the measurement frequency and signal level. The measurement results can be displayed as a graph or numerical value. This function is used for measuring frequency characteristics and level characteristics.
- Page 70 Analyzer Function Flowchart ANALYER measurement START Set the MODE to ANALYZER Necessary settings Measurement parameter settings Sweep parameter setting Other basic settings (DELAY, SYNC, TRIG) Settings of sweep points Calibration/Compensation Graph display settings User-defined settings Contact check settings Judgment settings Equivalent analysis circuit setting Common settings Measurement Read measured value with CURSOR Read measured value with SEARCH...
- Page 71 Analyzer Function Judgment settings Judgment settings Settings of JUDGE SEGMENT ? Select target parameters AREA PEAK JUDGE ? Settings of AREA Settings of PEAK area Settings sweep points Settings of sweep points Settings of SEGMENT SEGMENT ? Interval QUICK EDIT Sweep range of segment, sweep Sweep range number, sweep count, Interval, basic measurement settings...
- Page 72 Analyzer Function Screen map Measurement Advanced settings screen (p. 69) mode setting screen (p. 25) Compen- sation settings screen (p. 139) [CAL] Calibration p. 143 [Rdc LIMIT] DC measurement limit value p. 150 Electrical length [LENGTH] p. 152 compensation [COMPEN] Compensation p.
- Page 73 Analyzer Function [PARA] Parameters p. 69 [SOURCE] Sweep parameter p. 74 [DELAY] Trigger delay p. 71 Advanced settings [SYNC] Trigger synchronous output p. 72 screen [TRIG] Trigger p. 70 (p. 69) Contact check settings (DC p. 169 [TIMING] measurement) [Hi Z] Hi Z reject function p.
- Page 74 Analyzer Function Measurement screen Displays the measured value Sets the cursor. (p. 105) Executes search. (p. 107) at the cursor position. Moves the cursor. Moves the cursor to the left by ten points. Moves the cursor to the left by one point. Moves the cursor to ...
- Page 75 Analyzer Function Types of graph [DISP] on the measurement screen allows you to select the displayed graph. [1 GRAPH] [4 GRAPHs] Overall comparator judgment Sweep graph Sweep graph 1 Sweep graph 2 result Second parameter First parameter All of the first through fourth parameters Sweep graph 4 Sweep graph 3...
- Page 76 Analyzer Function Status and error display of this instrument Displays the current measurement mode. Displays the state of calibration/ compensation. LCR function AC measurement Analyzer function Calibration disabled Continuous measurement Calibration function Calibration enabled Compensation disabled Displays error messages. Compen- sation Compensation Outside guaranteed accuracy...
- Page 77 Setting Basic Settings of Measurement 4.2 Setting Basic Settings of Measurement 4.2.1 Setting the Measurement Parameters Select measurement display parameters. The ANALYZER mode allows four types of parameter measurements; first to fourth parameters. Press [SETUP]. Press [SWEEP] tab. Press [PARA]. Press the parameter key that you want to set. First parameter Second parameter [PARA1] [Rs] (effective resistance in series equivalent circuit mode = ESR Ω...
- Page 78 Setting Basic Settings of Measurement 4.2.2 Starting Measurement at Any Arbitrary Timing (Trigger) Set the trigger. The following are the three types of trigger that can be set for the instrument. Refer to Step 4 for details on each trigger. • Sequential sweep • Repeat sweep •...
- Page 79 Setting Basic Settings of Measurement 4.2.3 Setting the Delay Time from Trigger to Measurement Start (Trigger Delay) Set the delay time from when a trigger is input until measurement starts. Trigger delay: OFF Trigger delay: ON ― ― ― ― ― ― ― ― TRIG TRIG ―...
- Page 80 Setting Basic Settings of Measurement 4.2.4 Applying the Signal to the Sample during Measurement Only (Trigger Synchronous Output) This function enables the measurement signal to be output for only the initial sweep point after measurement is triggered, so that the signal is applied to the sample during measurement only. You can also set a delay time to ensure that data is acquired after the sample stabilizes. Thus reducing the generation of heat in the sample and decreasing electrode wear.
- Page 81 Setting Basic Settings of Measurement Use / or the numeric keypad to set the wait time (time to stabilize) from the time a measurement signal has been output by applying Wait time a trigger to the start of next measurement. (With the numeric keypad, press [SET].) Settable range 0.00000 s to 9.99999 s INDEX time Sets to the default value.
- Page 82 Setting Basic Settings of Measurement 4.2.5 Setting the Sweep Parameter Select sweep parameters. There are four types of parameters that can be set: frequency, measurement signal level (power [P], voltage [V], and current [A]). CAUTION Do not switch between P, V, and I while the test sample is still connected to the measurement terminals as this may damage the test sample.
- Page 83 Sweep Measurement 4.3 Sweep Measurement Sets the sweep range and sweep points and performs sweep measurement. Types of sweep range START-STOP START-STEP Sets the start value and end value of the sweep. Sets the start value of the sweep and the step Each sweep point is automatically calculated width of sweep points.
- Page 84 Sweep Measurement 4.3.1 Setting the Sweep Method Select the sweep method. Sets the sweep range and number of sweep points and performs Normal sweep measurement. Normal interval sweep (It is also possible to fix the sweep parameter and perform “interval (p. 82) measurement”, measurement at a set time interval.) Divides the sweep range into ranges called “segments” and performs sweep measurement.
- Page 85 Sweep Measurement Setting example for normal sweep and segment sweep Normal sweep Segment sweep Sweep setting items Segment Segment 1 Segment 2 Segment 3 Sweep parameter Frequency Frequency Frequency Frequency 1.0000 MHz to 1.0000 MHz to 10.000 MHz to 50.000 MHz to Sweep range 300.00 MHz 5.0000 MHz...
- Page 86 Sweep Measurement 4.3.2 Setting the Sweep Range Set the sweep range. • If the sweep parameter is V or I, [CENTER-SPAN] [START-STEP] cannot be set. • For segment sweep, only [START-STOP] [INTVL MEAS] can be set. • The sweep range settings differ depending on the sweep parameter ([SOURCE]) settings. (p.
- Page 87 Sweep Measurement Sweep range list Setting of sweep Sweep range Contents of Settable range parameters setting setting ([SOURCE]) Frequency Start value of [FREQ] sweep 1.0000 MHz to 300.00 MHz [START] End value of sweep 1.0000 MHz to 300.00 MHz [STOP] [START-STOP] Number of sweep points...
- Page 88 Sweep Measurement Setting of sweep Sweep range Contents of Settable range parameters setting setting ([SOURCE]) Power Start value of [POWER] sweep -40.0 dBm to 7.0 dBm [START] End value of [START-STOP] sweep -40.0 dBm to 7.0 dBm [STOP] Number of sweep 1 to 801 points * Setting method for sweep points is fixed to [LINEAR] [NUM] Center value of sweep range -40.0 dBm to 7.0 dBm [CENTER]...
- Page 89 Sweep Measurement Setting of sweep Sweep range Contents of Settable range parameters setting setting ([SOURCE]) Voltage Start value of sweep 4 mV to 1001 mV [START] End value of [START-STOP] sweep 4 mV to 1001 mV [STOP] Number of sweep 1 to 801 points * Setting method for sweep points is fixed to [LINEAR]...
- Page 90 Sweep Measurement 4.3.3 Normal Sweep Batch setting for normal sweep Press [SETUP]. Press [LIST] tab. Press [QUICK EDIT]. Setting the sweep range. See “4.3.2 Setting the Sweep Range” (p. 78). Batch setting for measurement conditions. See “4.4 Set Measurement Conditions for Sweep Points”...
- Page 91 Sweep Measurement Adding sweep points Press [SETUP]. Press [LIST] tab. Move the cursor to the point to be added in the list of sweep point with / or by scrolling. To add a sweep point on the next point in the selected row. Press [ADD].
- Page 92 Sweep Measurement Press [LIST] tab. Move the cursor to the point to be deleted in the list of sweep point with / or by scrolling. Press [DELETE]. Editing sweep points Press [SETUP]. Press [LIST] tab. Move the cursor to the point to be edited with / or by scrolling.
- Page 93 Sweep Measurement 4.3.4 Segment Sweep, Segment Interval Sweep Adding segments Press [SETUP]. Press [LIST] tab. Move the cursor to the point to be added with / or by scrolling. Add a segment on the next point in the selected row. Press [ADD].
- Page 94 Sweep Measurement Editing segments Press [SETUP]. Press [LIST] tab. Move the cursor to the point to be edited with / or by scrolling. Press [EDIT]. Setting the sweep range. See “4.3.2 Setting the Sweep Range” (p. 78). The setting of sweep range is fixed to [START-STOP] in segment sweep, and [INTVL MEAS] in segment interval sweep.
- Page 95 Sweep Measurement Checking the set sweep points Press [SETUP]. Press [LIST] tab. Press [VIEW POINT]. The set sweep points can be checked.
- Page 96 Set Measurement Conditions for Sweep Points 4.4 Set Measurement Conditions for Sweep Points Sets the measurement conditions for sweep points. Setting is possible from the setting and editing of sweep points. Reference: “4.3.3 Normal Sweep” (p. 82), “4.3.4 Segment Sweep, Segment Interval Sweep” (p.
- Page 97 Set Measurement Conditions for Sweep Points 4.4.2 Setting the Measurement Signal Level The value of the test signal level may change based on the sample tested. CAUTION Do not switch between P, V, and I while the test sample is still connected to the measurement terminals as this may damage the test sample.
- Page 98 Set Measurement Conditions for Sweep Points Set the voltage or current with / or the numeric pad. (With the numeric pad, press [dBm].) Measurement signal Settable range mode Power (P) mode -40.0 dBm to +7 dBm The numeric keypad can be (resolution, 0.1 dBm) used for input. Voltage (V) mode 4 mV to 1001 mV Current (I) mode 0.09 mA to 20.02 mA Repeats the input.
- Page 99 Set Measurement Conditions for Sweep Points Select the measurement speed. [FAST] Performs high-speed measurement. [MED] Performs normal-speed measurement. [SLOW] Increases measurement accuracy. [SLOW2] Measurement accuracy is better than SLOW. Advanced settings for the measurement [CUSTOM] speed is enabled. Setting range: 8 to 87 Press [EXIT] to close the measurement speed setting screen.
- Page 100 Set Measurement Conditions for Sweep Points 4.4.4 Displaying Average Values (Average) The measured values can be averaged using the averaging function. The variations in the displayed measured values can be reduced with this function. • The measured values are averaged by arithmetic averaging during analyzer measurement irrespective of the trigger setting.
- Page 101 Set Measurement Conditions for Sweep Points 4.4.5 Setting the Delay Time for Each Sweep Point (Point Delay) Set the delay time for each sweep point in the point delay setting. In sweep measurement, some measurement samples may require time for the measured value to stabilize due to transient response.
- Page 102 Setting the Graph Display Method 4.5 Setting the Graph Display Method 4.5.1 Setting the Horizontal Axis Horizontal axis scale setting Press [GRAPH]. Press [SCALE]. Select the drawing type. [LINEAR] Sets the horizontal axis to linear (linear axis). [LOG] Sets the horizontal axis to log (logarithmic axis).
- Page 103 Setting the Graph Display Method Span setting You can select single span mode and segment span mode. Span can only be set for segment sweep. Set segment to [SEG ON] [SEG INTVL] beforehand in “4.3.1 Setting the Sweep Method” (p. 76). Draws the measurement result of each segment on the same Single span mode horizontal axis.
- Page 104 Setting the Graph Display Method Comparison example between single span mode and segment span mode Setting example: Sweep settings Segment 1 Segment 2 Segment 3 Sweep parameter Frequency Frequency Frequency Sweep range 1.0000 MHz to 5.0000 MHz 5.0000 MHz to 80.000 MHz 30.000 MHz to 300.00 MHz Single span mode Segment span mode...
- Page 105 Setting the Graph Display Method 4.5.2 Setting the Vertical Axis Setting the vertical axis scale Set the drawing method for the vertical axis scale to linear (linear axis) or log (logarithmic axis). • When measurement starts, the display range of the scale is set to the range from the maximum value to the minimum value or the scaling that was set when measurement ended the previous [SCALE] time.
- Page 106 Setting the Graph Display Method Manual scaling setting Set the upper and lower limit values for the vertical axis. When measurement starts, the display range of the scale is set to the range from the maximum value to the minimum value or the scaling that was set when measurement ended the previous time. To set the optimal scaling in accordance with the measurement results, press [SCALE] in the measurement screen.
- Page 107 Setting the Graph Display Method When [MANUAL] is selected • [UPPER-LOWER]: Sets the upper and lower limit values. Use the numeric keypad to input numerical values and press [SET]. Contents of setting Setting range [UPPER] -9.9999 G to 9.9999 G ([LINEAR]) (Upper limit value) 100.00 a to 9.9999 G ([LOG]) [LOWER] -9.9999 G to 9.9999 G ([LINEAR]) (Lower limit value)
- Page 108 Setting the Graph Display Method 4.5.3 Configuring the X-Y Display Vertical Axis Reversal Setting This section describes how to use the X-Y display vertical axis reversal setting. [ON] setting is recommended to display a Cole-Cole plot. Press [GRAPH]. Press [REVERSE]. Select if X-Y display vertical axis reversal has to be performed. (This setting is available for the second and fourth parameters.) [OFF] Vertical axis of X-Y display is not reversed. [ON] Vertical axis of X-Y display is reversed.
- Page 109 Setting the Graph Display Method 4.5.4 Setting the X-Y Display Scale Width This section describes how to set the scaling method when performing auto-scaling by pressing [SCALE] on the X-Y display. When rendering a Cole-Cole plot or admittance circle, set the upper and lower limit values while maintaining the same X- and Y-axis grid sizes. • This setting is valid only if both of the X- and Y-axis upper and lower limit value settings are set to [AUTO]. • If the setting for either axis is [MANUAL], [INDIVIDUAL] (normal auto-scaling) will be performed. Press [GRAPH]. Press SCALE]. Select the scaling method. Sets the X- and Y-axis upper and lower [INDIVIDUAL] limit values to individual appropriate values when auto-scaling is performed.
- Page 110 Setting the Graph Display Method 4.5.5 Setting Grid Display Sets the sweep parameter which displays the grid lines. Press [GRAPH]. Press [GRID]. Select the sweep parameter for which grid lines is to be displayed. [PARA1] Displays grid lines for sweep parameter 1. [PARA2] Displays grid lines for sweep parameter 2.
- Page 111 Setting the Graph Display Method 4.5.6 Setting Overwrite When sweep measurement is to be performed repeatedly, set the graph drawing method. If you set overwrite, you can check the variations of the element in the graph. Press [GRAPH]. Press [OVERWRITE]. Select the overwrite setting. When sweep measurement is performed repeatedly, the graph drawn for the last [OFF] measurement is deleted and a graph of the most recent measurement results will be...
- Page 112 Setting the Graph Display Method Press [CLEAR]. An overlaid graph is deleted, and the latest measurement result is retained. If operations such as execution of auto scale, moving the cursor and changing the settings are performed, the overwritten graph will be erased.
- Page 113 Setting the Cursor 4.6 Setting the Cursor You can display a cursor in the measurement screen to check the measured value of a measurement point. The search function can be used to simplify the task of finding measured value maximum, minimum, and peak values (local maximum and local minimum values). 4.6.1 Selecting the Cursor to Display in the Screen Press [CURSOR]. Press [CURSOR]. Select the cursor to display in the screen. [OFF] Cursor is not displayed.
- Page 114 Setting the Cursor 4.6.2 Setting Cursor Move Select movable cursors when the measurement screen is displayed. Moving cursors allows you to check the measured value of the cursor position. This can only be set when [A&B] is selected for the display cursor setting. Press [CURSOR].
- Page 115 Performing Measured Value Search 4.7 Performing Measured Value Search When you perform a search, the cursor moves to the search result point and you can check the search result. You can perform search for the measurement results of one sweep using the method set in “4.7.2 Setting the Search Type” (p. 108). The search target parameter is the parameter set in “4.7.1 Setting the Search Target Parameter” (p. 107). Auto search setting (p. 109) Cursor A Filter setting (p.
- Page 116 Performing Measured Value Search 4.7.2 Setting the Search Type Press [SEARCH] of the target cursor. Set the search type. Searches the maximum value of [MAX] measurement result. Moves the cursor to the minimum value of [MIN] the measurement results. Searches the measured value set in the [TARGET] target measured value.
- Page 117 Performing Measured Value Search Setting target slope [TARGET] Sets the target slope when is selected in the setting of search type. Press [SLOPE] of the target cursor. When executing a target search, set if search has to be performed in rising waveform or falling waveform for the value to be searched.
- Page 118 Performing Measured Value Search 4.7.4 Executing Search • When the setting of trigger is [REPEAT], search cannot be performed. See “4.2.2 Starting Measurement at Any Arbitrary Timing (Trigger)” (p. 70). • If more than one sweep point matches the condition, the cursor moves each time you press [SEARCH].
- Page 119 Performing Measured Value Search Local maximum point Local minimum point Local maximum Local minimum value value In the search results, the sweep point that is In the search results, the sweep point that is considered to be the local maximum value is considered to be the local minimum value is indicated below the X axis.
- Page 120 Judging Measurement Results (Comparator Function) 4.8 Judging Measurement Results (Comparator Function) With the comparator function, you can preset a judgment area and judge whether the measured values are within the judgment area. Judges whether the measured values of sweep points are within the Area judgment judgment area. (p. 116) Judges whether the peak value of one sweep result is within the Peak judgment judgment area. (p. 120) With the comparator function of the analyzer function, as far as possible set trigger setting to [SEQ]...
- Page 121 Judging Measurement Results (Comparator Function) Select the judgment mode. [OFF] Disables comparator function. [AREA] Enables area judgment. (p. 116) [PEAK] Enables peak judgment. (p. 120) When a measured value is outside the guaranteed accuracy range, set how the measured value is judged. Judges when a measured value is outside [DO] the guaranteed accuracy range.
- Page 122 Judging Measurement Results (Comparator Function) Select the parameter to be judged. Select ON/OFF for the parameter to be judged. Disables judgment of the selected [OFF] parameter. Enables judgment of the selected [ON] parameter. Press [EXIT] to close the judgment settings screen. Press [EXIT] to close the advanced settings screen.
- Page 123 Judging Measurement Results (Comparator Function) 4.8.3 Setting the Judgment Area to Display in the Measurement Screen Press [SETUP]. Press [COMP] tab. Press [AREA]. Select the parameter that will display the judgment areas. [PARA1] Displays the judgment area for parameter 1. [PARA2] Displays the judgment area for parameter 2. [PARA3] Displays the judgment area for parameter 3. [PARA4] Displays the judgment area for parameter 4. [OFF] Judgment area is not displayed.
- Page 124 Judging Measurement Results (Comparator Function) 4.8.4 Area Judgment With area judgment, you can set the range for the upper and lower limit values to enable IN or NG to be displayed as the judgment result. Set trigger setting to [SEQ] and perform a sweep once before setting the area judgment function because there are items etc that use the sweep results in the area judgment function for configuring the settings of the judgment area. Displays the overall judgment result. If the measured values of all sweep points are within the range set with the upper and lower value settings If any of the measured values of the sweep points are not within the range set with the upper and lower value settings If a judgment is not made...
- Page 125 Judging Measurement Results (Comparator Function) Sets the judgment area for sweep parameter 1. Sets the upper and lower limit values with [MEAS VAL] the current measured values as reference. Sets the reference value, upper limit value, [FIX VAL] and lower limit value. Sets the upper and lower limit values as percentage values relative to the reference value.
- Page 126 Judging Measurement Results (Comparator Function) Press the cell corresponding to LO of any arbitrary segment. Set the lower limit value with the numeric pad* and press [SET]. Settable range -999.999% to 999.999% (set as % value) * Each common numeric keypad Settable range (set as absolute -9.99999 G to 9.99999 G value)
- Page 127 Judging Measurement Results (Comparator Function) Changing the upper and lower limit values of each sweep point individually Press [SETUP]. Press [COMP] tab. Press [EDIT POINT]. Displays the sweep number to be set with /. Press the limit value cell for each sweep point. Set the limit value with the numeric pad and press [SET].
- Page 128 Judging Measurement Results (Comparator Function) 4.8.5 Peak Judgment With peak judgment, you can judge whether the peak value is within the judgment area. The judgment area can be set with the upper, lower, left, and right limit values. Displays the overall judgment result. If all of the peak values are within the judgment area. If any of the peak values are not within the judgment area.
- Page 129 Judging Measurement Results (Comparator Function) Use / to select the No. of the local maximum value or local minimum value for peak judgment. See “4.7 Performing Measured Value Search” (p. 107). • Selects the No. of the local maximum value. The values are numbered as “1, 2, 3...”...
- Page 130 Judging Measurement Results (Comparator Function) Press the cell for LEFT/RIGHT of user-defined conditions. Use the numeric keypad to set the left and right limit values. The range that can be set varies depending on the sweep parameter. Refer to the following for each of the parameters. •...
- Page 131 Judging Measurement Results (Comparator Function) How to read the peak judgment result details Parameters Segment No. Local maximum Judgment Sweep Measured or local minimum result points values value The gray part is the judgment area. The judgment result indicates the position of the detected peak in relation to the judgment area. HI-LT HI-RT LO-LT LO-RT • If the peak could not be detected, “??” is displayed.
- Page 132 Equivalent Circuit Analysis Function 4.9 Equivalent Circuit Analysis Function 4.9.1 Equivalent Circuit Analysis Function The equivalent circuit analysis function estimates equivalent circuit constants based on the measurement results. This instrument can estimate constants for the following five equivalent circuit models. Models A to E: Used primarily in the analysis of circuit elements. You can display ideal values for frequency characteristics using estimation results or user- configured constants by using the simulation function.
- Page 133 Equivalent Circuit Analysis Function 4.9.2 Configuring Basic Settings for Analysis (1) Setting the equivalent circuit model Select the equivalent circuit model you wish to use for equivalent circuit analysis. You will be able to estimate constants more accurately by selecting the appropriate equivalent circuit model. Press [SETUP]. Press [CIRCUIT] tab. Press [MODEL]. Select the model to be used in equivalent circuit analysis.
- Page 134 Equivalent Circuit Analysis Function (2) Setting the analysis method This section describes how to set whether to perform equivalent circuit analysis automatically after measurement completes or to wait until [RUN] is pressed. Press [SETUP]. Press [CIRCUIT] tab. Press [MANU/AUTO]. Selects the analysis method . [MANUAL] Press [RUN]...
- Page 135 Equivalent Circuit Analysis Function (3) Setting the frequency range for analyses This section describes how to set the frequency range used to perform equivalent circuit analysis when using normal sweep. This function allows you to restrict local extreme values to be used for the analysis in case several local extreme values exist in the sweep range. Configures the setting so that local extreme values are included in the analysis range.
- Page 136 Equivalent Circuit Analysis Function (4) Selecting the segment for analysis This section describes how to select the target segment for estimation during a segment sweep. You can specify the segments to be used in analysis when dividing the frequency range into multiple segments for measurement by using this function. Set the segment that includes local extreme values.
- Page 137 Equivalent Circuit Analysis Function (5) Settings for electromechanical coupling coefficient (K) calculation Make necessary settings to calculate the electromechanical coupling coefficient (K) using model E. Press [SETUP]. Press [CIRCUIT] tab. Press [K]. Press [MODE]. Select the oscillation mode. Electromechanical coupling coefficient for planar oscillation [Kr] − × + × − Electromechanical coupling coefficient for longitudinal direction extension oscillation π × [K31] π π...
- Page 138 Equivalent Circuit Analysis Function Press [TYPE]. Select the frequency type. Select the resonant frequency type to be used when calculating the electromechanical coupling coefficient. Selects the series/parallel resonant [fs-fp] frequency. Selects the resonant/anti-resonant [fr-fa] frequency. (Substitutes fs with fr and fp with fa in the formula of Step 4.) (If [planar oscillation] is selected in the oscillation mode) Sets a different coefficient for Poisson’s ratio.
- Page 139 Equivalent Circuit Analysis Function (6) Setting the position at which to display analysis results This section describes how to set the position at which to display analysis results. If the graph and analysis results displays overlap, set the position so that estimated values are easy to read. Press [SETUP].
- Page 140 Equivalent Circuit Analysis Function 4.9.3 Performing Equivalent Circuit Analysis (1) Performs frequency sweep measurement Before performing equivalent circuit analysis Set the sweep parameter to “frequency” and acquire frequency characteristics of elements to be analyzed. Refer to “4.2.5 Setting the Sweep Parameter” (p. 74) Because the local maximum and local minimum measurement points are used when performing equivalent circuit analysis with this instrument, the frequency range should be set to the range for which the local extreme values can be measured.
- Page 141 Equivalent Circuit Analysis Function Performing equivalent circuit analysis Qm indicates the sharpness of the mechanical vibration at the resonant frequency (Mechanical quality coefficient). When analysis method is set to AUTO Analysis is automatically performed after the completion of measurement and the result is displayed. Analysis results (for normal measurement)
- Page 142 Equivalent Circuit Analysis Function If resonance points cannot be detected If the instrument cannot detect the resonance points that are used in analysis, the following error message will be displayed. Configure the settings so that the sweep range includes resonance points. Additionally, verify that the frequency range and segments used in the analysis are appropriately configured.
- Page 143 Equivalent Circuit Analysis Function 4.9.4 Simulating Frequency Characteristics This section describes how to simulate frequency characteristics using estimated constants or arbitrary constants. Press [CIRCUIT]. Press [SIMULATE]. Differences between observed values and simulated values (p. 136) Press [GET]. Acquires the values for which equivalent circuit analysis has been performed.
- Page 144 Equivalent Circuit Analysis Function Differences between observed values and simulated values The difference between observed values and simulated values is calculated for each measurement parameter in order to judge the suitability of equivalent circuit analysis results. The range for calculating this difference is the frequency range that is analyzed or the frequency range for the segment No.
- Page 145 Equivalent Circuit Analysis Function 4.9.5 Settings to Judge Analysis Results You can judge whether estimation results fall within a predefined judgment standard using the comparator function. Setting the upper or lower limit value You must set upper and lower limit values for the judgment standards before using the comparator function. Press [SETUP]. Press [CIRCUIT] tab. Press [COMP]. Select comparator function ON/OFF. [OFF] Disables comparator function. [ON] Enables comparator function. Select the constants to set judgment standard.
- Page 146 Equivalent Circuit Analysis Function Judge using analysis results When the comparator is ON and the judgment area has been set, the estimated values and judgment results will be displayed after equivalent circuit estimation. Judgment results can also be acquired using communications commands or external output (EXT I/O). Estimated value > upper limit Upper limit ≥ estimated value ≥ lower limit Estimated value < lower limit - - - If reference standards have not been set The overall judgment result is output from EXT I/O pin 14. See “8 External Control” (p. 195). However, the judgment content differs depending on whether analysis method is [MANUAL] [AUTO].
- Page 147 Calibration and Compensation Function Overview Calibration and Compensation 5.1 Calibration and Compensation Function Overview It is necessary to perform open/short/load calibration on the instrument prior to measurement. In addition, electric length compensation, and open/short compensation are performed when necessary. Open/Short/Load Calibration Connect the 3 standards, open, short and load to the reference surface (terminal) one by one, and measure respective calibration data.
- Page 148 Connector, cable, test calibration reference surface fixture Hioki Measurement impedance analyzer Test head sample Instrument Cable 1 m Open/short/ (IM7580-02: 2 m) Open/short load calibration Calibration compensation reference surface [CAL] (p. 143) [LENGTH] (p. 152) The errors between the measurement instrument The errors caused by the electric and the test head (calibration reference surface) are length are compensated.
- Page 149 Calibration and Compensation Function Overview Calibration and compensation flowchart Press each of [OPEN], [SHORT], and [LOAD] keys to start compensation after performing the setting explained in this section. Case 1 Calibration Electric length compensation Compensation DC measurement limit setting Length setting DC measurement limit setting Calibration MODE setting MODE ON...
- Page 150 Calibration and Compensation Function Overview Screen Start compensation Compensation results Switching the measurement signal level [P > 7 dBm] Measured value at 7 dBm [P > -3 dBm] Measured value at -3 dBm [P > -23 dBm] Measured value at -23 dBm Measurement Compensation [P > -30 dBm] Measured value at -30 dBm frequency value No. Changing the display of reference values and measured values [VAL >...
- Page 151 Calibration 5.2 Calibration 5.2.1 Setting the Calibration [CAL] The errors between the measurement instrument and the calibration reference surface are eliminated. Connect the three types of standard units (open/short/load) one by one with the reference surface (terminal) to be calibrated, and obtain respective measurements. In case of DC resistance measurements, if different standard units are used, perform AC measurement and DC measurement separately.
- Page 152 Calibration For each of [OPEN], [SHORT], and [LOAD], the offset delay values of a random calibration kit is set with the numeric keypad. [RESET] The set value becomes 0. [CANCEL] Cancels the setting. Example: In case of [OPEN] Press [SET]. The numerical value is entered again.
- Page 153 Calibration Limiting the calibration range (This is set only when the calibration method [ALL] is selected in step 4.) In ALL calibration, calibration is performed for the entire frequency range. By setting the minimum and maximum frequencies in ALL calibration, the time required for calibration can be reduced. • The calibration range setting is common with [COMPEN] (Compensation).
- Page 154 Calibration Setting the reference value Use / or scroll to select the item to be changed. To change the reference value for AC measurement: Press DEF]. To change the reference value for DC measurement: Press DEF]. When the list does not display the reference value (When the display at the top of the list is not VAL:DEFINE), press [VALDEF] to change the display.
- Page 155 Calibration Setting the measurement conditions This setting is possible only in LCR mode. In ANALYZER mode, sweep setting conditions are set automatically. ALL calibration Press [SPEED]. Select the calibration speed. Press [SET]. SPOT calibration Use / or scroll to select the item to be changed. Press [SET]. Press [FREQ], [LEVEL], [SPEED] to perform each setting.
- Page 156 Calibration Perform measurement Performs the calibration measurement. To avoid improper connection of the standard units, perform “Prevention of improper standard unit connection” (p. 150) setting in advance. Open measurement Connects the standard unit for open to the test sample connection terminal. Press [OPEN].
- Page 157 Calibration Press [AC + DC]. Starts measurement. If the standard unit used in AC measurement is different from that the one used in DC measurement, press [AC], [DC]. The results are displayed under [SHORT] after completion of measurement. [CANCEL] Cancels the setting, and closes the screen. Load measurement Connect the standard unit for load to the test sample connection terminal.
- Page 158 Calibration Prevention of improper standard unit connection To avoid improper connection of the three types of standard units (open/short/load), judgment can be made by setting the limit with DC measurement. During calibration measurement, if the limit values are set, exceeding the limit will result in an error, and the calibration measurement will be stopped. In case of an error, check that an appropriate standard unit is connected.
- Page 159 Calibration Press [LOAD MIN]. Set the limit values with the numeric keypad*. Settable range -9.99999 G to 9.99999 G Press [SET] to close the setting screen. During load calibration measurement, an error occurs if the DC measured value falls below this limit, and the measurement is stopped.
- Page 160 Calibration 5.2.2 Setting the Electric Length [LENGTH] Compensation is performed for the error caused by the phase shift occurring between the calibration reference surface and the measurement sample connection surface. Enter the electric length between the calibration reference surface on which open calibration, short calibration, and load calibration were performed for the surface where the measurement sample is connected.
- Page 161 Error Compensation 5.3 Error Compensation 5.3.1 Setting the Compensation [COMPEN] The errors between the calibrated calibration reference surface and the measurement terminal are eliminated. When the test sample is connected to the measurement terminal extended from the calibration reference surface on which open calibration, short calibration, and load calibration were performed, perform the measurement when the terminal to connect the test sample is shorted and opened respectively.
- Page 162 Error Compensation Set the reference value Use / to select the item to be changed. (AC measurement) To change the reference value for AC measurement: Press DEF]. To change the reference value for DC measurement: Press DEF]. When the list does not display the reference value (When the display at the top of the list is not VAL:DEFINE), press [VALDEF] to change the display.
- Page 163 Error Compensation [AC DEF] Select the reference value to be changed. Set the definition value with the numeric keypad. Inputs the unit with a minus (-) sign. [×10 Increases the prefix of the unit. [/10 Decreases the prefix of the unit. Repeats the input. [CANCEL] Cancels the setting. Press [SET]. Press [SET] to close the setting screen. [RESET] The reference value becomes 0. [DC DEF] [CANCEL] Closes the screen without making the setting.
- Page 164 Error Compensation Perform measurement Performs compensation measurement. To avoid improper connection of the standard units, perform “Prevention of Improper Standard Unit Connection” setting in advance. Open measurement Connects the standard unit for open to the test sample connection terminal. Press [OPEN]. Press [AC + DC].
- Page 165 Error Compensation Press [AC + DC]. Starts measurement. If the standard unit used in AC measurement is different from that of DC measurement, press [AC], [DC]. The results are displayed under [SHORT] after completion of measurement. [CANCEL] Cancels the setting, and closes the screen. Prevention of improper standard unit connection To avoid improper connection of the two types of standard unit (open/short), judgment can be made by setting the limit with DC measurement.
- Page 166 Error Compensation Press [OPEN MIN]. Set the limit values with the numeric keypad*. Settable range -9.99999 G to 9.99999 G Press [SET] to close the setting screen. During open calibration measurement, an error occurs if the DC measured value falls below this limit, and the measurement is stopped.
- Page 167 Calculating Values (Scaling) 5.4 Calculating Values (Scaling) Scaling function applies compensation to the measured value. This function can be used to provide compatibility between measurement instruments. Set the compensation coefficients a and b for the measured values of the first to fourth parameters and compensates with the following formula. Refer to “Appx. 1 Measurement Parameters and Calculation Formula” (p. A1) Y = a × X + b However, if the parameter corresponding to X is either D or Q, scaling is applied to θ...
- Page 168 Troubleshooting of Compensation Set each compensation coefficient with the numeric keypad, and press [SET]. Settable range A: -999.999 to 999.999 B: -9.99999 G to 9.99999 G To return to the previous screen without changing the setting value, press [SET] when the screen is blank (the state after is pressed). Changing the unit: a/f/p/n/µ/m/None/k/M/G Inputs the unit with a minus (-) sign.
- Page 169 Continuous Measurement Function Continuous Measurement Function 6.1 Continuous Measurement Function The continuous measurement function loads measurement conditions saved using the panel save function in order and performs a series of measurements. LCR mode and ANALYZER mode measurement conditions can be mixed. Up to 46 continuous measurements can be performed. (LCR 30 items, Analyzer 16 items) When the power is turned on again, measurement screen will be displayed in accordance with the measurement mode used before the power was turned off.
- Page 170 Continuous Measurement Function Operation flow START LCR? ANALYZER? ANALYZER Set mode to LCR Mode set to ANALYZER LCR setting Analyzer setting “LCR Function” “Analyzer Function” (p. 27) (p. 61) Panel save Have the required settings been saved? Mode set to CONTINUOUS measurement Set the panel for which continuous measurement is to be performed Measurement...
- Page 171 Continuous Measurement Function Measurement screen Displays a list of panels for which continuous measurement is to be performed. Scrolls the list. Starts continuous measurement. Saves the measurement data. (p. 180) [SAVE] will not be displayed without save settings and if a USB flash drive is not inserted.
- Page 172 Configuring Continuous Measurement Basic Settings 6.2 Configuring Continuous Measurement Basic Settings Set the panels targeted for continuous measurement before performing continuous measurement. Save the measurement conditions with the panel save function in LCR mode or ANALYZER mode in advance. See “9.1 Saving Measurement Conditions (Panel Save Function)” (p. 224). Press [SETUP]. Press [BASIC] tab. A list of the measurement conditions saved with LCR mode and ANALYZER mode is displayed.
- Page 173 Executing and Stopping Continuous Measurement 6.3 Executing and Stopping Continuous Measurement Executing Panels that were set to [ON] in the setting screen are displayed in a list. Press [TRIG]. Stop Press [STOP].
- Page 174 Checking Continuous Measurement Results 6.4 Checking Continuous Measurement Results Displays the panel No. Displays the judgment results of each parameter. Scrolls the list. Displays the measured value. Displays the measurement results and measurement conditions. [VIEW] ANALYZER Displays the measurement results in a graph. Example: To check measurement results in ANALYZER mode with waveforms Select the ANALYZER mode panel with /...
- Page 175 Continuous Measurement Application Settings 6.5 Continuous Measurement Application Settings 6.5.1 Cancels the Measurement if an Error is Detected When an error is detected during continuous measurement, select whether to cancel or continue the measurement. The measurement will be canceled if the set judgment functions of the panel satisfy the following conditions. LCR mode • The comparator or BIN is enabled. • If the judgment result is Fail (HI/LO/OUT). ANALYZER mode • Area judgment or peak judgment is enabled. • If the judgment result is fail (HI/LO/OUT). Press [SETUP]. Press [COMMON] tab. Press [ERR ABORT].
- Page 176 Continuous Measurement Application Settings 6.5.2 Setting the LCD Display to ON/OFF LCD display can be set to ON/OFF. Setting the LCD display to [OFF] saves power because the LCD display is switched off if the panel is idle for approximately 10 seconds. Press [SETUP].
- Page 177 Checking Contact Defects and the Contact State (Contact Check Function) Application Function 7.1 Checking Contact Defects and the Contact State (Contact Check Function) This function checks contact defects and the contact state. This function allows you to detect contact defects between the terminals and the sample during 2-terminal measurement.
- Page 178 Checking Contact Defects and the Contact State (Contact Check Function) Set the wait time Incorporates the wait time for switching the measurement. DC measurement AC measurement DC measurement Calculation DC wait time AC wait time DC wait time Press [SETUP]. Press [CONTACT] tab.
- Page 179 Checking Contact Defects and the Contact State (Contact Check Function) Set the number of samples Press [SETUP]. Press [CONTACT] tab. Press [SWEEP] tab for the ANALYZER mode. Press [WAVE]. Set the value with / or the numeric keypad. (With the numeric keypad, press [SET].) Settable range 1 to 9,999 Sets to the default value.
- Page 180 Checking Contact Defects and the Contact State (Contact Check Function) 7.1.2 Setting the Judgment Press [SETUP]. Press [CONTACT] tab. Press [SWEEP] tab for the ANALYZER mode. Press [LIMIT]. Sets the judgment reference value. Press [HI]. Set the upper limit value with the numeric pad and press [SET].
- Page 181 Checking Contact Defects and the Contact State (Contact Check Function) Press [JDG EXEC]. If the DC measured value is UNCAL, select whether to perform a judgment or not. [DO] Performs a judgment. Judgment is not performed. The result is [NOT] Press [EXIT] to close the setting screen.
- Page 182 Checking Contact Defects and the Contact State (Contact Check Function) 7.1.3 Detecting OPEN During 2-terminal Measurement (HIGH-Z Reject Function) This function outputs a measurement terminal contact error when the measurement result is higher than the set judgment reference. The error is output via the measurement screen and EXT I/O. This error is output as Hi Z on the measurement screen.
- Page 183 Checking Contact Defects and the Contact State (Contact Check Function) 7.1.4 Monitoring the Detection Level (Detection Level Monitoring Function) This function can detect the abnormal measurement waveforms when there is contact between the test sample and the instrument by monitoring the variations in the r.m.s. value of voltage and the r.m.s.
- Page 184 Checking Contact Defects and the Contact State (Contact Check Function) Enter the limit value with /. Settable range: 0.01% to 100.00% Press [EXIT] to close the setting screen. If a detection level error is detected, “LEV ERR” is displayed at the top of the screen. The numeric keypad can be used for input.
- Page 185 Other Functions 7.2 Other Functions 7.2.1 Setting the Number of Display Digits Sets the number of display digits of the measured value. Press [SETUP]. Press [ADVANCED] tab. Press [DIGIT]. Set the number of display digits with / (For each parameter). Settable range 3 to 6 digits Press...
- Page 186 Other Functions 7.2.2 Setting Absolute Values Display (LCR only) Measured values are displayed as absolute values. (θ excluded.) Press [SETUP]. Press [ADVANCED] tab. Press [PARA ABS]. Setting for each parameter. Absolute values are not displayed (Negative values are displayed as [OFF] negative values.) Absolute values are displayed.
- Page 187 Other Functions 7.2.3 Setting the Communication Measurement Data Type The types of measurement data to be acquired via communication are specified. :MEASure:ITEM :MEASure:VALid (See the Communication Commands Instruction Manual. Press [SETUP]. Press [ADVANCED] tab. Press [COM MEAS]. Select the parameters required for the measured value. (Multiple items can be selected.) :MEASure:ITEM setting) Clears the setting.
- Page 188 Common Functions (LCR Mode, ANALYZER Mode) 7.3 Common Functions (LCR Mode, ANALYZER Mode) These settings are common for LCR mode and ANALYZER mode. These settings provide the same conditions to both modes. 7.3.1 Saving Measurement Results (Memory Function) The measurement results can be saved in the instrument (Up to 32,000 items for LCR, and 100 sweeps for ANALYZER).
- Page 189 Common Functions (LCR Mode, ANALYZER Mode) Press [MEMORY]. Select [ON]/[IN]/[OFF] from the memory function. If the comparator and BIN functions are not set, the operation of IN and ON will be the same. [OFF] Disables the memory function. Saves the measured values to the memory only when a pass judgment is made for all of the parameters judged with the [IN] comparator and BIN functions. (LCR only) (The measured values are not saved even if one of the comparator results is HI, LO, or the BIN result is OUT-OF-BINS.) [ON]...
- Page 190 Common Functions (LCR Mode, ANALYZER Mode) 7.3.2 Setting the Screen Display Set the screen display back light ON/OFF (p. 182) Turns OFF the LCD display. [OFF] LCD display turns off after approximately 10 seconds has elapsed since the touch panel was last touched. [ON] Sets the LCD display to always on. Set the background color of the screen.
- Page 191 Common Functions (LCR Mode, ANALYZER Mode) Setting the background color Press [SETUP]. Press [COMMON] tab. (Press [ADVANCED] tab for the ANALYZER mode) Press [DISP]. Press [COLOR]. Setting the background color. Sets the background color of the screen to [BLACK] black. Sets the background color of the screen to [WHITE] white.
- Page 192 Common Functions (LCR Mode, ANALYZER Mode) Setting the parameter color Sets the color for the graph of the measured values or measurement results to be displayed on the screen for each parameter. In addition, you can set a color for each segment in the case of segment sweep. Press [SETUP].
- Page 193 Common Functions (LCR Mode, ANALYZER Mode) 7.3.3 Setting the Beep Sound You can set the key operation sound. Press [SETUP]. Press [COMMON] tab. (Press [ADVANCED] tab for the ANALYZER mode.) Press [BEEP KEY]. Press [KEY]. Select the beep sound when a key is pressed. [OFF] A beep sound is not emitted when a key is pressed.
- Page 194 Common Functions (LCR Mode, ANALYZER Mode) 7.3.4 Display the Warm-up Message A message indicating the completion of the warm-up time is displayed. The message appears approximately 60 minutes after the power is switched on. Press [SETUP]. Press [COMMON] tab. (Press [ADVANCED] tab for the ANALYZER mode.) Press [WARM UP]. Select if the warm-up message has to be displayed or not.
- Page 195 Common Functions (LCR Mode, ANALYZER Mode) 7.3.5 Disabling Key Operation (Key-lock Function) The key-lock function includes the following two types. Select from these as required for the application. You can also set a passcode (security code). FULL key-lock Disables all setting changes. Enables the settings for comparator and BIN judgments, but disables SET key-lock other setting changes. • The key lock will not be enabled for [TRIG] in the case of an external trigger. (p. 33) •...
- Page 196 Common Functions (LCR Mode, ANALYZER Mode) Setting the passcode of the key-lock You can set a passcode necessary to cancel the key-lock. If a passcode is set, the passcode has to be entered to disable the key-lock. Take care not to forget the set passcode. Press [SETUP]. Press [COMMON] tab. Press [ADVANCED] tab for the ANALYZER mode. Press [KEYLOCK]. Press [PASSCODE]. Set the passcode with the numeric keypad and press [SET].
- Page 197 Common Functions (LCR Mode, ANALYZER Mode) Disabling the key-lock Perform a full reset to restore the instrument to the factory default settings if you forget the passcode. See “Full reset procedure” (p. 301). Press [UNLOCK] when the key-lock is enabled. When a passcode is set Enter the passcode and press [UNLOCK].
- Page 198 Common Functions (LCR Mode, ANALYZER Mode) In case of key-lock disable error Check the following items if the below error is displayed. Cause Solution [UNLOCK] was pressed Press [C], and enter the passcode. before you entered the passcode. The passcode entered is Press and enter the passcode again. incorrect.
- Page 199 Common Functions (LCR Mode, ANALYZER Mode) 7.3.6 Setting the Communication Measurement Data Type Setting of items for the measurement data to be acquired via communication. For more information, see the Communication Commands Instruction Manual. :MEASure:OUTPut:AUTO Set the measured value automatic output function ( command) (LCR only) Press [SETUP].
- Page 200 Common Functions (LCR Mode, ANALYZER Mode) Press [MEAS FORM]. Select the data transfer format. [ASCII] Transfers data in ASCII format. [REAL] Transfers data in binary format. Press [EXIT] to close the setting screen. :FORMat:LONG Set the long format for data transfer ( command) Press [SETUP]. Press [COMMON] tab.
- Page 201 Common Functions (LCR Mode, ANALYZER Mode) 7.3.7 Initializing the Instrument Initialization of the setting is performed as follows. Check “Instrument malfunction” (p. 297) if the instrument malfunctions. Perform a system reset to restore the instrument to its factory default settings if the cause is not known.
- Page 202 Common Functions (LCR Mode, ANALYZER Mode) Select reset ([ON])/no reset ([OFF]) for each item. See “Appx. 8 Initial Settings Table” (p. A15). Resets the item set with [SET] [SETUP]. Resets the item set with [ADJUST] [ADJUST]. Resets the item set with [COMMON]. (The configuration of the measurement mode is [COMMON] also reset.) Resets the item set with [FILE]...
- Page 203 External Input/Output Connector and Signals External Control The EXT I/O connector on the rear of the instrument can control the instrument by providing output of the end-of-measurement and comparator decision signals, as well as accepting input of measurement trigger and panel load signals. All signals are isolated by optocouplers. (Common connector (ISO_COM) is shared by input and output.) Check the input and output ratings, understand the safety precautions for connecting a control system, and use correctly.
- Page 204 External Input/Output Connector and Signals Connector type Rear Instrument connector: 37-pin D-sub female with #4-40 inch screws Mating connectors: • DC-37P-ULR (solder type) • DCSP-JB37PR (crimping type) Japan Aviation Electronics Industry Ltd. Signal pinouts (instrument) • LCR mode (p. 196) • ANALYZER mode (p. 198) • CONTINUOUS measurement mode (p. 202) The connector shell is connected (conductive) to the instrument case (metal) and the protective earth pin of the power supply inlet.
- Page 205 External Input/Output Connector and Signals Signal name Function Logic Common COMP ― ― ― • Outputs results obtained by applying an AND operation to the judgment results for measurement results of the four parameters. Level • Output if all the judgment results is IN (parameters not for considered for judgment are excluded). ― ― ― ― BIN7 Output if the BIN judgment result is BIN7. ― ― ― ― ― ―...
- Page 206 External Input/Output Connector and Signals ANALYZER mode Signal name Function Logic Common AREA PEAK ― ― ― ― TRIG External trigger (p. 203) Pos/ Edge (Unused) (Unused) ― ― ― Select panel No. (p. 203) Level ― ― ― Select panel No. (p. 203) Level ―...
- Page 207 External Input/Output Connector and Signals Signal name Function Logic Common AREA PEAK ― ― ― ― ― ― ― ― PARA3-IN AREA judgment result of the third parameter (Outputs if all the judgment results are IN.) ― ― ― ― ― ― ― ― 1 PARA4_IN PEAK judgment result of the fourth parameter (Outputs if all the judgment results are IN.) ― ― ― ― ― ― ― ― ― ― ― ―...
- Page 208 External Input/Output Connector and Signals Signal name Function Logic Common AREA PEAK ― ― ― ― ― ― ― ― PARA2-HI AREA judgment result of the second parameter (Outputs when any of the judgment is HI.) ― ― ― ― ― ― ― ― 1 PARA2_IN PEAK judgment result of the second parameter (Outputs if all the judgment results are IN.) ― ― ― ― ― ― ― ― ― ― ― 2 PARA2_LMAX_ PEAK judgment (local maximum value) result of ―...
- Page 209 External Input/Output Connector and Signals *1: PEAK output parameter switching ― ― ― ― C_P0 ― ― ― ― C_P1 Output PARA1, 2, 3, 4 PARA1, 2 PARA3, 4...
- Page 210 External Input/Output Connector and Signals CONTINUOUS measurement mode Signal name Function Logic Common COMP ― ― ― ― TRIG External trigger (p. 203) Pos/ Edge (Unused) (Unused) (Unused) Level (Unused) Level (Unused) Level (Unused) ― ― ― ― ― ― ISO_5V Isolated 5 V power output ―...
- Page 211 External Input/Output Connector and Signals Signal name Function Logic Common COMP ― ― ― ― ― ― ― ― PARA2-LO Outputs if the comparator judgment result of the second parameter Level is LO. ― ― ― ― ― ― ― ― PARA3-HI Outputs if the comparator judgment result of the third parameter is Level ― ― ― ― ― ―...
- Page 212 External Input/Output Connector and Signals ― ― ― ― ― ― ― ― LD-VALID Inputs a negative logic signal from an external device so that the selected panel No. is recognized as valid. ― ― ― ― ― ― ― ― ― After TRIG input, maintain a LOW level until INDEX is output.
- Page 213 Timing Chart 8.2 Timing Chart 8.2.1 LCR Mode If you set the judgment condition for the comparator (trigger setting is external trigger) and in that state if a trigger signal is input from the EXT I/O or [TRIG] is pressed in the screen, the judgment result is output from the signal line for comparator result output of the EXT I/O after measurement is completed. Furthermore, if the panel No. has been selected with the panel load signal when a trigger signal is input from the EXT I/O, measurement is performed after the measurement condition of that panel No. is loaded. Examples of the measurement timing: ―...
- Page 214 Timing Chart Timing chart interval descriptions Contents Time Item (Approximate) Trigger pulse width (LOW time) 2 μs or more Trigger response time 5 µs or more Measurement time (Measurement speed: FAST, during comparator judgment) 630 µs Minimum time from completion of measurement to next trigger 2 µs or more Time until analog measurement starts 6 µs Minimum chuck time (Measurement speed: FAST) 500 µs...
- Page 215 Timing Chart 8.2.2 ANALYZER Mode In ANALYZER mode, if a trigger signal is input from the EXT I/O or [TRIG] is pressed in the screen, the judgment results are output from the signal line for comparator result output of the EXT I/O. Furthermore, if the panel No. is selected with the panel load signal when a trigger signal is input from the EXT I/O,measurement is performed after the measurement condition of that panel No. is loaded. The following is a measurement timing example when the trigger setting is [SEQ] or [REPEAT].
- Page 216 Timing Chart ― ― ― ― ― ― ― ― • If the trigger setting is set to STEP, INDEX and EOM transition to LOW every time the measurement ― ― ― for each point is completed, and transitions to HIGH if there is trigger input. ERR also transitions to LOW each time measurement is completed if a measurement error occurs.
- Page 217 Timing Chart 8.2.3 CONTINUOUS Measurement Mode If a trigger signal input from EXT I/O or by touching on the screen in CONTINUOUS measurement mode, the judgment results will be output from the signal lines of EXT I/O comparator result output after measurement of all panel No.’s set to be executed on the screen. The following are examples for the measurement timing. In the timing example, the valid edge of the TRIG signal is set to falling (ON). Example: Continuous measurement using panel No. 1, 2, and 4 Chuck Release Chuck...
- Page 218 Timing Chart • In the continuous measurement screen, comparator result output signals other than AND and panel load signals (LD-VALID, LD0 to LD6) cannot be used. Refer to “Continuous Measurement Function” (p. 161) • Whether the comparator judgment results are reset when the signal changes to EOM (HIGH) or updated when measurement is completed, can be selected on the instrument or by a communication command.
- Page 219 Internal Circuit 8.3 Internal Circuit Input circuit PLC, etc. Internal isolation 5 V ISO_5 V Ω Ω Output ISO_COM Common ISO_COM Internal isolation common Do not connect any external power supply. Output circuit PLC, etc. Internal isolation 5 V ISO_5 V Input Zener voltage 30 V...
- Page 220 Internal Circuit Electrical specifications Input type Isolated, non-voltage contact input (compatible with current sink output, active-low) Input asserted (ON) 0.9 V or lower voltage Input de-asserted (OFF) Open or 5 V to 24 V Input Signals voltage Input asserted (ON) 3 mA/ch current Maximum applied 30 V voltage Output type Isolated npn open-collector output (current sink, active-low) Maximum load voltage 30 V Output Signal...
- Page 221 Internal Circuit Connection examples Input circuit connection examples: IM7580 IM7580 Input Input Connection with switch Connection with relay IM7580 IM7580 Common Input Output Input Output Common Connection with PLC output (negative common output) Connection with PLC output (positive common output)
- Page 222 External Control Q&A 8.4 External Control Q&A Common Questions Solution ― ― ― ― Short the TRIG input pin to an ISO_COM pin using a switch or an How do I connect an external trigger input? open-collector output. Which pins are the common ground for input ISO_COM pins. and output signals? Are the common (signal ground) pins shared Common ground pins can be shared by both inputs and outputs.
- Page 223 External Control I/O Settings 8.6 External Control I/O Settings 8.6.1 Enabling Trigger Input During Measurement (Trigger Enabled) You can select whether to enable or disable trigger input from the EXT I/O during measurement ― ― ― (during EOM (HI) output after trigger is received). Incorrect inputs due to chattering can be prevented by disabling trigger input during measurement. :IO:TRIGger:ENABle See LCR Application Disk - Communication Commands ( Press [SETUP].
- Page 224 External Control I/O Settings 8.6.2 Setting Valid Edge of Trigger Input (Trigger Edge) Either the rising edge or falling edge can be selected as the valid edge for trigger input from the EXT I/O. :IO:TRIGger:EDGe See LCR Application Disk - Communication Commands ( Press [SETUP]. Press [COMMON] tab. ([ADVANCED] tab for ANALYZER) Press...
- Page 225 External Control I/O Settings 8.6.3 Setting Reset of Judgment Results (Judgment Result Signal Reset) ― ― ― You can select whether to reset the judgment results when the signal changes to EOM (HIGH). :IO:RESult:RESET See LCR Application Disk - Communication Commands ( JUDGE RESET function: OFF ― ― ― ― TRIG ― ― ― (Judgment result Previous judgment result Judgment result output) ― ― ― JUDGE RESET function: ON ―...
- Page 226 External Control I/O Settings ― ― ― 8.6.4 Setting the EOM Output Method (EOM Mode) ― ― ― ― ― If the HIGH (OFF) time is too short due to the input circuit characteristics while receiving INDEX ― ― ― or EOM , the instrument can be configured to maintain the LOW (ON) state for a preset time once ―...
- Page 227 External Control I/O Settings (Set only if the output method has been set to PULSE in Step 2.) Set the output method to [PULSE] before setting the output time. Set the EOM output time for PULSE with / or the numeric keypad. (With the numeric keypad, press [SET].) Settable range 0.00001 s to 0.99999 s...
- Page 228 External Control I/O Settings 8.6.5 Setting Delay Time from Judgment Results Output until ― ― ― Output of EOM (LOW) (JUDGE-EOM) You can set a delay time between the judgment result output from the EXT I/O and the output of ― ― ― (LOW). :IO:OUTPut:DELay See LCR Application Disk - Communication Commands ( JUDGE EOM function: OFF JUDGE EOM function: ON ― ― ― ― ―...
- Page 229 External Control I/O Settings ― ― ― ― ― 8.6.6 S et a Delay for INDEX Signal Output (INDEX Delay) This instrument has a trigger synchronous output function called “4.2.4 Applying the Signal to the Sample during Measurement Only (Trigger Synchronous Output)” (p. 72). This function outputs the measurement signal output after the trigger input and applies the signal to the sample only during measurement. This function allows INDEX signal output after the measurement signal is completely OFF (0 V) (INDEX delay) after measurement.
- Page 230 External Control I/O Settings...
- Page 231 Saving and Loading Panel Information This section describes how to save data (measurement conditions and compensation values) to the instrument’s memory and how to subsequently load this data. [SAVE] (Saves data at the moment is pressed.) These operations are possible in both LCR mode and ANALYZER mode. Saving data Saves the measurement conditions and compensation values. (p. 224) (panel save function) Reading data Loads the measurement conditions and compensation values.
- Page 232 Saving Measurement Conditions (Panel Save Function) 9.1 Saving Measurement Conditions (Panel Save Function) Saves the measurement conditions and compensation values. Type Number of saves allowed LCR measurement condition Up to 30 ANALYZER measurement condition Up to 16 Saving measurement conditions Press [SETUP]. Press [COMMON] tab.
- Page 233 Saving Measurement Conditions (Panel Save Function) Press [SAVE TYPE]. Select the type to save. (ANALYZER consists of [SET + ADJ] only) [SET+ADJ] Saves both the measurement conditions and compensation values. [SET] Saves measurement conditions only. [ADJ] Saves measurement conditions and compensation values only.
- Page 234 Saving Measurement Conditions (Panel Save Function) Keyboard type [KEY TYPE] ...
- Page 235 Loading Measurement Conditions (Panel Load Function) 9.2 Loading Measurement Conditions (Panel Load Function) Loads measurement condition saved. Press [SETUP]. Press [COMMON] tab. ([ADVANCED] tab for ANALYZER) Press [PANEL]. Select a panel No. to be loaded with / or by scrolling. Display range: No.
- Page 236 Loading Measurement Conditions (Panel Load Function) Measurement screen is displayed automatically once the measurement conditions have been loaded.
- Page 237 Changing a Panel Name 9.3 Changing a Panel Name You can change the name of the panel saved in the instrument. Press [SETUP]. Press [COMMON] tab. ([ADVANCED] tab for ANALYZER) Press [PANEL]. Select a panel No. for its name to be changed with / or by scrolling. Press [RENAME]. Enter a new save name. [CLR] Deletes all input characters.
- Page 238 Deleting a Panel 9.4 Deleting a Panel You can delete a panel saved in the instrument. Press [SETUP]. Press [COMMON] tab. ([ADVANCED] tab for ANALYZER) Press [PANEL]. Select a panel No. to be deleted with / or by scrolling. [CANCEL] Use this key to cancel the setting. Press [DELETE]. Some of the information saved in the panel is displayed.
- Page 239 Setting the Interface Setting the SYSTEM 10.1 Setting the Interface You can control the instrument from a computer via the USB, LAN, GP-IB and RS-232C interfaces. GP-IB and RS-232C settings can be configured only if the optional Z3000 (GP-IB) or Z3001 (RS- 232C) is installed. Press [SYSTEM]. Press [I/F] tab. Usually only [UBS] [LAN] are displayed. Only Z3001 is installed Select the interface type. See the Communication Instruction Manual (LCR Application Disk) for more information on the settings. Only Z3000 is installed Press [EXIT]...
- Page 240 Checking the Instrument Version 10.2 Checking the Instrument Version Press [SYSTEM]. Press [INFO] tab. Displays the version of the instrument. Press [EXIT] to close the setting screen.
- Page 241 Perform panel compensation if it is not highlighted or (red) is displayed. There is a possibility of malfunction if there is an error after panel compensation. Contact your authorized Hioki distributor or reseller. Press [EXIT] to close the setting screen.
- Page 242 Press [TEST] tab. Press CALIBRATION of [EXEC]. Press center of until (green color) appears (2 points). Press [SET]. The instrument needs to be repaired if [SET] is not displayed. Contact your authorized Hioki distributor or reseller. [CANCEL] Cancels position compensation.
- Page 243 Pressing the screen will change the screen color in the order shown on the left. Green Blue The instrument has to be repaired if the entire screen color is not uniform. Contact your authorized Hioki distributor or reseller. Press [EXIT] to close the setting screen. Black White...
- Page 244 The instrument is restarted to conduct [YES] detailed RAM tests. [NO] Detailed RAM tests will not be executed. This instrument needs to be repaired if the overall judgment result displayed is [NG]. Contact your authorized Hioki distributor or reseller. Press [EXIT] to close the setting screen.
- Page 245 Self Checks (Self Diagnosis) 10.3.5 I/O Test Check if the output signal is output normally from the EXT I/O, and if the input signal is read normally. Press [SYSTEM]. Press [TEST] tab. Press [EXEC] I/O HANDLER TEST. To test output signal: Press the key with the name of the signal for which you want to check the output. To test input signal: The signal line name of the input signal being input (LOW) is displayed in the input signal test window.
- Page 246 Setting Date and Time 10.4 Setting Date and Time You can set the date and time of this instrument. Data is recorded and managed based on the set date and time. Press [SYSTEM]. Press [CLOCK] tab. Set the date and time with /. Settable range: 00:00:00, January 1, 2000, to 23:59:59, December 31, 2099 Press [SET] to complete. Press [EXIT] to close the setting screen.
- Page 247 Maximum 500 mA No. of ports Compatible USB device USB Mass Storage Class CAUTION • Hioki cannot recover or analyze data from damaged or faulty storage media. We cannot compensate for such data loss, regardless of the contents or cause of the failure or damage. We recommend you to make a backup of all important data in a computer or other devices. • When transporting this instrument, remove the USB flash drive. There is a possibility that this instrument or the media could be damaged. • Some USB flash drives are easily affected by static electricity. Handle the USB flash drive with care as there is a possibility of the drive getting damaged or the instrument malfunctioning due to static electricity.
- Page 248 Overview CAUTION • Avoid inserting the USB flash drive with the wrong orientation. This can damage the USB flash drive or instrument. • When a USB flash drive is being accessed, the color of the USB icon changes from blue to red. Do not turn off the power of the instrument while the USB flash drive is being accessed. Also, do not remove the USB flash drive from the instrument while it is being accessed. This may result in loss of data stored in the USB flash drive. Reference USB flash drives have limited usable lifetime. Data reading and writing will fail after long-term use. Replace the USB flash drive in this case.
- Page 249 Inserting and Removing USB Flash Drive 11.2 Inserting and Removing USB Flash Drive Front Inserting USB flash drive Insert the USB flash drive into the USB port on the front panel. • Do not insert an USB flash drive that is not compatible with Mass Storage Class. • Some commercially available USB flash drives are not compatible. • If an USB flash drive is not recognized, try using a different USB flash drive. Removing an USB flash drive Remove an USB after checking that the USB flash drive is not being accessed (saving, reading, etc.) by this instrument. A remove operation need not be performed in the instrument. Icon display when using USB When an USB flash drive has been recognized properly, the USB flash drive icon is displayed at the bottom of the measurement screen.
- Page 250 Screen Display When Using USB 11.3 Screen Display When Using USB The display is as follows when a USB flash drive is being used. You can configure settings such as save format, save destination, and text save format for the files. Screen File name File size File save date and time You can change the sorting order of files. The number of signs shows the sorting priority. Extension will be given priority for the sorting order of files with EXT. You can check the usage rate and type of file system of the USB flash drive. Filesystem File system type Total size Used...
- Page 251 Saving Data to USB Flash Drive 11.4 Saving Data to USB Flash Drive Pressing [SAVE] saves data as of that moment. L_NORM.png 11.4.1 Saving Measurement Result as Text Saves the measurement data to a USB flash drive in CSV format. File extension is “.CSV”. • When you save measurement data in ANALYZER mode as binary data, press [SAVE] on the file screen and select the data to be saved. to [SEQ]. • In case of ANALYZER mode, set [TRIG] A single sweep will not be stored because sweep will be repeated when [TRIG] is set to [REPEAT].
- Page 252 Settings: DATE: ON, SET: ON, PARA: ON, DELIM: “ , “ (comma), QUOTE: “ (double quotation mark) In case of LCR mode In case of CONTINUOUS measurement mode “HIOKI E.E. CORPORATION”,”IM7580”,”Ver. 1.00” “HIOKI E.E. CORPORATION”,”IM7580”,”Ver. 1.00” “Serial No. 123456789” “Serial No. 123456789”...
- Page 253 DATE (save time and date): ON, SET (measurement condition): ON, PARA (measurement parameter): ON, DELIM (delimiter): “ , “ (comma), QUOTE: “ (double quotation mark) Quotes ”,” Delimiter “HIOKI E.E. CORPORATION”,”IM7580”,”Ver. 1.00” Instrument information “Serial No. 123456789” “DATE”,”14-05-08” Save date and time “TIME”,”15:17:10”...
- Page 254 Saving Data to USB Flash Drive Insert the USB memory stick into the USB connector (at the front of the instrument). Press [FILE]. L_NORM.png Press [SETUP]. FILE.png Press [TEXT]. Enable setting for text save. [OFF] Disables the text file type. [ON] Saves measured values as text data. Select settings for header, delimiter, and quotation. [DATE] Turns the save date and time ON/OFF.
- Page 255 Saving Data to USB Flash Drive Press [SAVE] in the measurement screen. Measurement data is saved in the USB flash drive. • Auto save (default): Measurement data is saved. • For manual save: See “Setting Save Folder” (p. 256). FILE_USB_SAVE.png • Auto save (default setting) automatically creates a folder in the USB flash drive and saves the file in the folder. The folder name is created with the date and time of saving. Example: Saved on July 30, 2014 -> 20140730 •...
- Page 256 Does not record the save date and time. [ON] Records the save date and time. Press [EXIT] to close the setting screen. When ON When OFF “HIOKI E.E. CORPORATION”,”IM7580”,”Ver. 1.00” “HIOKI E.E. CORPORATION”,”IM7580”,”Ver. 1.00” “Serial No. 123456789” “Serial No. 123456789” “DATE”,”14-05-08” “TRIG”,”EXT” “TIME”,”15:17:10” “TRIG DELAY”,”0.00000”,”s”...
- Page 257 Measurement condition is not recorded. [ON] Measurement condition is recorded. Press [EXIT] to close the setting screen. When ON When OFF “HIOKI E.E. CORPORATION”,”IM7580”,”Ver. 1.00” “HIOKI E.E. CORPORATION”,”IM7580”,”Ver. 1.00” “Serial No. 123456789” “Serial No. 123456789” “DATE”,”14-05-08” “DATE”,”14-05-08” “TIME”,”15:17:10” “TIME”,”15:17:10” “TRIG”,”EXT”...
- Page 258 Measurement parameter is not recorded. [ON] Measurement parameter is recorded. Press [EXIT] to close the setting screen. When ON When OFF “HIOKI E.E. CORPORATION”,”IM7580”,”Ver. 1.00” “HIOKI E.E. CORPORATION”,”IM7580”,”Ver. 1.00” “Serial No. 123456789” “Serial No. 123456789” “DATE”,”14-05-08” “DATE”,”14-05-08” “TIME”,”15:17:10” “TIME”,”15:17:10” “TRIG”,”EXT”...
- Page 259 [SPACE] Sets the delimiter to a space. Press [EXIT] to close the setting screen. For comma For tab “HIOKI E.E. CORPORATION”,”IM7580”,”Ver. 1.00” “HIOKI E.E. CORPORATION” “IM7580” “Ver. 1.00” “Serial No. 123456789” “Serial No. 123456789” “DATE”,”14-05-08” “DATE” “14-05-08” “TIME”,”15:29:04” “TIME” “15:29:12”...
- Page 260 Sets quote to “ (double quotation mark). [‘] Sets quote to ‘ (single quotation mark). Press [EXIT] to close the setting screen. When OFF For double quotation mark HIOKI E.E. CORPORATION,IM7580,Ver. 1.00 “HIOKI E.E. CORPORATION”,”IM7580”,”Ver. 1.00” Serial No. 123456789 “Serial No. 123456789” DATE,14-05-08 “DATE”,”14-05-08” TIME,15:29:42 “TIME”,”15:29:50”...
- Page 261 Saving Data to USB Flash Drive Error measurement results When saved by memory function Measured values Comparator Upper portion: Text save and Error judgment judgment Measurement error memory function (short format), display Lower portion: Memory function Parameter Logical (long format) judgment product result MEAS ERR 999999E+28 Measurement error 9999999999E+28...
- Page 262 Saving Data to USB Flash Drive 11.4.2 Saving Measurement Screen (Screen Copy) You can save the screen currently displayed to the USB flash drive in bmp file format (full color or gray scale (black and white gray scale)). The file extension is “.BMP”. Example of BMP file: In case of LCR mode FILE_BMP_LCR_COLOR_WHITE.png FILE_BMP_LCR_MONO.png FILE_BMP_LCR_MONO_WHITE.png In case of ANALYZER mode FILE_BMP_ANA_COLOR_WHITE.png FILE_BMP_ANA_MONO.png FILE_BMP_ANA_MONO_WHITE.png In case of CONTINUOUS measurement mode FILE_BMP_CONT_COLOR_WHITE.png FILE_BMP_CONT_MONO.png FILE_BMP_CONT_MONO_WHITE.png •...
- Page 263 Saving Data to USB Flash Drive Insert the USB memory stick into the USB connector (at the front of the instrument). Press [FILE]. L_NORM.png Press [SETUP]. FILE.png Press [BMP]. Select save setting. [OFF] Disables the screen copy function. Saves a copy of the screen as a full color BMP [COLOR] file. Saves a copy of the screen as a gray scale [MONO] BMP file.
- Page 264 Saving Data to USB Flash Drive 11.4.3 Setting Save Folder Select the save destination for data. There are 2 types of save method: (1) Save to a folder automatically created ([AUTO]), (2) Save to a folder specified by the user ([MANUAL]). Insert the USB memory stick into the USB connector (at the front of the instrument). Press [FILE].
- Page 265 Saving Data to USB Flash Drive Press [SAVE] in the measurement screen. A copy of the screen is saved to the USB flash drive. • Auto save (default): Measurement data is saved. • For manual save: See “Setting Save Folder” (p. 256). FILE_USB_SAVE.png Folders that can be specified with [MANUAL] • are as follows: • Folders in the root* directory of the USB flash drive • Folders with their name assigned with single-characters only (folders containing double-byte characters such as Japanese cannot be specified) • Folders with 12 characters or less in their name •...
- Page 266 Saving Data to USB Flash Drive 11.4.4 Saving Memory Data You can save the measurement results stored in the internal memory of the instrument to a USB flash drive in CSV format. File extension is “.CSV”. Measurement results are saved in the following order: measuring instrument information, save time and date, and measured values. Measured values that will be stored depend on the settings of COM MEAS. The header (save time and date), delimiter, and quotation mark type of the text file can be configured. Measurement results stored in the internal memory of the instrument is deleted after they are saved in the USB flash drive.
- Page 267 Saving Instrument Settings to USB Flash Drive 11.5 Saving Instrument Settings to USB Flash Drive 11.5.1 Saving Instrument Settings Saves various setting information of this instrument as a setting file to the USB flash drive. The extension of the setting file is “.SET”. This function is useful to back up the setting state of this instrument. Refer to “Appx. 8 Initial Settings Table” (p. A15) for information on saved settings. Insert the USB memory stick into the USB connector (at the front of the instrument). Press [FILE].
- Page 268 Saving Instrument Settings to USB Flash Drive 11.5.2 Saving All Settings of Instrument (ALL SAVE Function) Saves various setting information of this instrument including the panel save information as a setting file to the USB flash drive. The extension of the setting file and panel save is “.PNL”. Refer to “Appx. 8 Initial Settings Table” (p. A15) for information on saved settings. Insert the USB memory stick into the USB connector (at the front of the instrument).
- Page 269 Loading Binary Data from USB Flash Drive 11.6 Loading Binary Data from USB Flash Drive 11.6.1 Loading Measurement Data (ANALYZER Function) This section describes how to load analyzer measurement data saved to the USB flash drive of this instrument and display it as a graph or use it to perform equivalent circuit analysis. See: “9 Saving and Loading Panel Information” (p. 223) “11.4 Saving Data to USB Flash Drive” (p. 243) When measurement data of analyzer measurement is loaded, instrument settings are changed to the setting at the time of measurement.
- Page 270 Loading Binary Data from USB Flash Drive 11.6.2 Loading Instrument Settings Reads a setting file or panel save file saved in the USB flash drive, and restores the settings. Insert the USB memory stick into the USB connector (at the front of the instrument). Press [FILE]. L_NORM.png Select the [SETTING] folder with / or by scrolling. Press [SELECT]. FILE_SELECT_SETTING.png Select a setting file or panel save file to be loaded with / or by scrolling. Press [LOAD].
- Page 271 Loading Binary Data from USB Flash Drive If the read confirmation screen is displayed If an error is displayed, the likely cause is one of the following. • The settings file is damaged. • Setting file is not a type that can be read by the instrument. FILE_ERROR.png...
- Page 272 Loading Binary Data from USB Flash Drive 11.6.3 Loading All Settings (ALL LOAD Function) Loads and restores instrument settings, including panels saved to USB memory using the ALL SAVE function. See “11.5.2 Saving All Settings of Instrument (ALL SAVE Function)” (p. 260). [LOAD] • Information currently saved in this instrument is deleted if is executed. • A beep will be sounded if the instrument is unable to load the settings file. Insert the USB memory stick into the USB connector (at the front of the instrument).
- Page 273 Editing Data Saved in USB Flash Drive 11.7 Editing Data Saved in USB Flash Drive You can edit files and folders saved in the USB flash drive. 11.7.1 Formatting a USB Flash Drive Perform this operation if the USB flash drive to be used is not formatted (initialized). Insert the USB flash drive to be formatted into the USB port (at the front panel) and start the format. This instrument formats drives with the FAT32 or FAT16 format. • When you format, all the data saved in the USB flash drive will be deleted and cannot be restored. Carefully check the contents before you perform a format. • We recommend backing up important data on a USB flash drive. Insert the USB memory stick into the USB connector (at the front of the instrument).
- Page 274 Editing Data Saved in USB Flash Drive Press [YES] on the confirmation screen. (This confirmation appears twice to prevent operational error.) Operations are not possible during formatting. The file list screen is refreshed on completion of screening.
- Page 275 Editing Data Saved in USB Flash Drive 11.7.2 Creating a Folder in USB Flash Drive Insert the USB memory stick into the USB connector (at the front of the instrument). Press [FILE]. L_NORM.png Press [PAGE1/2] and change to [PAGE2/2]. FILE_LOAD_ALL_LIST.png Press [FOLDER]. FILE_2.png Enter the folder name. Deletes all input characters.
- Page 276 Editing Data Saved in USB Flash Drive 11.7.3 Changing Folder Name or File Name in USB Flash Drive Insert the USB memory stick into the USB connector (at the front of the instrument). Press [FILE]. L_NORM.png Press [PAGE1/2] and change to [PAGE2/2]. FILE_LOAD_ALL_LIST.png Specify a folder or file to be changed. FILE_RENAME.png Press [RENAME]. Go to the next page.
- Page 277 Editing Data Saved in USB Flash Drive Enter a folder name or file name to be changed. Deletes all input characters. [CLR] [BS] Deletes the last character. [KEY TYPE] Changes the keyboard type. Switches between upper case and lower [A a] case characters. Switches between character and symbol. [! a] See “Keyboard type” (p. 226). Press [SET].
- Page 278 Editing Data Saved in USB Flash Drive 11.7.4 Deleting a File or Folder in USB Flash Drive You can delete a file or folder saved in the USB flash drive. A deleted file or folder cannot be restored once it is deleted. Insert the USB memory stick into the USB connector (at the front of the instrument). Press [FILE]. L_NORM.png Select a file or folder to be deleted with / or by scrolling. Press [PAGE1/2] and change to [PAGE2/2]. FILE_LOAD_ALL_LIST.png Press [DELETE].
- Page 279 Editing Data Saved in USB Flash Drive 11.7.5 Checking the Contents of Files You can check measurement data files (TXT, CSV) and screen copy files (BMP) on the screen that are saved in a USB flash drive. Insert the USB memory stick into the USB connector (at the front of the instrument). Press [FILE]. L_NORM.png Select a file with / or by scrolling. Press [VIEW]. [SELECT] is displayed and moves to inside the folder when a folder is selected.
- Page 280 Editing Data Saved in USB Flash Drive...
- Page 281 General Specifications Specifications 12.1 General Specifications (1) Basic Specification Measurement • LCR meter mode Measurement with single condition mode • Analyzer mode Sweep measurement, equivalent circuit analysis • CONTINUOUS Continuous measurement with saved conditions measurement mode Measurement Z (impedance), Y (admittance), θ (phase angle), Rs (equivalent series resistance, ESR), items Rp (equivalent parallel resistance), X (reactance), G (conductance), B (susceptance), Ls (equivalent series inductance), Lp (equivalent parallel inductance), Cs (equivalent series...
- Page 282 General Specifications Measurement Level range -40.0 dBm to +7.0 dBm signal level Setting 0.1 dB step resolution Accuracy ±2 dB (23°C±5°C) ±4 dB (0°C to 40°C) Setting method Ω Power (dBm) mode: Specified with the power of a 50 load connected to the measurement terminal. Range -40.0 dBm to +7.0 dBm Voltage (V) mode: Specified with the voltage during open connection with the measurement terminal. Range 4 mV to 1001 mV, with dBm notation guide Current (I) mode: Specified with the current during shorted connection with the measurement terminal. Range 0.09 mA to 20.02 mA, with dBm notation guide Monitor Monitor voltage functions Monitor range: 0.0 mV to 1000.0 mV (reference value) Monitor current Monitor range: 0.000 mA to 20.000 mA (reference value) Ω...
- Page 283 General Specifications (2) LCR function Measurement with single condition Average Method Internal trigger: Moving average External trigger: Arithmetic mean Setting range 1 to 256 (1 step) Trigger Internal Automatic trigger External Manual, communication commands, I/O trigger Trigger delay Delay time from trigger to measurement 0.00000 s to 9.99999 s (resolution: 10 µs) Trigger Applies measurement signal during analog measurement only.
- Page 284 General Specifications (3) Analyzer function Sweep measurement, equivalent circuit analysis Sweep Frequency, level (dBm, V, I) measurement Time interval Interval: 0.00000 s to 1000.00 s, max. 801 points measurement Sweep point 1 to 801 points Sweep method Regular sweep: Up to 801 points Settings: START-STOP/CENTER-SPAN/START-STEP/INTERVAL/CUSTOM Segment sweep: Up to 20 segments (total 801 points) •...
- Page 285 General Specifications Comparator Area comparator 4 parameters Hi/IN/Lo judgment across sweep range Judgment condition setting based on best product data available Upper lower limit -9.99999 G to +9.99999 G setting range Peak comparator 4 parameters Peak range judgment (local maximum and local minimum) Upper lower limit -9.99999 G to +9.99999 G setting range Range setting Full frequency range (for frequency sweep), full level range (for level sweep) Cursor function Reading measurement values on the graph screen...
- Page 286 General Specifications (4) Continuous measurement function Measurements are continued with measurement conditions saved. Up to 46 ways LCR mode: Up to 30 ways, ANALYZER mode: Up to 16 ways Continuous measurements with LCR mode mixed with ANALYZER mode is possible Judgment result from EXT.I/O has an overall judgment result and more than one output pattern. (5) Function Contact check 2-terminal contact check (DCR measurement) Performs a contact (contact state) check between High and Low. Judgment is allowed by entering upper and lower limit for DCR values. A function that aborts subsequent measurements when the judgment result is FAIL available.
- Page 287 General Specifications Parameter This function enables display colors to be changed for measurement values. color change function Absolute Absolute measurement value display function for measurement values (θ and ∆% excluded) measurement value display function Key-lock Can be enabled and disabled by front panel key operation. function Key lock is released by entering a passcode.
- Page 288 General Specifications (7) Interface Display 8.4-inch color TFT, touch panel Handler interface Connector 37-pin D-sub female with #4-40 inch screws (standard Input signals Isolated, non-voltage contact inputs equipment) Input asserted (ON) voltage: 0 V to 0.9 V Input de-asserted (OFF) voltage: OPEN or 5 V to 24 V Output signals Isolated npn open-collector outputs Maximum load voltage: 30 V Maximum output current: 50 mA/ch Residual voltage: 1 V or less (10 mA), 1.5 V or less (50 mA) Internal isolated Voltage: 4.5 V to 5 V power supply...
- Page 289 EN61326 Class A EN61000-3-2 EN61000-3-3 Safety EN61010 Dielectric Between the power wire and ground wire: 1.62 kV AC for 1 minute strength (9) Contents of product Contents of Instrument ×1 instrument Cable ×1 (IM7580: 1 m, IM7580-02: 2m) Test head ×1 Accessories See “Verifying Package Contents” (p. 1). Options See “Options (Sold separately)” (p. 2).
- Page 290 General Specifications Basic accuracy can be calculated with a computer. Basic accuracy can be calculated with the supplied application software. Measurement accuracy is displayed if the measurement conditions and measurement results are entered. This allows easy evaluation for accuracy of measurement values. See Hioki’s web site for additional information.
- Page 291 Measurement Accuracy 12.2 Measurement Accuracy 12.2.1 Impedance Measurement Accuracy guaranteed 0°C to 40°C (32°F to 104°F), 20% RH to 80% RH (no condensation) temperature and * 30°C (86°F) or more, wet-bulb temperature 27°C (80.6°F) or less humidity range However, within ±5°C (±9°F) of the calibration temperature. Calibration temperature Based on the operating temperature of calibration kit. range Guaranteed accuracy 1 year (Ensure open/short/load calibration are performed daily before period...
- Page 292 Measurement Accuracy Zsr: Power = between -7 dBm and +7 dBm FAST SLOW SLOW2 13.5 Zsr: Power = between -40 dBm and -7.1 dBm Zoff FAST SLOW SLOW2 (-0.048P + Zoff) 3 × 10 0.35 -0.15 P: Power setting value [dBm] 0 15 × F: Measurement frequency [MHz] 1000000 Yor: Power = between -7 dBm and +7 dBm FAST SLOW SLOW2 Yor: Power = between -40 dBm and -7.1 dBm Yoff FAST SLOW SLOW2 (-0.046P + Yoff) 3 × 10 -0.2 -0.4 P: Power setting value [dBm]...
- Page 293 Measurement Accuracy With the above, Zs is calculated as follows: Zs = 20 + Zsr + 0.5 × F = 20 + 3 × 10 + 0.5 × 50 (-0.048 × (-10) -0.15) = 51.41 Ω Obtain Yo. From measurement conditions and accuracy specification: (-0.046P + Yoff) Yor = 3 × 10 P = -10 (measurement signal level [dBm]) Yoff = -0.4 F = 50...
- Page 294 Measurement Accuracy Accuracy of inductor Ls = 150 nH Example: Measurement frequency = 100 MHz, measurement signal level=+1 dBm, measurement speed = FAST Z and θ of the sample are measured and we assume that the measurement values are as follows. Ω Z = 94.292 θ = 88.25° Obtain Ea. From measurement conditions and accuracy specification: Er = 0.09 Ea = 0.5 + Er = 0.59...
- Page 295 Measurement Accuracy With Ea and Eb, obtain accuracy of Z and θ. Z accuracy = ±(Ea + Eb) = ±1.18 θ accuracy = ±0.58 × (Ea + Eb) [°] = ±0.685 ° θ Calculate the possible range for Z and Zmin = 94.292 × (1 - 1.18/100 ) ≈ 93.179 Zmax = 94.292 ×...
- Page 296 Measurement Accuracy 12.2.3 DCR Measurement Accuracy guaranteed 0°C to 40°C (32°F to 104°F), 80% RH or less (no condensation) temperature and However, within ±5°C (±9°F) of the calibration temperature. humidity range Calibration temperature Based on the operating temperature of calibration kit. range Guaranteed accuracy 1 year (Ensure open/short/load calibration are performed daily before period measurement.) Warm-up time...
- Page 297 Measurement Accuracy 12.2.4 Conversion Table 10 pF 100 µH 1 pF 10 µH 1 µH 100 pF 100 nH 1 nF 10 nH 10 nF 0.1 nH 100 nF 0.01 nH 1 µF 100 m 10 M 100 M 300 M Measurement frequency (Hz)
- Page 298 Measurement Time 12.3 Measurement Time Measurement time differs depending on the measurement conditions. Refer to the following values. All the values are reference values. Note that they may differ depending on the operating environment. 12.3.1 LCR Mode Analog measurement signal (INDEX) Analog measurement time = A + B + C Measurement time (EOM) Measurement time = INDEX + D + E + F + G Analog measurement time FAST...
- Page 299 Measurement Time 12.3.2 Analyzer Mode Analog measurement signal (INDEX) Analog measurement time = (A + D + E) × Number of points + B + C Measurement time (EOM) Measurement time = INDEX + F + G + H + I Analog measurement time Tolerance ±0.1 ms Trigger synchronous output Trigger synchronous output wait time + INDEX delay time Contact check (DC measurement) 30 µs + 8 µs × Number of WAVEs + DC wait time + AC wait time Takes double the time if TIMING is BOTH. Point delay time Time required to switch setting MAX 50 µs ANALYZER calculation time MAX 200 µs Trigger delay time JUDGE-EOM delay time Equivalent circuit analysis MAX 25 ms...
- Page 300 Measurement Time...
- Page 301 • If damage is suspected, check the section “Instrument malfunction” (p. 297) before contacting your authorized Hioki distributor or reseller. However, in the following cases, immediately stop using the instrument, unplug the power cord and contact your authorized Hioki distributor or reseller.
- Page 302 To ensure the product can be used over the long term, it is recommended to replace these parts on a periodic basis. When replacing parts, please contact your authorized Hioki distributor or reseller. The service life of parts varies with the operating environment and frequency of use. Parts are not guaranteed to operate throughout the recommended replacement cycle.
- Page 303 Disposal 13.2 Disposal This instrument contains a built-in backup lithium battery for the clock, etc. When disposing of this instrument, remove the lithium battery and dispose of battery and instrument in accordance with local regulations. WARNING To avoid electric shock, turn off the power switch and disconnect the power cord and probes or fixture before removing the lithium battery. Battery may explode if mistreated. Do not short-circuit, recharge, disassemble or dispose of in fire. Keep batteries away from children to prevent accidental swallowing. CAUTION •...
- Page 304 Disposal Remove two screws at the top to detach the handle. Remove six screws at the rear to detach the upper and lower cases. Remove six screws at the side of front panel. Pull the front panel to the front. Remove the battery from the printed circuit board at the back of the display.
- Page 305 Troubleshooting 13.3 Troubleshooting For more information about external control, see “8 External Control” (p. 195). Instrument malfunction Symptoms Check item or cause Solution/Reference • Is the power supply cord disconnected? The screen is not displayed Confirm that the power cord is connected even if the power supply is •...
- Page 306 Troubleshooting Symptoms Check item or cause Solution/Reference Change the signal level setting. Is the signal level setting too low? (LCR: p. 38, ANALYZER: p. 89) Check the item indicated by the error display, address the cause, and perform measurement. • If REF VAL is being displayed, check measurement conditions such as the Is an error from “13.4 Error Display”...
- Page 307 Troubleshooting Symptoms Check item or cause Solution/Reference Check the item indicated by the error Is an error from “13.4 Error Display” display, address the cause, and perform (p. 303) being displayed? measurement. Proper contact is not established with Does the measurement value for an the sample.
- Page 308 Troubleshooting Symptoms Check item or cause Solution/Reference If you are using the instrument in a high- noise environment, consider taking the following measures: • Install guards. • Separate the sample, measurement cables, and instrument from the Open/short/load calibration source of the noise (motor, inverter, Are you using the instrument in a high- or open/short compensation electromagnetic switch, power line, noise environment? has an error.
- Page 309 Particularly when the sample is a battery, failure to do so may damage the instrument or battery. • If the instrument still does not operate normally after the full reset, it needs to be repaired. Contact your dealer, or a Hioki representative if you are not sure where the instrument was purchased. Rear Connect the power cable.
- Page 310 Troubleshooting Select yes/no for full reset. Reset all Settings. Perform a full reset. Exit. Full reset is not performed.
- Page 311 Check if the measurement cable has been disconnected or connected incorrectly. MEAS ERR If an error is still displayed, the instrument Measurement error. may be damaged. Contact your authorized Hioki distributor or reseller. DISP OUT Measurement value is outside the Check the display range. display range.
- Page 312 Error Display Error display Description Solution/Reference File error. Use a different type of USB flash drive or An error is occurred during file backup existing files in the USB flash drive processing. and format the drive before use. Calibration is invalid. UNCAL Perform calibration. Not calibrated or calibration has “5 Calibration and Compensation” become invalid due to a change in (p.
- Page 313 Appendix Appx. 1 Measurement Parameters and Calculation Formula In general, impedance is used to evaluate the characteristics of circuit components. This instrument measures the voltage and current vectors of circuit components for AC measurement frequency signals and uses these values to determine the impedance and phase θ...
- Page 314 Measurement Parameters and Calculation Formula The instrument uses following calculation formulas to calculate each item. θ The phase angle is shown with impedance as reference. When measuring with the θ admittance as reference, the sign of the phase angle of the impedance will be reversed. : Indicates the measured values of in series equivalent circuit mode.
- Page 315 Countermeasures to Prevent Entry of External Noise Appx. 2 Countermeasures to Prevent Entry of External Noise This instrument has been designed not to malfunction even when there is entry of noise due to the measurement cables and the power supply line. However, measurement errors or malfunctions can result in case of significantly high levels of interference.
- Page 316 Series Equivalent Circuit Mode and Parallel Equivalent Circuit Mode Appx. 3 Series Equivalent Circuit Mode and Parallel Equivalent Circuit Mode The instrument measures the current flowing to the test sample and the voltage at both ends of Ω the test sample, and determines Z and . Other measurement items such as L, C, and R are Ω calculated from Z and . At this time, the calculation mode is series equivalent circuit mode if the resistance components for C (or L) are assumed to be in series, and the mode is parallel equivalent circuit mode if the resistance components for C (or L) are assumed to be in parallel.
- Page 317 Selecting the Equivalent Circuit Model Appx. 4 Selecting the Equivalent Circuit Model When using the equivalent circuit function, it is important to select an appropriate equivalent circuit model. The following table provides examples of measuring objects and equivalent circuit models using circuit element Model A to Model E. Corresponding equivalent Measuring object circuit model Inductor with high core loss and low ESR Inductor Comparatively high ESR Significant leak resistance effect Capacitor Typical capacitor...
- Page 318 Maintenance of Coaxial Connector Appx. 5 Maintenance of Coaxial Connector Because the coaxial connector is highly accurate, reproducibility will deteriorate even in case of small bends, damages and dust etc. Connecting a coaxial connector with dust or defects may damage the connector of the instrument. Do not use a coaxial connector with defects. Before measurement, visually inspect the connector to make sure that the coaxial connector is not defective.
- Page 319 If a rack mounting plate of the same shape as the JIS rack base described in p. A8 is used, do not use the screws removed from the legs, and fasten the instrument with flat countersunk head screws of M3 × 6 mm to 10 mm from the bottom of the plate. • If screws have been lost or damaged, contact your authorized Hioki distributor or reseller.
- Page 320 Rack Mounting Plate dimension Rack mounting base (JIS) Cold-reduced carbon steel sheet t2.0 8×R3 4×M3 countersinking (Units: mm)
- Page 321 Rack Mounting 4× Rack mounting base (EIA) Cold-reduced carbon steel sheet t1.6 436.8 420.8 9×M4 press nut (convex rear face) 4×R3.5 420.4 481.2 Rack mounting panel (EIA) SPCC t3.0 4×R3.5 9×M4 countersinking 436.8 (Units: mm) 482.6...
- Page 322 Rack Mounting Installation procedure When installing into a rack, reinforce the installation with a commercially available support stand. Bottom panel Verify that the power supply is switched OFF, and remove the connection cables and the power supply cord. Remove the screws fastening the four legs at the bottom of the instrument. Remove the two screws at the top of the instrument to detach the handle.
- Page 323 Rack Mounting Install the spacers on both sides of the instrument, affix the rack mounting plate with the screws removed from the legs (M3 × 10 mm). Bottom panel Verify that the power supply is switched OFF, and remove the connection cables and the power supply cord. Remove the screws fastening the four legs at the bottom of the instrument.
- Page 324 Rack Mounting Slide the unit into the rack from the front of the rack mounting plate. Use the screws removed from the legs (M3 × 10 mm) and the corresponding screw holes to fasten the instrument. (For example, place the instrument on a storage rack and fasten it from the back of the rack with screws.) If the plate thickness of the storage...
- Page 325 Dimensional Diagram Appx. 7 Dimensional Diagram Instrument 268 ±3 ±1 178 ±0.5...
- Page 326 Dimensional Diagram Test head 2×M3 Effective depth 6 61 ±1 11.8 57.9 ±1 40 ±0.2 2×M4 Effective depth 5...
- Page 327 Initial Settings Table Appx. 8 Initial Settings Table...
- Page 328 Initial Settings Table...
- Page 329 Initial Settings Table...
- Page 330 Initial Settings Table...
- Page 331 Initial Settings Table...
- Page 332 Device Compliance Statement Appx. 9 Device Compliance Statement “Information on compliance to standards” based on the IEEE 488.2 standard Item Contents IEEE 488.1 interface functions See Communication user manual in the included LCR Application Disc, “GP-IB specifications”. Operation with address other than 0 to 30 Such settings are not possible.
- Page 333 Device Compliance Statement Item Contents :GRAPh:VERTical:CENTerdiv?.... 2 :GRAPh:VERTical:UPPerlower?... 2 :LIST:STARt:STOP?..... 3 :LIST:STARt:STEP?..... 3 :LIST:CENTerspan?..... 3 :LIST:INTerval?....... 3 :MEASure?......*2 :MEASure:RDC?......*2 :MEASure:COMParator:PEAK:LMAX? ..3 :MEASure:COMParator:PEAK:LMIN? ..3 :MEASure:CURSor? ..... 3 :MEASure:POINt?....... 3 :MEASure:ANALysis:COMParator? ..6 :MEASure:ANALysis:DELTa? ..... 5 :MEASure:ANALysis:PEAK?....2 :MEASure:ANALysis:SIMulation?..
- Page 334 Device Compliance Statement Item Contents Response capacity for block data Block data does not appear in responses. List of standard commands and queries used See included LCR Application Disk. * CAL? Device state after the calibration query has been “ ” command is not used. completed successfully * DDT * DDT Existence/nonexistence of “...
- Page 335 Index Adding segments ............85 INDEX delay ............. 72 Adding sweep points ..........83 Internal trigger ............41 Analysis method ............. 126 INTVL MEAS ............79 Analysis results display position ......131 Analyzer function ............61 Area judgment ............116 Arithmetic mean............41 Judging analysis results .........
- Page 336 Index Segment ..............76 SEGMENT ..............76 Segment interval sweep ........... 85 Segment span mode ..........95 Segments to analyze ..........128 Segment sweep ............85 Sequential sweep ............. 70 Simulation ............... 135 Single span mode ............. 95 Span ................. 95 START-STEP ............
- Page 337 13-09...
Need help?
Do you have a question about the IM7580 and is the answer not in the manual?
Questions and answers