Tektronix 5 series Printable Help
Hide thumbs
Also See for 5 series:
- Installation and safety manual (232 pages) ,
- Quick start user manual (143 pages) ,
- Declassification and security instructions (23 pages)

Related Manuals for Tektronix 5 series


Summary of Contents for Tektronix 5 series
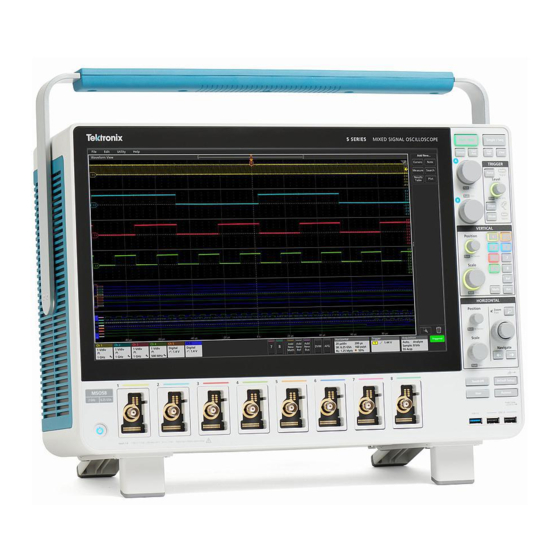
- Page 1 5 Series MSO and 6 Series MSO (MSO54, MSO56, MSO58, MSO58LP, MSO64) Printable Help Supports Product Firmware V1.8.x *P076040303* 076040303...
- Page 2 Tektronix. All rights reserved. Licensed software products are owned by Tektronix or its subsidiaries or suppliers, and are protected by national copyright laws and international treaty provisions. Tektronix products are covered by U.S. and foreign patents, issued and pending. Information in this publication supersedes that in all previously published material. Specifications and price change privileges reserved.
-
Page 3: Table Of Contents
Table of Contents TEKTRONIX SOFTWARE LICENSE AGREEMENT ..................Welcome to the instrument help ........................xvii Product documents and support Related documents ............................Product support and feedback ........................Accessories Standard accessories ............................. Recommended accessories ........................... Recommended probes ........................... Options Bandwidth options ............................ - Page 4 Table of Contents Installing and activating Windows 10 option ....................Install the Windows SSD drive ....................... Powering on Windows for the first time ....................Activating Windows ..........................Differences between Windows and base instrument user interfaces ............. Updating the Windows TekScope application software .................
- Page 5 Table of Contents Remote access to a Windows 10 instrument ....................Install TightVNC on the Windows 10 instrument ..................Install TightVNC on a PC ........................Deskew analog input channels - quick visual method .................. Deskew analog input channels - measurement method ................
- Page 6 Table of Contents Using Default Setup ........................... Using Fast Acq ............................Add a note to a view ........................... Delete a Note ............................. Acquiring digital signals Connect and set up digital signals ......................Add a serial bus to the Waveform view ......................
- Page 7 Table of Contents Set measurement gates ..........................Set measurement filters ..........................Set measurement limits ..........................Saving and recalling information Save a screen image ..........................Save a waveform to a file ........................... Save instrument settings to a file ....................... Save reports ...............................
- Page 8 Table of Contents Power Autoset button ........................... Power sequence setup button ......................SOA Mask definition controls and fields ....................Save Mask menu (SOA power measurement) ..................Recall Mask menu (SOA power measurement) ................... Reference Levels panel (Power measurement configuration Menu) ...........
- Page 9 Table of Contents CAN serial bus search configuration menu ..................Ethernet serial bus search configuration menu ..................FlexRay serial bus search configuration menu ..................I2C serial bus search configuration menu .................... LIN serial bus search configuration menu .................... MIL-STD-1553 serial bus search configuration menu ................
- Page 10 Table of Contents File Utilities configuration (File menu) ....................Mount Network Drive configuration menu .................... Undo, Redo (Edit menu) ........................Application (Menu bar) ......................... User Preferences (Utility menu) ......................I/O (Utility menu) ..........................LAN Reset configuration menu (Utility > I/O menu) ................
- Page 11 Table of Contents XYZ plot configuration menu ........................ Harmonics Bar Graph plot configuration menu (optional) ..............Inductance Curve configuration menu (Magnetic Analysis power measurement) (optional) ....BH Curve configuration menu (Magnetic Analysis power measurement) (optional) ......I vs (integral of) V plot configuration menu (Magnetic Analysis power measurement) (optional) ..
- Page 12 Table of Contents Setup and Hold Trigger - Define Inputs configuration menu ..............Timeout Trigger configuration menu ....................Logic Qualification - Define Inputs configuration menu ................ Window Trigger configuration menu ..................... Visual Trigger panel ..........................Virtual Keyboard ............................Bus trigger radix-specific virtual keypads ....................
- Page 13 Table of Contents Trigger position in waveform record ......................Trigger delay .............................. Advanced triggering ........................... Bus triggering concepts ........................Pulse width trigger concepts ........................ Timeout trigger ............................. Runt trigger ............................Window trigger ............................. Logic trigger concepts .......................... Setup and Hold trigger concepts ......................
- Page 14 Table of Contents Rectangular window ........................... Tek-Exponential window ..........................Measurement algorithms Amplitude measurement algorithms ......................AC RMS measurement algorithm ......................Area measurement algorithm ....................... Amplitude measurement algorithm ....................... Base measurement algorithm ......................Integration algorithm ..........................Maximum measurement algorithm ....................... Mean measurement algorithm ......................
- Page 15 Table of Contents Time Outside Level measurement algorithm ..................Unit Interval measurement algorithm ....................Jitter measurement algorithms ........................AC Common Mode ..........................Bit Amplitude measurement algorithm ....................Bit High measurement algorithm ......................Bit Low measurement algorithm ......................DC Common Mode measurement algorithm ..................
- Page 16 Table of Contents Power measurement algorithms ........................ Input analysis algorithms ........................Amplitude analysis measurement algorithms ..................Timing analysis measurement algorithms .................... Switching analysis algorithms ......................Magnetic Analysis algorithms ....................... Output analysis algorithms ........................References Power badge error and warning messages (optional) ................
- Page 17 2. Transfer the Program to any person or organization outside of Customer or the corporation of which Customer is a part without the prior written consent of Tektronix, except in connection with the transfer of the equipment within which the programs are encoded or incorporated;...
- Page 18 Tektronix or any third party from whom Tektronix may have obtained a respective licensing right if Customer fails to comply with any term or condition and such failure is not remedied within thirty (30) days after notice hereof from Tektronix or such third party.
-
Page 19: Welcome To The Instrument Help
Welcome to the instrument help ® This oscilloscope provides FlexChannel technology, enabling you to efficiently and cost-effectively perform mixed signal debugging on virtually any design. MSO54, MSO56, MSO58 Key features and benefits Bandwidths from 350 MHz to 2 GHz ■ ®... - Page 20 ■ automotive, computer, and embedded serial buses. See the Serial bus and trigger options topic in the instrument embedded Help, or the 6 Series MSO Serial Triggering and Analysis Applications Datasheet (Tektronix part number 48W-61353-x) for more information 5 Series, 6 Series MSO Help, Version 20180607-17:00 for Firmware v1.8.x.
-
Page 21: Product Documents And Support
English, Japanese, and Simplified Chinese languages. A Russian language version is available to download from the Tektronix web site (Tektronix part number 077-1361-xx) 5 Series and 6 Series MSO Help (Tektronix part number 077-1303-xx; Printable version of the instrument Help that contains context-sensitive descriptions of all instrument functions; available at www.tek.com/downloads) - Page 22 Japanese, and Simplified Chinese languages. A Russian language version is available to download from the Tektronix web site (Tektronix part number 077-1404-xx) 5 Series and 6 Series MSO Help (Tektronix part number 077-1303-xx; Printable version of the instrument Help; available at www.tektronix.com/downloads) How to remotely control the 5 Series and 6 Series MSO Programmer Manual (Tektronix part number 077-1305-xx;...
-
Page 23: Product Support And Feedback
Product documents and support Product support and feedback Tektronix values your feedback on our products. To help us serve you better, please send us your suggestions, ideas, or comments on your instrument, application, or product documentation. Contact through mail, telephone, or the Web site. See... - Page 24 Product documents and support MSO54, MSO56, MSO58, MSO58LP, MSO64 Help...
-
Page 25: Accessories
Standard accessories MSO54, MSO56, MSO58 standard accessories Item Quantity Tektronix part number 5 Series MSO (MSO54, MSO56, MSO58) Installation and Safety Manual 071-3514-xx TPP0500B Passive Voltage Probe (500 MHz bandwidth). Shipped with One per channel TPP0500B 350 MHz and 500 MHz models. -
Page 26: Recommended Accessories
5 Series MSO MSO58LP Service Manual as a PDF file, download from the Tektronix Web site 077-1405-xx 5 Series and 6 Series MSO Programmer Interface Manual as a PDF file, download from the... -
Page 27: Recommended Probes
Hard transit case 6 Series MSO (MSO64) Service Manual as a PDF file, download from the Tektronix Web site 077-1462-xx 5 Series and 6 Series MSO Programmer Interface Manual as a PDF file, download from the 077-1305-xx Tektronix Web site... - Page 28 Accessories Probe model Description TIVM1 ±50 V, 1GHZ IsoVu probe 3 m TIVM1L ±50 V, 1GHZ IsoVu probe 10 m TPP0500B 300 V, 500 MHz 10X passive probe TPP1000 300 V, 1 GHz 10X passive probe TRCP0300 Rogowski current probe, 9 Hz to 30 MHz, 250 mA to 300 A peak TRCP0600 Rogowski current probe, 12 Hz to 3 MHz, 500 mA to 600 A peak TRCP3000...
-
Page 29: Options
Bandwidth options These options let you upgrade a purchased oscilloscope to a higher bandwidth. There are no bandwidth options for the 5 Series MSO MSO58LP Low Profile instrument. Bandwidth upgrade options These options can be ordered for already-purchased oscilloscopes. Some upgrades require sending the oscilloscope to a service center to replace hardware and recalibrate the instrument. - Page 30 Bandwidth upgrade from 1 GHz to 2.5GHz on 4- A license file to upgrade your oscilloscope will be channel models. placed in your Tektronix AMS account. An email notification will be sent to your registered mail SUP6-BW10T404 Bandwidth upgrade from 1 GHz to 4 GHz on 4- account.
-
Page 31: Record Length Options
These options let you upgrade a purchased oscilloscope to increase the record length memory. Increased record length memory lets you capture and analyze more waveform data points. NOTE. Record length options are not available for the 5 Series MSO Low Profile (MSO58LP). Table 3: 5 Series options... -
Page 32: Microsoft Windows 10 Operating System Option
The option license can only be installed on the oscilloscope for which it was purchased. Microsoft Windows 10 operating system option These options add the Microsoft Windows 10 operating system to your oscilloscope. This option is not available for the 5 Series MSO Low Profile (MSO58LP). -
Page 33: Arbitrary Function Generator (Afg) (Optional)
Adds arbitrary and function generation capability to your instrument. A license file to upgrade your oscilloscope will be placed in your Tektronix AMS account. An email notification will be sent to your registered mail account. Install the license file to enable the option features. -
Page 34: Enhanced Instrument Security (Factory Option)
Options Enhanced instrument security (factory option) Advanced instrument security option provides the highest level of instrument security. This option configures the oscilloscope hardware to easily declassify the oscilloscope. This option must be ordered at the same time you order an instrument. Enhanced instrument security preinstalled option This option preinstalls this feature when ordering the oscilloscope. -
Page 35: Tektronix Software License Agreement
Aerospace serial triggering and analysis (ARINC A license file to upgrade your oscilloscope will be SUP6-SRAERO 429, MIL-STD-1553) placed in your Tektronix AMS account. An email notification will be sent to your registered mail SUP5-SRAUDIO or Audio serial triggering and analysis (I S, LJ, RJ, account. -
Page 36: Advanced Jitter Analysis Option
Height, Eye Width, Eye High and Low, Q-Factor, Differential Crossover, T/nT Ratio, SSC Frequency deviation, SSC Modulation Rate, and more. A license file to upgrade your oscilloscope will be placed in your Tektronix AMS account. An email notification will be sent to your registered mail account. Install the license file to enable the option features. -
Page 37: Power Cord Options
Options Power cord options These options let you order the oscilloscope with a country- or region-specific power cord. Power cord options These options are ordered when ordering the oscilloscope. Option name Description North America Power Cord Universal EURO Power Cord United Kingdom Power Cord Australia Power Cord Switzerland Power Cord... -
Page 38: How To Install An Option License
Prerequisites: A license file for each option. Contact Tektronix Customer Service to purchase and obtain option license file(s). Node ■ Locked option licenses are specific to the oscilloscope serial number, and cannot be used on other oscilloscopes. Floating licenses can be used on any instrument, but can only be checked out to one instrument at a time. - Page 39 Options Tap Open. The oscilloscope enables the option license and returns to the About screen. Verify that the installed option license is in the list. Power cycle the oscilloscope before taking any measurements. To uninstall (return) a license, see How to uninstall (return) an option license on page 20.
-
Page 40: How To Uninstall (Return) An Option License
Floating licenses can be used on any compatible instrument, but can only be checked out to use on one instrument at a time. This process removes the option license from the instrument so that you can check (return) it back into the Tektronix TekAMS system. - Page 41 From a PC with the license file USB memory device attached, or from a browser on an instrument connected to the internet, access the Tektronix AMS Web site. The site path was provided when you purchased the license and created a Tektronix AMS account.
- Page 42 Options MSO54, MSO56, MSO58, MSO58LP, MSO64 Help...
-
Page 43: Install Your Instrument
Install your instrument Check shipped accessories Make sure that you received everything you ordered. If anything is missing, contact Tektronix Customer Support. In North America, call 1-800-833-9200. Worldwide, visit www.tek.com to find contacts in your area. Check the packing list that came with your instrument to verify that you have received all standard accessories and ordered items. -
Page 44: Safely Rotate The Handle
Install your instrument MSO64 standard accessories Item Quantity Tektronix part number Installation and Safety Manual 071-3579-xx TPP1000 Passive Voltage Probe (1 GHz bandwidth). One per channel TPP1000 Front cover 200-5406-xx Accessory pouch (attached to front cover) 016-2106-xx Mouse (wired with USB connector) -
Page 45: Operating Requirements
Install your instrument Operating requirements Use the oscilloscope within the required operating temperature, power, altitude, and signal input voltage ranges to provide the most accurate measurements and safe instrument operation. Environment requirements Characteristic Description Operating temperature 0 °C to +50 °C (+32 °F to +122 °F) For proper cooling, keep the sides and rear of the instrument clear of obstructions for 2 inches (51 mm). -
Page 46: Powering The Oscilloscope
Install your instrument Powering the oscilloscope Use this procedure to connect the oscilloscope to line power and power on and off the oscilloscope. Always connect the oscilloscope to AC power using the power cord that shipped with the instrument. Prerequisite: Use the AC power cord that shipped with your oscilloscope. Connect the supplied power cord to the oscilloscope power connector. -
Page 47: Check That Oscilloscope Passes Power-On Self Tests
If one or more power-on self tests shows Failed: Power cycle the oscilloscope. Tap Utility > Self Test. If one or more power-on self tests still shows Failed, contact Tektronix Customer Support. Installing and activating Windows 10 option Use the following instructions to install the Microsoft Windows 10 solid state drive (upgrade installed after purchasing the instrument) and activate Windows 10 on the instrument. - Page 48 Install your instrument Remove the SSD drive cover from the bottom of the oscilloscope as shown. Slide the connector end of the SSD into the drive connector bracket. Push firmly to seat the drive in the connector. Push down on and tighten the thumb screw to attach the SSD drive to the chassis. Reinstall the SSD drive cover on the bottom of the instrument.
-
Page 49: Powering On Windows For The First Time
Activating Windows Activating Windows. The Windows operating system shipped from Tektronix is in a "deferred activation" state. The first time you power on an instrument with a newly installed Windows drive, the operating system may attempt to activate itself, depending on whether the instrument is connected to a network. -
Page 50: Differences Between Windows And Base Instrument User Interfaces
Install your instrument Verifying Windows activation. To check that Windows is activated: Tap Start on the Windows taskbar. Scroll down and tap Settings. Tap Update & Security. Tap Activation (left side list) to display the activation status. Windows update. Automatic Windows update is disabled by default. Differences between Windows and base instrument user interfaces The Windows-based oscilloscope application interface appearance and behavior is exactly the same as the base instruments, with some exceptions:... -
Page 51: Secure (Lock) The Oscilloscope
Install your instrument Open the USB drive location. Double-tap on the installation file to update the application software; follow any on-screen instructions. Secure (lock) the oscilloscope Lock an oscilloscope to a test bench or equipment rack to prevent property loss. Attach a standard laptop security lock to the rear panel of the oscilloscope, to secure the oscilloscope to a workbench, rack, or other location. - Page 52 Install your instrument Figure 5: Connecting probes to the MSO58LP Figure 6: Connecting probes to the MSO6 Series MSO54, MSO56, MSO58, MSO58LP, MSO64 Help...
-
Page 53: Rackmount Information
5 Series MSO MSO58LP Installation and Safety Manual to install the instrument in a rack. To use an MSO58LP on a bench, purchase and install the 5 Series MSO MSO58LP Benchtop Conversion kit (Tektronix part number 020-3180-xx). The kit includes chassis feet and a handle, and lets you stack instruments on a bench. - Page 54 Install your instrument MSO54, MSO56, MSO58, MSO58LP, MSO64 Help...
-
Page 55: Getting Acquainted With Your Instrument
The front panel controls provide direct access to key instrument settings such as vertical, horizontal, trigger, cursors, and zoom. The connectors are where you input signals with probes or cables, or insert USB devices. Figure 7: 5 Series MSO controls MSO54, MSO56, MSO58, MSO58LP, MSO64 Help... - Page 56 Getting acquainted with your instrument Figure 8: 6 Series MSO controls Acquisition and Cursors controls: ■ Run/Stop starts and stops waveform acquisition. The button color indicates the acquisition status (green = running and acquiring; red = stopped). When stopped, the oscilloscope shows waveforms from the last completed acquisition. The Run/Stop button on the screen also shows the acquisition status.
- Page 57 Getting acquainted with your instrument ■ High Res applies unique finite impulse response (FIR) filters based on the current sample rate. This FIR filter maintains the maximum bandwidth possible for that sample rate while rejecting aliasing. The filter removes noise from the oscilloscope amplifiers and ADC above the usable bandwidth for the selected sample rate.
- Page 58 Getting acquainted with your instrument Trigger controls: ■ Force forces a trigger event at a random point in the waveform and captures the acquisition. ■ Level sets the amplitude level that the signal must pass through to be considered a valid transition. The color of the Level knob indicates the trigger source except for dual-level triggers.
- Page 59 Getting acquainted with your instrument Vertical controls: ■ Position moves the selected waveform (Channel, Math, Reference, Bus) and its graticule up or down on the screen. The color of the Position knob indicates which waveform the knob is controlling. Push the knob to set the threshold level to 50% of the peak-to-peak amplitude range of the signal.
- Page 60 Getting acquainted with your instrument Horizontal controls: ■ Position moves the waveform and graticule side to side on the screen (changing the trigger point position in the waveform record). Push the knob to center the trigger event to the center graticule on the Waveform view. ■...
- Page 61 Getting acquainted with your instrument Miscellaneous controls: ■ Touch Off turns touch screen capability off. The Touch Off button is lighted when the touch screen is turned off. ■ Save is a one-push save operation that uses the current File > Save As settings to save screen shots (including open menus and dialog boxes), waveform files, instrument settings, and so on, as follows: ■...
- Page 62 Getting acquainted with your instrument USB Host ports (USB 3.0 and 2.0): ■ USB ports are located at the lower right corner of the front panel, and on the rear panel. Connect USB flash drives to which you can save or recall data (such as instrument software updates, waveforms, settings, and screen captures), or connect peripheral devices such as a mouse or keyboard.
- Page 63 Getting acquainted with your instrument FlexChannel probe connectors: MSO54, MSO56, MSO58, MSO58LP, MSO64 Help...
-
Page 64: Mso58Lp Front Panel Controls And Connections
Getting acquainted with your instrument ■ FlexChannel connectors support all TekVPI+ and TekVPI measurement probes, BNC passive probes, the TPL058 FlexChannel Logic Probe, and BNC cables. You connect most probes simply by pushing them into the connector until the probe seats with a click. See Connecting Probes on page 31. - Page 65 Getting acquainted with your instrument ® FlexChannel connectors support all TekVPI+ and TekVPI measurement probes, BNC passive probes, the TLP058 ® FlexChannel Logic Probe, and BNC cables. You connect most probes simply by pushing them into the connector until the probe seats with a click.
-
Page 66: Rear Panel Connections
Getting acquainted with your instrument Shows the instrument trigger/acquisition status: ■ Green - Triggered ■ Yellow - Armed but not yet triggered ■ Red - Acquisition stopped Power On/Standby button: Powers the instrument on and off. The power button color indicates instrument power states: ■... -
Page 67: The User Interface Screen
Getting acquainted with your instrument The user interface screen The touch screen user interface contains waveforms and plots, measurement readouts, and touch-based controls to access all oscilloscope functions. The Menu bar provides menus for typical operations including: ■ Saving, loading, and accessing files ■... -
Page 68: The User Interface Elements
Getting acquainted with your instrument The Results Bar contains controls for displaying cursors, adding notes, plots, and result tables to the screen, and add measurements to the Results bar. The controls are: ■ The Cursors button displays on-screen cursors in the selected view. Touch and drag, or use the Multipurpose knobs, to move the cursors. - Page 69 Getting acquainted with your instrument The Waveform Record View is a graphical high-level view of the overall waveform record length, how much of the record is on the screen (shown in brackets), the location of key time events including the trigger event, and the current position of waveforms cursors.
- Page 70 Getting acquainted with your instrument When in Zoom mode, the Waveform Record View is replaced with the Zoom Overview. See The Zoom user interface on page 60. elements The Expansion Point icon on the waveform view shows the center point around which the waveform expands and compresses when changing horizontal settings.
- Page 71 Getting acquainted with your instrument 11. The Waveform Handles on each waveform identify the source of that waveform (Cx for channels, Mx for Math waveforms, Rx for Reference waveforms, Bx for bus waveforms). The waveform handles are at the zero-volt level of the waveform by default.
-
Page 72: Badges
Getting acquainted with your instrument Badges Badges are rectangular icons that show waveform, measurement, and instrument settings or readouts. Badges also provide fast access to configuration menus. The badge types are Channel, Waveform, Measurement, Search, and System. Channel and Waveform badges Channel and Waveform (Math, Ref, Bus, Trend) badges are shown in the Settings Bar, located along the bottom left of the screen. - Page 73 Getting acquainted with your instrument Double-tap a Measurement badge to open its configuration menu to change or refine settings. The default measurement badge readout shows the measurement's mean (μ) value. Some measurements and their badges are only available as options. For example, Power measurements are only listed in the Add New Measurement menu if the PWR option is installed.
- Page 74 Getting acquainted with your instrument The Min' and Max' navigation buttons center the waveform in the display at the minimum or maximum value for that measurement in the current acquisition. The prime symbol (') shown on measurement readings and Min/Max buttons indicates that the value shown (or moved to in the case of Min/Max buttons and waveforms) is from the current acquisition.
- Page 75 Unable to read probe ROM. Please re-attach the accessory. Unsup Accessory is unsupported. Prb Fault Critical accessory fault. Please re-attach the accessory. If the problem persists, contact Tektronix service. Over Rng The signal voltage or current is over range. Please reduce the signal amplitude. Temp The probe has experienced an over temperature condition.
- Page 76 Tip Fault The probe tip has a fault. Please remove and replace the probe tip. S-param Error during S-parameter transfer. Please reattach the probe. If the problem persists, contact Tektronix Service. System badges System badges (in the Settings bar) display the main Horizontal, Trigger, and Acquisition settings. You cannot delete System badges.
- Page 77 Getting acquainted with your instrument Common badge actions Action Result Example Single tap Immediate access controls (Scale, Navigation). Double tap Configuration menu with access to all settings for the badge. Touch and hold Right-click menu with single tap access to common actions. Typical actions include turning off a channel and deleting a measurement or search badge.
-
Page 78: Moving Waveform And Measurement Badges
Getting acquainted with your instrument Badge selection status The appearance of a badge indicates its selection status (selected or unselected), or if a measurement needs to be deleted to close a channel or waveform badge. Badge type Selected Unselected Turned off or in use Channel or Waveform Measurement... -
Page 79: Configuration Menus
Getting acquainted with your instrument Moving badges in the measurement Results Bar A Measurement or Search badge can only be moved within the Results Bar. ■ Dragging a badge to a new location causes the non-selected badges to move to create the position at which to insert the ■... -
Page 80: The Zoom User Interface Elements
Getting acquainted with your instrument Tap anywhere outside a configuration menu to close it. To open Help content for a configuration menu, tap the question mark icon in the upper right corner of the menu. The Zoom user interface elements Use the zoom tools to magnify waveforms to view signal details. -
Page 81: Using The Touch Screen Interface For Common Tasks
Getting acquainted with your instrument The Zoom Overview shows the entire waveform record. All waveforms are shown in Overlay mode in the Zoom Overview area. NOTE. Using pinch and expand gestures on the Zoom Overview waveforms changes the horizontal time base settings. The Zoom Box shows the area of the Zoom Overview to display in the Zoom View (see 5). - Page 82 Getting acquainted with your instrument Table 6: Common touchscreen UI tasks (with mouse equivalents) Task Touchscreen UI action Mouse action Add a channel, math, reference, or bus Tap an inactive channel button, Add New Click an inactive channel button, Add waveform to the screen.
-
Page 83: Accessing Application Help
Getting acquainted with your instrument Task Touchscreen UI action Mouse action Close or open the Results Bar to Tap on the Results Bar Handle (three Click the Results Bar Handle (three increase the Waveform View area. vertical dots in border) or anywhere in the vertical dots in border) or anywhere in the border between the Waveform View and border between the Waveform View and... - Page 84 Getting acquainted with your instrument MSO54, MSO56, MSO58, MSO58LP, MSO64 Help...
-
Page 85: Configure The Instrument
IP address in a web browser. To remotely set this control or run this task on an MSO58LP, see the oscilloscope Programmer Manual (Tektronix part number 077-1305-xx) for the correct command or commands to use. -
Page 86: Download And Install The Latest Firmware
Configure the instrument Tap the Timing Measurements panel in the Add Measurements configuration menu. Double-tap the Frequency button to add the frequency measurement to the Results bar. Check that the Frequency measurement reads 1 kHz 10. Repeat these steps to check the other channels on the oscilloscope. Make sure that you set the source in the Add Measurement configuration menu to use the correct channel before adding the Frequency measurement. -
Page 87: Run Signal Path Compensation (Spc)
IP address in a web browser. To remotely set this control or run this task on an MSO58LP, see the oscilloscope Programmer Manual (Tektronix part number 077-1305-xx) for the correct command or commands to use. -
Page 88: Compensate The Probe
Connect the probe, to be compensated, to any channel of the oscilloscope. Allow the probe to warm up for 20 minutes. Set the oscilloscope to display the channel. Depending on your setups, do one of the following: Nine-digit part numbers (xxx-xxxx-xx) are Tektronix part numbers MSO54, MSO56, MSO58, MSO58LP, MSO64 Help... - Page 89 Configure the instrument ■ Attach a TDP7700 Series probe tip to the TekFlex connector of the probe. For a solder-in probe tip open the accessory tip clamp, insert the input end of the tip, then release the clamp. For a TDP77BRWSR browser tip, the browser’s pins should be pressed into the array of vias on the accessory.
- Page 90 Configure the instrument Double-tap the Channel badge to open a configuration menu for the channel the probe is attached to. The configuration menu appears. Tap the Probe Setup panel to confirm probe settings and run compensation on the probe. Tap the Compensate Probe button. The probe compensation menu appears.
-
Page 91: Compensate The Tpp0500B Or Tpp1000 Probes
IP address in a web browser. To remotely set this control or run this task on an MSO58LP, see the oscilloscope Programmer Manual (Tektronix part number 077-1305-xx) for the correct command or commands to use. - Page 92 Configure the instrument Figure 10: Probe Comp connections on the MSO58LP. Connect the probe tip to the 1 kHz source, and the ground clip to the ground. For best results, remove any probe tip accessories and hold the probe tip directly onto the 1 kHz connector. NOTE.
-
Page 93: Compensate Passive Probes
IP address in a web browser. To remotely set this control or run this task on an MSO58LP, see the oscilloscope Programmer Manual (Tektronix part number 077-1305-xx) for the correct command or commands to use. -
Page 94: Mount A Network Drive From A Standard Instrument
Configure the instrument Obtain or enter the network address information: If your network is DHCP-enabled, and the IP address field does not already show and address, tap Auto to obtain the ■ IP address information from the network. DHCP mode is the default mode. ■... -
Page 95: Mount A Network Drive From A Windows 10 Instrument
Configure the instrument Mount a network drive from a Windows 10 instrument Use this procedure to mount (map) a network Linux mount point or Windows shared directory on a Windows OS instrument. Prerequisites: The oscilloscope must be connected to a network that has access to the directories to mount or unmount. See the Connect to a network (LAN) topic in the application Help. -
Page 96: Remote Access From A Web Browser
Configure the instrument Remote access from a Web browser You can remotely access your network-connected standard instrument (not running Windows 10) from a Web browser to display the instrument user interface on a PC. This procedure describes how to remotely access the UI controls and screen for standard (non Windows 10) instruments. To remotely access the UI controls and screen for Windows 10 instruments, see Remote access to a Windows 10 instrument page 77. -
Page 97: Remote Access To A Windows 10 Instrument
Configure the instrument Remote access to a Windows 10 instrument Access to the graphical interface of a Windows 10 instrument requires installing software called TightVNC on both the PC and the oscilloscope. This procedure describes how to use TightVNC to access the instrument UI, and has links to the procedures to install TightVNC on the PC and the instrument. -
Page 98: Install Tightvnc On A Pc
IP address in a web browser. To remotely set this control or run this task on an MSO58LP, see the oscilloscope Programmer Manual (Tektronix part number 077-1305-xx) for the correct command or commands to use. -
Page 99: Deskew Analog Input Channels - Measurement Method
IP address in a web browser. To remotely set this control or run this task on an MSO58LP, see the oscilloscope Programmer Manual (Tektronix part number 077-1305-xx) for the correct command or commands to use. -
Page 100: Deskew Analog Input Channels - Tek-Cda Method
Configure the instrument 12. Repeat steps 9 through 11 for each additional channel you want to deskew in the first set of four. 13. To deskew additional channels: Disconnect all probe tips except the reference probe from the Probe Compensation connections. Connect up to three probe tips and ground leads to the Probe Compensation connector (maximum of four channels at a time). - Page 101 Configure the instrument ■ Before you apply power, connect the instrument to an electrically-neutral reference point, such as earth ground. To do this, plug the three-pronged power cord into an outlet grounded to earth ground. Grounding the oscilloscope is necessary to ensure safety and to take accurate measurements.
- Page 102 Configure the instrument MSO54, MSO56, MSO58, MSO58LP, MSO64 Help...
-
Page 103: Analog Channel Operating Basics
Analog channel operating basics Acquiring a signal After acquiring a signal you can take measurements and plot the results. Use the following procedure to set the scale and position parameters for analog signal acquisition. Press the Default Setup button. Connect the probe output to the desired oscilloscope channel, and connect the probe input to the input signal source using proper probing/connecting techniques. - Page 104 Analog channel operating basics Add the channel waveforms to the Waveform view. See Add a channel waveform to the display on page 88. Tap File > Autoset or push the front-panel Autoset button. When using the Stacked Display mode, the instrument analyzes the signal characteristics of the trigger source channel (analog or digital) and adjusts the horizontal, vertical, and trigger settings accordingly to display a triggered waveform for that channel.
-
Page 105: Set Horizontal Parameters
Analog channel operating basics Set Horizontal parameters Use this procedure to set the horizontal time base parameters such as mode, minimum sample rate, horizontal scale, delay, and trigger delay time (relative to the center of the waveform record. Double-tap the Horizontal badge on the Settings bar to open the Horizontal configuration menu. Use the menu selections to set horizontal parameters. - Page 106 NOTE. Triggering on buses other than Parallel requires purchasing and installing serial trigger and analysis options. See the Tektronix Web site for available serial trigger and analysis options. Select the other fields and panels to refine the trigger conditions. The menu fields and trigger graphic update as you make changes to the trigger settings.
-
Page 107: Set The Acquisition Mode
Analog channel operating basics Tap the Help icon on the menu title for more information on these settings. Tap outside the menu to close the menu. Set the acquisition mode Use this procedure to set the method the instrument uses to acquire and display the signal. Double-tap the Acquisition badge on the Settings bar to open the Acquisition configuration menu. -
Page 108: Start And Stop An Acquisition
Analog channel operating basics Tap the Help icon on the menu title for more information on these settings. Tap outside the menu to close the menu. Start and stop an acquisition Acquisition controls the start and stop of waveform acquisition. To start an acquisition, double-tap the Acquisition badge and tap Run/Stop in the Acquisition configuration menu. -
Page 109: Configure Channel And Waveform Settings
Analog channel operating basics Continue tapping Inactive Channel buttons to add more channels (digital or analog). Channels are displayed from lowest- numbered channel at the top, to highest-numbered channel at the bottom of the view, regardless of the order they were added (in stacked mode). - Page 110 Analog channel operating basics Double-tap a Channel or Waveform badge to open the configuration menu to the Vertical Settings panel. Displayed fields and controls can change depending on menu selections. Field or control Description Display Tap to toggle display of the channel On and Off. Vertical Scale Tap to set the scale using the multipurpose knob, double-tap to bring up the virtual keypad, or tap the up and down arrows to change the scale.
- Page 111 Analog channel operating basics Field or control Description Bandwidth Filter Optimized Tap to select a bandwidth filter that is optimized for flatness or step response. Flatness selects a brick-wall filter optimized for flatness within band with a sharp rolloff. Flatness filtering is not compatible with Peak Detect and Envelope acquisition modes. Step Response selects a Bessel-Thompson filter that minimizes overshoot with a gradual rolloff.
- Page 112 Analog channel operating basics Field or control Description Deskew Allows setting the channel deskew value. Set to 0 Sets the channel deskew to 0. Multi-Channel Brings up the Deskew configuration menu. External Attenuation Allows setting an external attenuation for the channel. As one field is edited, the other field changes to reflect the corresponding value.
-
Page 113: Add A Math, Reference, Or Bus Waveform
Analog channel operating basics Field or control Description From Source Selects the From Source to Deskew. Probe Displays the probe name or a drop-down list to select the probe connected to the From Source. Propagation Delay Displays the propagation delay of the probe shown in the Probe control. To Source Selects the To Source to Deskew. -
Page 114: Add A Measurement
Analog channel operating basics When adding a Reference waveform, the instrument displays a Recall configuration menu. Navigate to and select the reference waveform file (*.wfm) to recall, then tap the Recall button. The instrument displays the Reference waveform. Double-tap a math, reference, or bus badge to check or change that waveform's settings. See Configure channel and waveform settings on page 89. - Page 115 Analog channel operating basics NOTE. If the menu shows tabs other than Standard, then optional measurement types have been installed on the instrument. Select a tab to show the measurements for that option. Tap the Source field and select the measurement source. The list shows all available sources that are valid for the measurement.
- Page 116 Analog channel operating basics Select and add other measurements for the current source. Tap the measurement category panels to display and select other measurements to add. To add measurements for other sources, select a different source, select a measurement, and add the measurement. Tap outside the Add Measurements menu to close the menu.
-
Page 117: Configure A Measurement
Analog channel operating basics Configure a measurement Use this procedure to add statistical readouts to the measurement badge, display plots for the measurement, and refine measurement parameters (configuration, global versus local scope of settings, gating, filtering, and so on). Double-tap a measurement badge to open its Measurement configuration menu. Tap Show Statistics in Badge to add statistical readouts to the measurement badge. -
Page 118: Delete A Measurement Or Search Badge
Analog channel operating basics Delete a Measurement or Search badge Use this procedure to remove a Measurement or Search badge from the Results bar. Touch and hold the Measurement or Search badge that you want to delete. The instrument opens a right-click menu. Select Delete Meas to delete that badge from the Results bar. - Page 119 Analog channel operating basics The following shows adding a Histogram plot. You can add more than one plot to measurements (to different measurements or the same measurement). For example, you can add two histogram plots for the same measurement, set one to display the X-Axis with a Logarithmic scale, and the other plot to display the X-Axis with a Linear scale.
-
Page 120: Display A Histogram Plot
Analog channel operating basics Double-tap within a Plot view to open a configuration menu to set display characteristics. Tap the Help icon on the configuration menu title for more information on that menu's settings. Tap outside the menu to close the menu. Display a Histogram plot Use this procedure to display a histogram plot. -
Page 121: Display A Spectrum Plot
Analog channel operating basics Display a Spectrum plot Use this procedure to display a spectrum plot. To display a time spectrum plot you must be taking a measurement. Double-tap a measurement badge. The Measurement configuration menu is displayed. Tap the Spectrum plot button. The Spectrum plot is displayed in a separate Plot view. -
Page 122: Display A Bh Curve Plot For Magnetic Property Measurement (Optional)
Analog channel operating basics Display a BH curve plot for Magnetic Property measurement (optional) Use this procedure to display a BH Curve plot for a power measurement. To display a BH Curve plot, you must be taking a Magnetic Property measurement (Add New... Measurement > Power tab > Magnetic Analysis panel >... -
Page 123: Display A Power Switching Loss (Swl) Trajectory Plot (Optional)
Analog channel operating basics The SOA measurement adds a Power measurement badge to the Results bar, and automatically adds the SOA plot to the screen. Double-tap in the Plot view to open a configuration menu for that plot. Display a power Switching Loss (SWL) Trajectory plot (optional) Use this procedure to display a trajectory plot for a power measurement. -
Page 124: Add A Search
Analog channel operating basics The Bar graph is displayed in a separate Plot view. Double-tap in the Plot view to open the configuration menu for that plot. Add a Search Use this procedure to set search criteria and mark a waveform where those events occur. You can search on analog and digital signals, math waveforms, and reference waveforms. -
Page 125: Change Waveform View Settings
Analog channel operating basics To move the waveform to center marks on the display, push the Run/Stop front panel button to stop acquisition, single-tap a Search badge, and tap the < or > Navigation button. NOTE. Navigation buttons are only functional when the oscilloscope acquisition mode is set to Stop. This opens the Zoom mode and moves the waveform to the previous or next event mark on the waveform. -
Page 126: Display And Configure Cursors
Analog channel operating basics Use the other controls to set the waveform interpolation algorithm, waveform point persistence, style, and intensity, and graticule style and intensity. Tap the Help icon on the menu title to open the Waveform View menu help topic for more information on the waveform view parameters. - Page 127 Analog channel operating basics To further configure cursors, double-tap on either cursor line or the cursor readouts to open the Cursors configuration menu. For example, tap the Cursor type to select the cursors to display, such as Waveform, V Bars, H Bars, and V&H Bars. To split the cursors between two waveforms, tap the Source field and select Split and select the source for each cursor.
-
Page 128: Using Default Setup
Analog channel operating basics Using Default Setup Use Default Setup to restore instrument settings to their factory defaults. Press the front panel Default Setup button to return the instrument to its factory default settings (horizontal, vertical, scale, position, and so on). You can also select File >... -
Page 129: Add A Note To A View
Analog channel operating basics View the waveform to find glitches, transients, or other random events. When you have identified an anomaly, use the advanced trigger system to capture the event of interest for further analysis. NOTE. If Fast Acquisitions mode is on and you attempt to activate a feature that conflicts with this mode, Fast Acquisitions mode will be disabled. -
Page 130: Delete A Note
Analog channel operating basics Tap in the Text field and use a keyboard to enter the note text, or double-tap in the Text field and use the on-screen keyboard to enter the note text. NOTE. You can enter only one row of text in the Text field of the Text Settings configuration menu (using an attached keyboard). -
Page 131: Acquiring Digital Signals
Connect the FlexChannel logic probe to the instrument. The digital signal waveforms are opened on the screen. Connect the probe to the signal sources. Use the accessories in the Tektronix Probe accessory Kit (shipped with the probe) to connect to your DUT. -
Page 132: Add A Serial Bus To The Waveform View
Acquiring digital signals Tap Display to toggle the digital channel group On or Off. Doing this closes the menu and removes the Digital channel badge from the Settings bar. To change the displayed height of the digital channels, tap a Height button. The Height settings are only available when the display mode is set to Overlay in the Waveform View configuration menu. - Page 133 Acquiring digital signals Use the fields and controls to select the bus signal sources, thresholds, other parameters, and the output format. The following example shows the settings for an Audio I C serial bus. The decoded bus is updated on the screen as you make changes to the settings. Tap outside of the Bus configuration menu to close it.
-
Page 134: Add A Parallel Bus To The Waveform View
Acquiring digital signals Double-tap the Trigger badge and use the Trigger configuration menu to trigger on a specific condition in the bus. For more information on serial bus settings, tap the Help button on the Bus configuration menu. Add a parallel bus to the Waveform view Use this procedure to add a parallel bus to the Waveform view. - Page 135 Acquiring digital signals Set Clocked Data to Yes. Tap the Clock Source field and select the source for the parallel bus clock signal. Tap the Polarity and Threshold controls and set the clock signal transition to detect and threshold level, respectively. Tap Define Inputs and select the signal sources for the parallel bus.
- Page 136 Acquiring digital signals Tap outside of the Bus configuration menu to close it. To get a stable triggered waveform, double-tap the Trigger badge, set the Trigger Type to Bus, select the bus Source to the parallel bus you just set up, and enter the data condition on which to trigger in the Data field. For information on parallel bus menu settings, tap the Help button on the Bus configuration menu.
-
Page 137: Advanced Triggering
Advanced triggering You can check the advanced trigger status in the trigger menu. The menu indicates the trigger type and then shows sources, levels, or any other parameters that are important for the particular trigger type. Use the following links for more information on advanced triggering. -
Page 138: Trigger On A Pulse Width Event
Advanced triggering The trigger event The trigger event establishes the time-zero point in the waveform record. All waveform record data are located in time with respect to that point. The instrument continuously acquires and retains enough sample points to fill the pretrigger portion of the waveform record (that part of the waveform that is displayed before, or to the left of, the triggering event on screen). -
Page 139: Set Trigger Holdoff
Advanced triggering Set Trigger Holdoff Trigger Holdoff sets the time, after triggering on an event, that the instrument waits before detecting the same trigger event to start the next acquisition. Setting the correct holdoff time is important to get a stable trigger. The longer holdoff time for the top waveform causes unstable triggering. -
Page 140: Set Up Trigger On A Parallel Bus
Advanced triggering Tap Trigger Type and select a trigger type. This example uses Runt. Tap Source and select a trigger source. Tap Trigger When and select the condition on when to trigger on a runt signal. Tap a Polarity icon to set the runt pulse polarity to detect (positive, negative, or either). Tap the Upper Threshold and Lower Threshold fields and set the levels that a signal must cross to be considered a valid signal. -
Page 141: Trigger Using The Aux Input
Advanced triggering Trigger using the AUX input Use this procedure to trigger the instrument from an external signal connected to the AUX input. Double-tap the Trigger badge on the Settings bar. Tap Trigger Type and select Edge from the list. Tap Source and select Aux. -
Page 142: Edit Visual Trigger Areas On The Screen
Advanced triggering When you are done drawing visual trigger areas, single-tap anywhere to end the area draw function. To change the shape of an area, see Edit visual trigger areas on the screen on page 122 and Edit visual trigger areas using the Area menu on page 125. - Page 143 Advanced triggering Tap an area three times to enable add/delete vertex mode. Add/delete mode draws a crosshair at each existing vertex, and a plus symbol midway between each existing vertex. NOTE. A triangular area does not draw the existing vertices with crosshairs, as they cannot be deleted; only the midway plus symbols are shown to let you add vertices to a triangle.
- Page 144 Advanced triggering To exit add/remove vertex mode, tap outside the visual trigger area. The instrument returns to normal operation. To rotate a visual trigger area: Tap four times in the area to enable rotate area mode. Touch and drag the dot in the area to rotate the area. NOTE.
-
Page 145: Edit Visual Trigger Areas Using The Area Menu
Advanced triggering Edit visual trigger areas using the Area menu Use these procedures to edit Visual Trigger areas using the Area menu, including moving, changing size, moving individual vertices, adding and deleting vertices, and rotating the area. Visual Trigger Area configuration menu on page 406 for more information on the Area menu. - Page 146 Advanced triggering Double-tap on the area to edit. Tap the Width field and enter the width value as horizontal time (seconds). Or double-tap on the field and use the A knob to change the value. The shape immediately changes width while maintaining the horizontal center position of the area.
- Page 147 Advanced triggering 13. To move individual vertices in an area using the Area menu: Double-tap on the area to edit. Tap the Edit Vertices panel. Select the vertex in the Define Area list that you want to move. Selecting a vertex highlights that vertex on the area. Tap the X (time) axis or Y (Ampl.) field in the list and use the A and B knobs to change the position values.
- Page 148 Advanced triggering MSO54, MSO56, MSO58, MSO58LP, MSO64 Help...
-
Page 149: Setting Waveform Display Parameters
Setting waveform display parameters Use waveform display controls to set the display mode, persistence, style, and intensity display parameters, and graticule style and intensity. Use the following topics for more information on setting display parameters. ■ on page 129 Set waveform display mode (Stacked or Overlay) ■... -
Page 150: Set The Waveform Persistence, Style, And Intensity
Setting waveform display parameters Set the waveform persistence, style, and intensity Use the Waveform View configuration menu to set waveform persistence, style, and intensity. Double-tap on an open graticule area to open the Waveform View menu. Tap the Persistence field to select the persistence option. Off disables display persistence. -
Page 151: Zooming On Waveforms
Zooming on waveforms Use the zoom tools to magnify waveforms to view signal details. Turn on Zoom mode Zoom mode lets you look at a portion of your waveform in greater detail. Enable Zoom mode and touch and drag on-screen to select the area to zoom. -
Page 152: Using Wave Inspector Front-Panel Controls For Zoom
Zooming on waveforms Zoom overview: To use Zoom once enabled, tap the Draw a Box icon touch and draw a box around an area of interest in the Waveform or Plot view to immediately display the zoomed waveform and the Zoom Overview window. You can draw boxes in the Waveform view, most plots, and the Zoom Overview area. - Page 153 Zooming on waveforms For information on creating a Search, see Add a Search on page 104. MSO54, MSO56, MSO58, MSO58LP, MSO64 Help...
- Page 154 Zooming on waveforms MSO54, MSO56, MSO58, MSO58LP, MSO64 Help...
-
Page 155: Customizing Measurements
Customizing measurements After adding a measurement, you can customize the measurement for more precise results by using gating, setting reference levels, adding a filter, limiting the results to view, or adding a label. To customize measurements, double-tap a Measurement badge in the Results bar to open the Measurement configuration menu overview on page 164. -
Page 156: Set Measurement Reference Levels
Customizing measurements Set measurement reference levels Use this procedure to set measurement reference levels. Reference levels are set in the Reference Levels panel of the Measurements configuration menu. See Measurement configuration menu overview on page 164. Prerequisite: To set measurement reference levels you must be taking a measurement. See on page 94. -
Page 157: Set Measurement Gates
Customizing measurements Set measurement gates Use this procedure to specify which portion of your waveform is used to take measurements. Gating is set in the Gating panel of the Measurements configuration menu. See Measurement configuration menu overview page 164. To set measurement gates you must be taking a measurement. See on page 94. -
Page 158: Set Measurement Limits
Customizing measurements Select either Global or Local. ■ Global causes changes in this panel to be updated in all other measurements that also have Global selected in this panel. When switching from Global to Local: ■ If a specific measurement has not been set to Local before then no changes are made to any of the values. You can update the parameters. -
Page 159: Saving And Recalling Information
Saving and recalling information Use these procedures to save or recall waveforms, setups, or sessions. Save a screen image Use this procedure to save a screen image. Tap the File menu and select Save As. The Save As configuration menu opens. Tap Screen Capture to open the Screen Capture tab. -
Page 160: Save A Waveform To A File
Saving and recalling information Save a waveform to a file Use this procedure to save channel waveform (analog or digital) data to a comma-separated values (csv) or Tektronix waveform data (wfm) file, for later analysis or inclusion in reports. Tap the File menu and select Save As. -
Page 161: Save Reports
Saving and recalling information File Name shows the name last used to save a file. The default name is Tek000. To change the file name, double-tap the file name and enter a new file name using the virtual keyboard. Tap Auto Increment File Name to enable or disable automatic incrementing of a file name. Auto Increment File Name lets you save sequential files without needing to manually rename them each time. -
Page 162: Save Sessions
Saving and recalling information 10. Tap Include Setup Configuration to include the instrument settings data in the report. 11. Tap Save to save the report file to the specified file name, location, and type. NOTE. Once you have saved a file using the Save As configuration menu, you can push the front-panel User button to immediately save the same type file again, without opening any menus. -
Page 163: Recall A Reference Waveform
Saving and recalling information Recall a Reference waveform Use this procedure to recall (load) and display a saved waveform as a Reference waveform. There is no set limit to the number of reference waveforms that you can load and display. Tap the Add New Ref button on the Settings bar. -
Page 164: Recall A Session File
Saving and recalling information As you navigate the folders, the files list area shows all files that match the file type selected in the Files of Type field. Select the file to recall, using one of the following methods: ■ If the file was recently recalled, tap the drop down arrow in the File Name: field and select from a drop-down list of recently recalled files. -
Page 165: The Acquisition Configuration Menu
Menus and dialog boxes The Acquisition configuration menu Use this configuration menu to set which data points are used to acquire waveforms, and enable automatically saving acquisitions to files. To open the Acquisition menu, double-tap the Acquisition badge on the Settings bar. The Acquisition menu fields and controls Displayed fields and controls can change depending on menu selections. -
Page 166: Save On Trigger Menu
Menus and dialog boxes Field or control Description Save on Trigger Enables automatically saving waveform and/or screen image files when a trigger event occurs. Optimally used with single triggers or small sequences to reduce the number of files saved. Use the Configure button to set save location. -
Page 167: Fastframe Panel
Menus and dialog boxes FastFrame Panel ™ Use this panel to enable FastFrame mode and select the number of frames to acquire. The FastFrame panel is accessed from the Acquisition badge menu. To open the Acquisition menu: Double-tap the Acquisition badge. Tap the FastFrame panel. -
Page 168: Fastframe Badge
Menus and dialog boxes FastFrame usage guidelines. Enabling FastFrame mode disables FastAcq mode (if it was enabled). Likewise, enabling FastAcq mode disables ■ FastFrame mode (if it was enabled). You should define the trigger conditions to capture only the waveform, or waveform segment, in which you are interested, ■... - Page 169 Menus and dialog boxes FastFrame badge fields and controls. Field or control Description Frame count Shows the total number of frames captured at the top of the badge. Selected Frame Shows the selected frame in all displayed waveforms (analog, digital, and math). Use Multipurpose A knob to scroll through and select specific frames.
-
Page 170: Fastframe Badge Configuration Menu
Menus and dialog boxes FastFrame badge configuration menu Use the FastFrame configuration menu to set FastFrame overlay mode, enable reference frame timestamp readouts, and display FastFrame-related plots. The FastFrame configuration menu is accessed from the FastFrame badge. To open the FastFrame configuration menu, double- tap the upper (readouts) area of the FastFrame badge. -
Page 171: Add Measurements Configuration Menu Overview
Menus and dialog boxes Add Measurements configuration menu overview Use this configuration menu to select measurements you want to take on waveforms and add the measurements to the Results bar. To open the Add Measurements configuration menu, tap the Add New... Measure button in the Analysis controls area. The Add Measurements configuration menu always opens on the Standard measurement tab. -
Page 172: The Standard Measurements Tab
Menus and dialog boxes Other tab measurements Add Measurement tab Description Jitter Advanced Jitter and Eye Analysis measurements (optional). Provides triggers and measurements for advanced jitter and eye analysis. See The Jitter tab (Advanced Jitter and Eye Analysis) (optional) on page 157. Power Advanced Power Analysis (optional). - Page 173 Menus and dialog boxes The Amplitude Measurements panel measurements. Measurement Description AC RMS The true Root Mean Square voltage, minus any DC component, of the waveform data points that are above the Mean signal level. You can take this measurement on each cycle in the waveform record or on the entire waveform record.
-
Page 174: Timing Measurements Panel
Menus and dialog boxes Timing Measurements panel Use the Timing Measurements panel to add timing-related measurements to the Results bar. Timing measurements can be taken on time-domain analog, math, and reference waveforms. Timing measurements can also be taken on some digital channel signals. - Page 175 Menus and dialog boxes Timing Measurements panel. Measurement Description Burst Width The duration of a series of adjacent crossings of the Mid reference level. Bursts are separated by a specified idle time. The measurement is taken on each burst in a waveform record. Data Rate Data Rate is the reciprocal of Unit Interval.
-
Page 176: Jitter Measurements Panel
Menus and dialog boxes Measurement Description Positive Pulse Width The distance (time) between the mid reference (default 50%) amplitude points of a positive pulse. The measurement is made on the first pulse in the measurement region. Rise Time The time required for the leading edge of the first pulse in the measurement region to rise from the low reference value (default = 10%) to the high reference value (default = 90%). -
Page 177: The Jitter Tab (Advanced Jitter And Eye Analysis) (Optional)
Menus and dialog boxes Jitter Measurements panel measurements. Measurement Description Phase Noise The RMS magnitude of all integrated jitter falling within a specified offset range of the fundamental clock frequency. This measurement is taken on the entire waveform record. The difference in time between an edge in the source waveform and the corresponding edge in a recovered reference clock signal. - Page 178 Menus and dialog boxes Jitter Measurements panel (optional). Measurement Description Duty cycle distortion. The peak-to-peak amplitude for the component of the deterministic jitter correlated with the signal polarity. The measurement is taken on the entire record. Data dependent jitter. The peak-to-peak amplitude for the component of the deterministic jitter correlated with the date pattern in the waveform.
- Page 179 Menus and dialog boxes Measurement Description Time Interval Error. The difference in time between an edge in the source waveform and the corresponding edge in a recovered reference clock signal. The measurement is taken on each waveform edge. TJ@BER Total error at a specified bit error rate. The predicated peak-to-peak amplitude of jitter that will only be exceeded with a probability equal to the bit error rate.
- Page 180 Menus and dialog boxes Amplitude Measurements panel (optional). Measurement Description AC Common Mode (Pk-Pk) The peak-to-peak of the common mode voltage of the two specified sources. The measurement is taken on the entire record. Bit Amplitude The difference between the amplitudes of the 1 and 0 bits surrounding a transition. The amplitude is measured over a specified part of at the center of the recovered time interval.
-
Page 181: The Power Tab (Optional)
Menus and dialog boxes The Power tab (optional) The Power tab lists the power-related measurements that you can add to the Results bar. Power measurements include input analysis, amplitude analysis, timing analysis, switching analysis, and output analysis. The Power tab is shown only if you have purchased and installed the Advanced Power Analysis option. - Page 182 Menus and dialog boxes Amplitude Analysis Measurements panel (optional). Measurement Description Cycle Amplitude The difference between the Top value and the Base value. Measurement can be made across the entire record or on each cycle in the record. Cycle Top The most common data point value above the midpoint of the waveform over the measurement region.
- Page 183 Menus and dialog boxes Switching Analysis Measurements panel (optional). Measurement Description Switching Loss The mean instantaneous power and energy in the turn-on, turn-off, and conduction regions of a switching device. Provides the SWL trajectory plot. dv/dt The rate of change (slew rate) of the voltage, as it rises from the Base reference level (R ) to the Top reference level (R ), and as it falls from the Top reference level...
-
Page 184: Measurement Configuration Menu Overview
Menus and dialog boxes See also. Power measurement configuration menu overview Measurement configuration menu overview Use this configuration menu to add statistics to a measurement badge readout, plot a measurement, and change measurement settings including source, scope (global or local), reference levels, gating, clock recovery, bandwidth filters, and results limits. To open a Measurement configuration menu for a measurement, double-tap a Measurement badge in the Results bar. -
Page 185: Measurement Name Panel (Measurement Configuration Menu)
Menus and dialog boxes Measurement Name panel (Measurement configuration menu) The Measurement Name panel (the name of the measurement) provides controls for adding display statistics to the measurement badge and opening plots of the measurement. To open the measurement name panel, double-tap a Measurement badge. This is the default panel shown when you open a Measurement settings menu. -
Page 186: Reference Levels Panel (Measurement Configuration Menu)
Menus and dialog boxes Field or control Description To Edge Sets the Source 2 waveform edge on which to stop the measurement, for two-source measurements. Calculate One Measurement Sets the amount of waveform data to use to calculate one measurement; one measurement across the entire waveform record or one measurement for each cycle of the waveform in the record. - Page 187 Menus and dialog boxes Reference Levels panel- fields and controls. Field or control Description Reference Levels Global sets whether the reference levels defined in this measurement apply to all measurements that are set to global (the default setting). Local sets the Reference Level parameters to apply to just this measurement. Source Lists the source signals used for each edge of the measurement.
-
Page 188: Clock Recovery Panel (Measurement Configuration Menu)
Menus and dialog boxes Field or control Description Hysteresis Sets the threshold margin to the reference level which the signal must cross to be recognized as changing; the margin is the relative reference level plus or minus half the hysteresis. Use hysteresis to filter out spurious events. - Page 189 Menus and dialog boxes Measurement configuration menu, Clock Recovery panel. Field or control Description Clock Recovery Global sets whether the Clock Recovery settings defined in this panel apply to all measurements with clock recovery settings that are set to global (the default setting). Local sets the Clock Recovery parameters to apply to just this measurement.
- Page 190 Menus and dialog boxes Field or control Description Calculate On First Acq. sets the clock-recovery algorithm to choose a new best-fit clock frequency and phase on just the first acquisition. Subsequent acquisitions will choose a best fit on clock phase but retain the clock frequency found in the first acquisition.
- Page 191 Menus and dialog boxes Field or control Description PLL Model Select the PLL model type. The PLL control area provides control over the phase-locked loop used for clock recovery. You can choose the loop bandwidth and the loop order, and if a Type II loop is chosen, you can specify the damping factor.
-
Page 192: Clock Recovery- Advanced Settings Configuration Menu
Menus and dialog boxes PLL-based clock recovery. PLL-based clock recovery is implemented using a software model of a hardware PLL circuit, sequentially processing waveform transitions and adjusting the clock period in a feedback loop. This approach means that the transition density of the input signal has subtle effects on the effective bandwidth and damping factor of the feedback loop, just as it does with actual hardware PLLs. -
Page 193: Gating Panel (Measurement Configuration Menu)
Menus and dialog boxes Gating panel (Measurement configuration menu) Use Gating to confine a measurement to a certain part of a waveform. To open the Gating panel: Double-tap a Measurement badge in the Results bar to open the Measurement configuration menu. Tap the Gating panel. -
Page 194: Filter/Limit Results Panel (Measurement Settings Menu)
Menus and dialog boxes Filter/Limit Results panel (Measurement Settings menu) Use these settings to apply a High Pass and/or Low Pass filter to block specified frequency band components when taking measurements. Use the limit controls to set range of measurement values to measure, and the number of measurements to take (population). -
Page 195: Power Measurement Configuration Menu Overview (Optional)
Menus and dialog boxes Power measurement configuration menu overview (optional) Use this configuration menu to add statistics to a Power measurement badge readout, plot a measurement, and change measurement settings including source, scope (global or local), reference levels, and gating. To open the Power measurement configuration menu for a measurement, double-tap a Power measurement badge in the Results bar. -
Page 196: Configure Panel (Power Measurement Configuration Menu)
Menus and dialog boxes Field or control Description Power Autoset Sets the oscilloscope acquisition system for optimal results for all active power measurements except Inrush Current, Input Capacitance, Turn-on Time, and Turn-off time. See Power Autoset. Power seq setup Sets the oscilloscope acquisition system for optimal results for Turn On Time, Turn Off Time, Input Capacitance, and Inrush Current power measurements. - Page 197 Menus and dialog boxes Harmonics measurement: Configure panel. Field or control Description Standard Sets the standard to use for measurements. None (no Standard), IEC 61000-3-2, MIL- STD-1399, AM14, or D0-160G (Standard for Airborne equipment. Supported for harmonics measurement for single phase DUT). Harmonics Sets the harmonics order (number of harmonics) for the selected standard.
- Page 198 Menus and dialog boxes Input Capacitance measurement: Configure panel. Field or control Description Voltage Source Selects the voltage source used to take the measurement. Tap the field to show the list of available sources. Current Source Selects the current source used to take the measurement. Tap the field to show the list of available sources.
- Page 199 Menus and dialog boxes Switching Loss measurement: Configure panel. Field or control Description Voltage Source Selects the voltage source used to take the measurement. Tap the field to show the list of available sources. Current Source Selects the current source used to take the measurement. Tap the field to show the list of available sources.
- Page 200 Menus and dialog boxes Inductance measurement: Configure panel. Field or control Description Voltage Source Selects the voltage source used to take the measurement. Tap the field to show the list of available sources. Current Source Selects the current source used to take the measurement. Tap the field to show the list of available sources.
- Page 201 Menus and dialog boxes Turn On Time measurement: Configure panel. Field or control Description Input Source Selects the channel connected to the input side of the DUT. Type Selects the input to output power conversion type. Default is DC-DC. Label Sets the name of the measurement.
- Page 202 Menus and dialog boxes Turn Off Time measurement: Configure panel. Field or control Description Input Source Selects the channel connected to the input side of the DUT. Type Selects the input to output power conversion type. Default is AC-DC. Label Sets the name of the measurement.
- Page 203 Menus and dialog boxes Magnetic Property measurement: Configure panel. Field or control Description Primary Voltage Source Selects the source used to take the voltage measurement. Tap the field to show the list of available sources. Primary Current Source Selects the source used to take the current measurement. Tap the field to show the list of available sources.
- Page 204 Menus and dialog boxes Field or control Description Number of sec windings Sets the number of secondary windings to measure. The range is from 1 to 6. Measure the magnetic property of secondary windings such as in a coupled inductor or a transformer that has multiple windings on the same core.
-
Page 205: Power Autoset Button
Menus and dialog boxes Amplitude Analysis, Timing Analysis power measurements: Configure panel. Field or control Description Source Sets the signal source or sources used to take the measurement. If the measurement requires more than one source, multiple source fields are displayed. Tap the field to show the list of available sources. -
Page 206: Power Sequence Setup Button
Menus and dialog boxes Tap the Power Autoset button for each measurement and wait for the busy indicator to disappear. The instrument has now been optimized for that power measurement. NOTE. In case of failure, the instrument displays a popup error message. See Errors and Warnings. -
Page 207: Soa Mask Definition Controls And Fields
Menus and dialog boxes SOA Mask definition controls and fields Use the SOA Mask dialog to configure the parameters to add point, delete point, save mask, and recall mask. Use the parameters to define the linear mask for an SOA measurement. Define Mask fields and controls Field or control Description... -
Page 208: Save Mask Menu (Soa Power Measurement)
Menus and dialog boxes Save Mask menu (SOA power measurement) Use this menu to save a SOA power measurement mask file to a specified location. Prerequisite: Open the Configure panel of the SOA measurement for which you want to save a mask file (.pwrmsk). To open the Save Mask configuration menu: Tap the Save Mask button to open the Save As menu. - Page 209 Menus and dialog boxes File operations and Microsoft Windows 10 Operating System SSD. Instruments with Windows 10 SSD will display the standard Windows file tools to navigate to and select files and folders. The Windows operating system assigns the first available drive letter (typically E:) to the first USB device attached to the oscilloscope, regardless of which port the USB device is plugged into.
-
Page 210: Reference Levels Panel (Power Measurement Configuration Menu)
Menus and dialog boxes USB port drive names and locations. Use the following table to determine which drive to select when navigating to and/or selecting a file on system memory or a connected USB memory device. Drive name Drive letter Drive or physical USB port location MSO54, MSO56, MSO58, MSO64, without Windows OS Root drive... -
Page 211: Gating Panel (Power Measurement Configuration Menu)
Menus and dialog boxes Gating panel (Power measurement configuration menu) Use Gating to confine a measurement to a certain part of a waveform. Gating panel (Measurement configuration menu) on page 173 for the Gating panel fields and controls. See also Power Measurement Name panel (Measurement configuration menu) on page 175 on page 190... -
Page 212: Arinc 429 Serial Bus Menu
Menus and dialog boxes Bus type configuration menus ARINC 429 serial bus menu on page 192 Audio serial bus configuration menu on page 194 CAN serial bus configuration menu on page 196 Ethernet serial bus menu on page 198 FlexRay serial bus configuration menu on page 200 I2C serial bus configuration menu on page 202... - Page 213 Menus and dialog boxes ARINC 429 serial bus menu fields and controls. Field or control Description Display Turns on or off displaying the bus on the Waveform view. Label Enter a label for the bus. The default label is the selected bus type. To enter label text, double-tap the field and enter label using the virtual keyboard, or tap the field and enter text using an attached keyboard.
-
Page 214: Audio Serial Bus Configuration Menu
Menus and dialog boxes Other bus types. Other serial bus types, such as CAN, LIN, Ethernet, and so on, are available as purchasable options. Once purchased and installed, the new bus types are shown in the Bus Type menu. The serial bus options also add corresponding bus trigger capabilities to the Trigger menu. - Page 215 Menus and dialog boxes Audio serial bus menu fields and controls. Field or control Description Display Turns on or off displaying the bus on the Waveform view. Label Enter a label for the bus. The default label is the selected bus type. To enter label text, double-tap the field and enter label using the virtual keyboard, or tap the field and enter text from an attached keyboard.
-
Page 216: Can Serial Bus Configuration Menu
Menus and dialog boxes Other bus types. Other serial bus types, such as CAN, USB, I2C, FlexRay, and so on, are available as purchasable options. Once purchased and installed, the new bus types are shown in the Bus Type menu. The serial bus options also add corresponding bus trigger capabilities to the Trigger menu. - Page 217 Menus and dialog boxes CAN serial bus menu fields and controls. Field or control Description Display Turns on or off displaying the bus on the Waveform view. Label Enter a label for the bus. The default label is the selected bus type. To enter label text, double-tap the field and enter label using the virtual keyboard, or tap the field and enter text from an attached keyboard.
-
Page 218: Ethernet Serial Bus Menu
Menus and dialog boxes Field or control Description Decode Format Sets the decode format used to display the bus information. Formats are Hex, Binary, and Mixed Hex. Other bus types. Other serial bus types, such as RS232, LIN, I2C, FlexRay, and so on, are available as purchasable options. Once purchased and installed, the new bus types are shown in the Bus Type menu. - Page 219 Menus and dialog boxes Ethernet serial bus menu fields and controls. Field or control Description Display Turns on or off displaying the bus on the Waveform view. Label Enter a label for the bus. The default label is the selected bus type. To enter label text, double-tap the field and enter label using the virtual keyboard, or tap the field and enter text from an attached keyboard.
-
Page 220: Flexray Serial Bus Configuration Menu
Menus and dialog boxes Other bus types. Other serial bus types, such as CAN, LIN, I2C, FlexRay, and so on, are available as purchasable options. Once purchased and installed, the new bus types are shown in the Bus Type menu. The serial bus options also add corresponding bus trigger capabilities to the Trigger menu. - Page 221 Menus and dialog boxes FlexRay serial bus menu fields and controls. Field or control Description Display Turns on or off displaying the bus on the Waveform view. Label Enter a label for the bus. The default label is the selected bus type. To enter label text, double-tap the field and enter label using the virtual keyboard, or tap the field and enter text using an attached keyboard.
-
Page 222: I2C Serial Bus Configuration Menu
Menus and dialog boxes Other bus types. Other serial bus types, such as CAN, LIN, Ethernet, and so on, are available as purchasable options. Once purchased and installed, the new bus types are shown in the Bus Type menu. The serial bus options also add corresponding bus trigger capabilities to the Trigger menu. - Page 223 Menus and dialog boxes I2C serial bus menu fields and controls. Field or control Description Display Turns on or off displaying the bus on the Waveform view. Label Enter a label for the bus. The default label is the selected bus type. To enter label text, double-tap the field and enter label using the virtual keyboard, or tap the field and enter text from an attached keyboard.
-
Page 224: Lin Serial Bus Configuration Menu
Menus and dialog boxes See also. Bus Trigger configuration on page 342 Bus Search configuration menus on page 230 LIN serial bus configuration menu Use this menu (optional) to set up and display a LIN (Local Interconnect Network) serial bus waveform. To set up the LIN serial bus: To create a new LIN bus waveform, tap the Add New Bus button on the Settings bar. -
Page 225: Mil-Std-1553 Serial Bus Menu
Menus and dialog boxes Other bus types. Other serial bus types, such as CAN, Audio, I2C, FlexRay, and so on, are available as purchasable options. Once purchased and installed, the new bus types are shown in the Bus Type menu. The serial bus options also add corresponding bus trigger capabilities to the Trigger menu. - Page 226 Menus and dialog boxes MIL-STD-1553 serial bus menu fields and controls. Field or control Description Display Turns on or off displaying the bus on the Waveform view. Label Enter a label for the bus. The default label is the selected bus type. To enter label text, double-tap the field and enter label using the virtual keyboard, or tap the field and enter text using an attached keyboard.
-
Page 227: Parallel Bus Configuration Menu
Menus and dialog boxes See also. Bus Trigger configuration on page 342 Bus Search configuration menus on page 230 Parallel Bus configuration menu Use this menu to set up and display a parallel bus waveform. Parallel bus decoding and triggering is included with the oscilloscope. -
Page 228: Parallel Bus - Define Inputs Menu
Menus and dialog boxes Other bus types. Serial bus types, such as CAN, Ethernet, USB, and FlexRay, are available as purchasable options. Once purchased and installed, the new bus types are shown in the Bus Type menu. The serial bus options also add corresponding bus trigger capabilities to the Trigger menu. -
Page 229: Rs232 Serial Bus Menu
Menus and dialog boxes Parallel Bus - Define Inputs menu fields and controls. Field or control Description Parallel bus definition list Lists the signal source and thresholds of selected channels or waveforms. The MSB is at the top of the list. To add a signal to the Parallel bus definition list, tap a source button in the Sources list. - Page 230 Menus and dialog boxes RS232 serial bus menu fields and controls. Field or control Description Display Turns on or off displaying the bus on the Waveform view. Label Enter a label for the bus. The default label is the selected bus type. To enter label text, double-tap the field and enter label using the virtual keyboard, or tap the field and enter text from an attached keyboard.
-
Page 231: Sent Serial Bus Configuration Menu
Menus and dialog boxes Other bus types. Other serial bus types, such as CAN, USB, I2C, and FlexRay, are available as purchasable options. Once purchased and installed, the new bus types are shown in the Bus Type menu. The serial bus options also add corresponding bus trigger capabilities to the Trigger menu. - Page 232 Menus and dialog boxes SENT serial bus menu fields and controls. Field or control Description Display Turns on or off displaying the bus on the Waveform view. Label Enter a label for the bus. The default label is the selected bus type. To enter label text, double-tap the field and use the virtual keyboard to enter label text, or tap the field and enter text from an attached keyboard.
-
Page 233: Spi Serial Bus Configuration Menu
Menus and dialog boxes Other bus types. Other serial bus types, such as RS232, LIN, I2C, FlexRay, and so on, are available as purchasable options. Once purchased and installed, the new bus types are shown in the Bus Type menu. The serial bus options also add corresponding bus trigger capabilities to the Trigger menu. - Page 234 Menus and dialog boxes SPI serial bus menu fields and controls. Field or control Description Display Turns on or off displaying the bus on the Waveform view. Label Enter a label for the bus. The default label is the selected bus type. To enter label text, double-tap the field and enter label using the virtual keyboard, or tap the field and enter text from an attached keyboard.
-
Page 235: Spmi Serial Bus Configuration Menu
Menus and dialog boxes Other bus types. Other serial bus types, such as CAN, LIN, I C, and FlexRay, are available as purchasable options. Once purchased and installed, the new bus types are shown in the Bus Type menu. The serial bus options also add corresponding bus trigger capabilities to the Trigger menu. - Page 236 Menus and dialog boxes SPMI serial bus menu fields and controls. Field or control Description Display Turns on or off displaying the bus on the Waveform view. Label Enter a label for the bus. The default label is the selected bus type. To enter label text, double-tap the field and enter label using the virtual keyboard, or tap the field and enter text from an attached keyboard.
-
Page 237: Usb Serial Bus Configuration Menu
Menus and dialog boxes See also. Bus Trigger configuration on page 342 Bus Search configuration menus on page 230 USB serial bus configuration menu Use the USB bus menu (optional) to set up and display an USB 2.0 (Universal Serial Bus) waveform. To set up a USB serial bus: To create a new USB bus waveform, tap the Add New Bus button on the Settings bar. - Page 238 Menus and dialog boxes USB serial bus menu fields and controls. Field or control Description Display Turns on or off displaying the bus on the Waveform view. Label Enter a label for the bus. The default label is the selected bus type. To enter label text, double-tap the field and enter label using the virtual keyboard, or tap the field and enter text from an attached keyboard.
-
Page 239: Add Plot Configuration Menu
Menus and dialog boxes Other bus types. Serial bus types, such as CAN, LIN, I2C, and FlexRay, are available as purchasable options. Once purchased and installed, the new bus types are shown in the Bus Type menu. The serial bus options also add corresponding bus trigger capabilities to the Trigger menu. -
Page 240: Add Results Table Configuration Menu
Menus and dialog boxes Add Plot menu fields and controls Field or control Description Sources Sets the input sources for the plot. The number of source fields listed depends on the plot. XY, XYZ, Eye Diagram Select the plot type to add to the screen. Eye Diagram adds a TIE measurement badge to the Results bar and adds the eye diagram to the screen. -
Page 241: Results Tables Operations Overview
Menus and dialog boxes Results Tables operations overview Results tables list summaries of all active measurements, bus decode activity, and search results in a spreadsheet format. Use Results tables to quickly compare values or save the results to a report. Results Table - general operations. - Page 242 Menus and dialog boxes Measurement Table menu. Field or control Description Column Visibility panel Label Adds a Label column to show the user-defined label for all measurements. If no user-defined label exists, the column shows the default measurement name. Peak-to-Peak Adds a Peak-to-Peak column and shows a Pk-Pk readout for all relevant measurements.
-
Page 243: Save As Configuration Menu (Measurement Results Table)
Menus and dialog boxes Measurements Results Table operations. Double-tap anywhere on a results table to open its configuration menu. ■ To configure or delete a single measurement in a Measurement Results table, touch and hold on a table row to open a right- ■... -
Page 244: Search Results Table Menu
Menus and dialog boxes Search Results table menu Use this menu to configure the content of the Search results table. To open the Search Results Table configuration menu, double-tap anywhere in the Search Results table. If there are multiple search results tables, tap the tab of the search table to configure and then double-tap anywhere in that table. Search Results Table menu. -
Page 245: Bus Decode Results Table Configuration Menu
Menus and dialog boxes Search Results Table operations. If there are multiple searches, each search has a tab in the table. Tap the tab of the search to display and/or configure, and ■ then double-tap anywhere in that table to open the configuration menu for that table. Double-tap anywhere on a results table to open its configuration menu. -
Page 246: Save As Configuration Menu (Bus Decode Results Table)
Menus and dialog boxes Bus Decode Results Table operations. Each bus in a Bus Decode Results table has its own tab. Tap a tab to show the results for that bus. ■ Selecting a Bus in the Bus Decode Table configuration menu does not select and display the tab for that bus. Select a tab ■... -
Page 247: Harmonics Results Table Configuration Menu (Optional)
Menus and dialog boxes Harmonics Results table configuration menu (optional) Use this configuration menu to select the information to be displayed in the Harmonics Results Table, or save a Harmonics table to a file. To open the Harmonics Results Table configuration menu, double-tap anywhere in the Harmonics Results table. NOTE. -
Page 248: Annotation And Navigation On Waveform Plots/Data And Results Table (Optional)
Menus and dialog boxes Save As configuration menu (Harmonics Results Table). Field or control Description Save Location Sets the location to save the file. The default value is the last location to which a file was saved. Tap on the file path and use a keyboard to enter the location Use and external keyboard or double-tap on the file name to open the on-screen keyboard and enter the path details. -
Page 249: Navigation On Bar Graph And Harmonics Results Table (Optional)
Menus and dialog boxes NOTE. supports an annotation feature that marks the minimum value of R with a line in each switching cycle. ■ DS(on) DS(on) When R is added, a Math waveform is created. Math (resistance curve) equation can be a V/I or ΔV/ ΔI based on the ■... -
Page 250: Bus Search Configuration Menus
Menus and dialog boxes Other search types Bus Search configuration menus on page 230 Edge Search configuration menu on page 250 Logic search configuration menu on page 251 Pulse Width Search configuration menu on page 253 Rise/Fall Time Search configuration menu on page 255 on page 257 Runt Search configuration menu... -
Page 251: Arinc 429 Serial Bus Search Configuration Menu
Menus and dialog boxes Other search types. Edge Search configuration menu on page 250 Logic search configuration menu on page 251 Pulse Width Search configuration menu on page 253 Rise/Fall Time Search configuration menu on page 255 on page 257 Runt Search configuration menu Setup and Hold Search configuration menu on page 258... - Page 252 Menus and dialog boxes Field or control Description Data Sets the data pattern for which to search. Tap the Binary, Hex, or Octal field and use the A and B knobs to select and change the values. Or double-tap on the field and use the virtual keypad to enter values. Available when Mark When = Data or Label &...
-
Page 253: Audio Serial Bus Search Configuration Menu
Menus and dialog boxes Audio serial bus search configuration menu Use the Audio Search configuration menu to define conditions to search for and mark on an Audio bus waveform. You can have multiple searches on the same bus. NOTE. Requires option SRAUDIO. Field or control Description Display... -
Page 254: Can Serial Bus Search Configuration Menu
Menus and dialog boxes CAN serial bus search configuration menu Use the CAN Search configuration menu to define conditions to search for and mark on an CAN bus waveform. You can have multiple searches on the same bus. NOTE. Requires option SRAUTO. Field or control Description Display... -
Page 255: Ethernet Serial Bus Search Configuration Menu
Menus and dialog boxes Field or control Description Mark When Sets the mark when condition. Only available when Mark On = Data or ID & Data. A, B knob controls Use the A knob to select (highlight) the digit to change. Use the B knob to change the value of the digit. - Page 256 Menus and dialog boxes Field or control Description IP Protocol Sets the IP protocol pattern for which to search. Tap a Binary or Hex field and use the A and B knobs to select and change the values. Or double-tap on the field and use the virtual keypad to enter values. Only available when Mark On = IP Header.
-
Page 257: Flexray Serial Bus Search Configuration Menu
Menus and dialog boxes Field or control Description Mark When Sets the mark when condition. When set to Inside Range or Outside Range, fields are displayed to set a high and low boundary pattern for the specified search range. Tap the Binary or Hex field and use the A and B knobs to select and change the values. Or double-tap on the field and use the virtual keypad to enter values. - Page 258 Menus and dialog boxes Field or control Description Cycle Count Enter the cycle count pattern for which to search. Use in conjunction with the Mark When field to specify the exact search condition. Tap the Binary, Hex, or Decimal field and use the A and B knobs to select and change the values.
-
Page 259: I2C Serial Bus Search Configuration Menu
Menus and dialog boxes Field or control Description A, B knob controls Use the A knob to select (highlight) the digit(s) to change. Use the B knob to change the value of the digit(s). Copy Trigger Settings to Sets the search criteria to match the current oscilloscope trigger settings. Search Copy Search Settings to Sets the current oscilloscope trigger settings to match the search criteria. -
Page 260: Lin Serial Bus Search Configuration Menu
Menus and dialog boxes Field or control Description A, B knob controls Use the A knob to select (highlight) the character to change. Use the B knob to change the value of the character. Copy Trigger Settings to Sets the search criteria to match the current oscilloscope trigger settings. Search Copy Search Settings to Sets the current oscilloscope trigger settings to match the search criteria. -
Page 261: Mil-Std-1553 Serial Bus Search Configuration Menu
Menus and dialog boxes Field or control Description Copy Trigger Settings to Sets the search criteria to match the current oscilloscope trigger settings. Search Copy Search Settings to Sets the current oscilloscope trigger settings to match the search criteria. Trigger MIL-STD-1553 serial bus search configuration menu Use the MIL-STD-1553 Search configuration menu to define conditions to search for and mark on an XxMIL-STD-1553X bus waveform. - Page 262 Menus and dialog boxes Field or control Description Subaddress/Mode Sets the subaddress or mode value for which to search. Tap the Binary, Hex, or Decimal field and use the A and B knobs to select and change the values. Or double-tap on the field and use the virtual keypad to enter values. Only available when Mark On = Command and Mark When RT Address = Inside Range or Outside Range High Address...
-
Page 263: Parallel Bus Search Configuration Menu
Menus and dialog boxes Parallel bus search configuration menu Use the Parallel Search configuration menu to define conditions to search for and mark on an Parallel bus waveform. You can have multiple searches on the same bus. NOTE. Parallel bus search is standard on all instruments. Field or control Description Display... -
Page 264: Sent Serial Bus Search Configuration Menu
Menus and dialog boxes Field or control Description A, B knob controls Use the A knob to select (highlight) the digit(s) to change. Use the B knob to change the value of the digit(s). Copy Trigger Settings to Sets the search criteria to match the current oscilloscope trigger settings. Search Copy Search Settings to Sets the current oscilloscope trigger settings to match the search criteria. - Page 265 Menus and dialog boxes Field or control Description Counter Sets the condition and value of the counter data for which to search. Tap the down arrow and select the condition for which to search (=, ≠, >, <, ≥, ≤). The default is Tap the Binary or Hex field and use the A and B knobs to select and change the values.
-
Page 266: Spi Serial Bus Search Configuration Menu
Menus and dialog boxes Field or control Description CRC Type Sets the CRC error type for which to search. Available when Mark On = Error and Error Type = CRC. Copy Trigger Settings to Sets the search criteria to match the current oscilloscope trigger settings. Search Copy Search Settings to Sets the current oscilloscope trigger settings to match the search criteria. -
Page 267: Spmi Serial Bus Search Configuration Menu
Menus and dialog boxes SPMI serial bus search configuration menu Use the SPMI Search configuration menu to define conditions for which you want to search and mark on an SPMI bus signal. You can have multiple searches on the same bus. NOTE. -
Page 268: Usb Serial Bus Search Configuration Menu
Menus and dialog boxes Field or control Description No Response Sets to search on data that is all zeros (no response). All values in the Data field are set to zero and cannot be edited. Available when Mark On = Master Read, Register Read, Extended Register Read, Ext. Register Read Long, DD Block Master Read, DD Block Slave Read, or Transfer Bus Ownership. - Page 269 Menus and dialog boxes Field or control Description Endpoint Sets the token packet endpoint pattern for which to search. Use in conjunction with the Mark When field to specify the exact search condition. Tap the Binary, Hex, or Decimal field and use the A and B knobs to select and change the values.
-
Page 270: Edge Search Configuration Menu
Menus and dialog boxes Edge Search configuration menu Use the Edge search to mark when the specified edge condition occurs on an analog, digital, math, or reference waveform. To create a new edge search: Tap Add New... Search. Set the Search Type to Edge. Select the search Source. -
Page 271: Logic Search Configuration Menu
Menus and dialog boxes Logic search configuration menu Use the Logic search to mark when specified logic conditions occur on an analog, digital, math, or reference waveform. To create a new logic search: Tap Add New... Search. Set the Search Type to Logic. Use the menu fields to set the search parameters. - Page 272 Menus and dialog boxes Logic Search configuration menu fields and controls. Field or control Description Display Sets the display of the mark icons on or off. If you have multiple searches defined, the control turns off just the marks for the selected search. Stop Acquisition if Event Stops input acquisition when the search event occurs.
-
Page 273: Logic Search - Define Inputs Configuration Menu
Menus and dialog boxes Other search types. Bus Search configuration menus on page 230 Edge Search configuration menu on page 250 Pulse Width Search configuration menu on page 253 on page 255 Rise/Fall Time Search configuration menu Runt Search configuration menu on page 257 Setup and Hold Search configuration menu on page 258... - Page 274 Menus and dialog boxes Pulse Width Search menu fields and controls. > Field or control Description Display Sets the display of the mark icons on or off. If you have multiple searches defined, the control turns off just the marks for the selected search. Stop Acquisition if Event Stops input acquisition when the search event occurs.
-
Page 275: Rise/Fall Time Search Configuration Menu
Menus and dialog boxes Other search types. Bus Search configuration menus on page 230 Edge Search configuration menu on page 250 Logic search configuration menu on page 251 on page 255 Rise/Fall Time Search configuration menu Runt Search configuration menu on page 257 Setup and Hold Search configuration menu on page 258... - Page 276 Menus and dialog boxes Rise/Fall Time Search configuration menu fields and controls. Field or control Description Display Sets the display of the mark icons on or off. If you have multiple searches defined, the control turns off just the marks for the selected search. Stop Acquisition if Event Stops input acquisition when the search event occurs.
-
Page 277: Runt Search Configuration Menu
Menus and dialog boxes Runt Search configuration menu Use the Runt search to mark a waveform where a pulse crosses one threshold but fails to cross a second threshold before recrossing the first threshold. To create a new runt search: Tap Add New... -
Page 278: Setup And Hold Search Configuration Menu
Menus and dialog boxes Other search types. Bus Search configuration menus on page 230 Edge Search configuration menu on page 250 Logic search configuration menu on page 251 on page 253 Pulse Width Search configuration menu Rise/Fall Time Search configuration menu on page 255 Setup and Hold Search configuration menu on page 258... - Page 279 Menus and dialog boxes Setup & Hold Search configuration menu fields and controls. Field or control Description Display Sets the display of the mark icons on or off. If you have multiple searches defined, the control turns off just the marks for the selected search. Stop Acquisition if Event Stops input acquisition when the search event occurs.
-
Page 280: Setup And Hold Search - Define Inputs Configuration Menu
Menus and dialog boxes Setup and Hold Search - Define Inputs configuration menu Use the Define Inputs menu to select the data signal source(s) and set their threshold level(s). To open the Setup & Hold Search - Define Inputs menu: Double-tap a Setup &... - Page 281 Menus and dialog boxes Timeout Search menu fields and controls. Field or control Description Display Sets the display of the mark icons on or off. If you have multiple searches defined, the control turns off just the marks for the selected search. Stop Acquisition if Event Stops input acquisition when the search event occurs.
-
Page 282: Window Search Configuration Menu
Menus and dialog boxes Window Search configuration menu Use the Window search to mark a waveform when the signal rises above an upper threshold level or falls below a lower threshold level (the 'window'), with or without a time limit constraint. To create a new window search: Tap Add New... - Page 283 Menus and dialog boxes Window Search menu fields and controls. Field or control Description Display Sets the display of the mark icons on or off. If you have multiple searches defined, the control turns off just the marks for the selected search. Stop Acquisition if Event Stops input acquisition when the search event occurs.
-
Page 284: Analog Channel Configuration Menu
Menus and dialog boxes Other search types. Bus Search configuration menus on page 230 Edge Search configuration menu on page 250 Logic search configuration menu on page 251 on page 253 Pulse Width Search configuration menu Rise/Fall Time Search configuration menu on page 255 Runt Search configuration menu on page 257... -
Page 285: Probe Setup Panel (Channel Configuration Menu)
Menus and dialog boxes Field or control Description Bandwidth Limit Tap to select the bandwidth limit from the drop-down list. Bandwidth Filter Optimized Tap to select a bandwidth filter that is optimized for flatness or step response. Flatness selects a brick-wall filter optimized for flatness within band with a sharp rolloff. Flatness filtering is not compatible with Peak Detect and Envelope acquisition modes. - Page 286 Menus and dialog boxes Probe Setup panel fields and controls. Available fields and controls vary with the type of probe that is attached. For more information, consult the probe documentation. Field or control Description Probe Information View probe information such as probe type, serial number, and its attenuation. Probe Compensation Status View the probe compensation status: Default, Pass, or Fail.
-
Page 287: Unsupported Probe Dialog
Menus and dialog boxes Unsupported Probe dialog This dialog tells you that you have attached an unsupported probe. To open the Unsupported Probe dialog: Double-tap a Channel badge to open the channel configuration menu. Tap the Probe Setup panel. Read the Probe Information. If you have attached an unsupported probe, remove the unsupported probe and attach a supported probe to the input channel. -
Page 288: Tdp7700 Probe Compensation Menu (Analog Channels Probe Setup Panel)
Menus and dialog boxes TDP7700 probe compensation menu (analog channels Probe Setup panel) Use this menu to compensate TDP7700 probes. This menu is only available when a TDP7700 probe is installed on the channel. Compensating TDP7700 probes requires the optional TEK-CDA probe compensation and deskew accessory. To open the Probe Compensation dialog: Double-tap the Channel badge on the Settings bar to open the channel configuration menu. -
Page 289: Deskew Configuration Menu (Other Panel, Channel Configuration Menu)
Menus and dialog boxes Other panel fields and controls. Field or control Description Deskew Sets or displays the probe deskew value. Set to 0 Sets the probe deskew value to zero (0) seconds. Multi-Channel Opens a Deskew configuration menu that allows you to deskew multiple channels (two at a time). - Page 290 Menus and dialog boxes Deskew menu fields and controls. Available fields and controls vary with the type of probe that is attached. For more information, consult the probe documentation. Field or control Description From Source Tap and select from the drop-down list the channel to deskew from (your reference channel for deskewing).
-
Page 291: Afg Configuration Menu
Menus and dialog boxes AFG configuration menu Use the AFG configuration menu to set the output signal parameters for the optional arbitrary/function generator. Use the AFG to simulate signals within a design or add noise to signals to perform margin testing. To open the AFG configuration menu: If Off, tap the AFG button on the Settings bar. -
Page 292: Cursor Configuration Menu
Menus and dialog boxes Field or control Description Low Level Sets the low signal amplitude of the waveform using the keypad or multipurpose knob. Load Impedance Tap to select either 50 Ω or High Z (1 MΩ) output load impedance. Add Noise Tap the check box to toggle noise on and off. - Page 293 Menus and dialog boxes Cursor configuration menu fields and controls Some fields or controls are only available when certain other controls are selected. Field or control Description Display Tap to toggle the cursor display On or Off. Cursor Type Tap to select the cursor type from the drop-down list. Waveform cursors measure vertical amplitude and horizontal time parameters simultaneously at the point the cursor crosses a waveform.
-
Page 294: Date And Time Configuration Menu
Menus and dialog boxes Date and Time configuration menu Use this menu to set the date, time format, and time zone. To open the Date and Time configuration menu, double-tap on the Date/Time badge in the lower-right corner of the oscilloscope display. -
Page 295: Draw A Box Menu
Menus and dialog boxes Right-click menu differences A right click (touch and hold) on the digital FlexChannel waveform handle opens a menu to turn off that instrument channel, configure the overall digital channel settings, or add a label to the digital FlexChannel. A right click (touch and hold) on the handle of individual digital bits in a digital channel waveform opens a menu to turn off that digital bit, configure the overall digital channel settings, or add a label to the individual bit. - Page 296 Menus and dialog boxes DVM configuration menu fields and controls Field or control Description Display Tap to toggle the DVM badge On and Off. Autorange Tap to toggle autoranging On and Off. Autorange is not available when the oscilloscope is triggering on the same channel that is being measured.
-
Page 297: Menu Bar Overview
Menus and dialog boxes Menu bar overview The Menu bar provides access to file, utility, and help functions. The Menu bar Field or control Description File Provides typical system file management operations such as opening, saving, moving, and renaming files. Recall configuration menu (File menu) on page 278. -
Page 298: Recall Configuration Menu (File Menu)
Menus and dialog boxes Recall configuration menu (File menu) Use this menu to recall (load) reference waveforms, instrument setups, and sessions (setup plus waveforms). To open the file Recall configuration menu: Tap File on the menu bar. Tap Recall to open the Recall configuration menu. File operations and Microsoft Windows 10 Operating System SSD. - Page 299 Menus and dialog boxes Recall configuration menu fields and controls. Field or control Description Look in: Shows the current directory path to the location of a file. Tap on the file path and use a keyboard to enter a new save location. Or double-tap on the file name to open the virtual keyboard and enter a path.
-
Page 300: Save As Configuration Menu (File Menu)
Menus and dialog boxes USB port drive names and locations. Use the following table to determine which drive to select when navigating to and/or selecting a file on system memory or a connected USB memory device. Drive name Drive letter Drive or physical USB port location MSO54, MSO56, MSO58, MSO64, without Windows OS Root drive... - Page 301 Menus and dialog boxes Saving files with the front-panel User button. Pushing the front-panel User button automatically saves the file type last selected in the Save As configuration menu. If no saves have been performed since the instrument power-up, pushing the User button opens the Save As configuration menu.
- Page 302 Menus and dialog boxes Save As configuration menu fields and controls. The following fields and controls are common to all Save As actions. Field or control Description File save type Tabs on the left let you set which type of file to save (Screen Capture, Waveform, Setup, Report, or Session).
- Page 303 Menus and dialog boxes Waveform tab fields and controls. The following settings are specific for saving a waveform. Field or control Description File save type Tap the Waveform tab to save waveform(s) to a file. Selecting Waveform sets the file extensions in the Save As Type field to available waveform file formats.
-
Page 304: Browse Save As Location Configuration Menu
Menus and dialog boxes Report tab fields and controls. The following settings are specific for saving an instrument report. A report can include information on instrument settings, measurement results, screen images, individual measurement configuration, source input settings, and error and warning information for measurements. Reports are either a PDF file or a single file Web page. - Page 305 Menus and dialog boxes Browse Save As Location configuration menu fields and controls. Field or control Description File path field Shows the current directory. Tap on the file path and use a keyboard to enter a new path. Or double-tap on the file name to open the virtual keyboard and enter a path.
-
Page 306: File Utilities Configuration (File Menu)
Menus and dialog boxes File Utilities configuration (File menu) Use this menu to copy, paste, delete, and rename files, and unmount memory devices from USB ports. To access the File Utilities configuration menu, select File > File Utilities from the Menu bar. File operations and Microsoft Windows 10 Operating System SSD. - Page 307 Menus and dialog boxes File Utilities configuration menu fields and controls. Field or control Description File path field Shows the current directory. Tap on the file path and use a keyboard to enter a new save location. Or double-tap on the file name to open the virtual keyboard and enter a path.
-
Page 308: Mount Network Drive Configuration Menu
Menus and dialog boxes USB port drive names and locations. Use the following table to determine which drive to select when navigating to and/or selecting a file on system memory or a connected USB memory device. Drive name Drive letter Drive or physical USB port location MSO54, MSO56, MSO58, MSO64, without Windows OS Root drive... -
Page 309: Undo, Redo (Edit Menu)
Menus and dialog boxes Mount Network Drive configuration menu fields and controls. Field or control Description Drive Letter Shows the current list of available (unassigned) drive letters. Tap on the list and select a drive letter to assign to the network drive. Specify Server Sets how you specify the server location;... - Page 310 Menus and dialog boxes Display panel fields and controls. Field or control Description Displayed Colors Tap and select either Normal or Inverted colors to set how the instrument displays waveforms and plots. Normal shows waveforms and plots in color with a back background. Inverted makes the waveform background white, with graticule marking in black.
- Page 311 Menus and dialog boxes Autoset panel fields and controls. Field or control Description Autoset Adjusts Selects which controls to change as part of the Autoset operation (Vertical Settings, Horizontal Settings, Trigger Settings, and Acquisition Settings). The default is for all adjustments to be enabled.
- Page 312 Menus and dialog boxes Measurements panel fields and controls. Field or control Description Shared Reference Levels Tap to select either Global or Per Source reference levels. Global applies the same reference levels to all measurement sources. Per Source allows selection of a different reference levels for all measurement sources. Calculate Reference Levels Tap to select how often to calculate reference levels.
-
Page 313: I/O (Utility Menu)
Menus and dialog boxes Jitter and Eye Analysis panel fields and controls. Field or control Description Calculate Reference Levels Tap to select calculating the reference levels on the first acquisition or on every acquisition. Horizontal Measurement Tap to select horizontal measurement units of seconds or unit intervals. Units Jitter Separation Model Tap to select the jitter separation model (Spectral Only or Spectral + BUJ). - Page 314 Menus and dialog boxes LAN panel fields and controls. Field or control Description LAN Status A readout that indicates the status of the LAN connection, either a Green circle with the word Normal or a Red circle with an error message. Host Name The instrument host name is displayed.
- Page 315 Menus and dialog boxes Socket Server panel fields or controls. Use the following socket server settings to set up and use a socket server between your oscilloscope and a remote terminal or computer. Field or control Description Socket Server Tap to toggle the socket server On or Off. Protocol Tap to select a protocol, either None or Terminal.
-
Page 316: Lan Reset Configuration Menu (Utility > I/O Menu)
You can type in more queries and view more results using this Telnet session window. You can find the syntax for relevant commands, queries and related status codes in the Programmer Manual that is available at the Tektronix website. NOTE. Do not use the computer’s backspace key during an MS Windows Telnet session with the oscilloscope. -
Page 317: Self Test Configuration Menu (Utility Menu)
If one or more tests fail at power-on, tap on Run Self Test and see if the test or tests continue to fail. If tests continue to fail, contact your nearest Tektronix Service Center for help with resolving the problem. -
Page 318: Calibration Configuration Menu (Utility Menu)
If an instrument becomes uncalibrated, this displays an Uncalibrated status and a red Warning message bar is shown at the top of the screen in the Menu bar area. Contact your nearest Tektronix Service Center for assistance. SPC Status Indicates the status of the last SPC run (Pass or Failed). Also indicates how long ago the last SPC was run. -
Page 319: Teksecure Erase Memory
Menus and dialog boxes NOTE. TekSecure does not erase calibration constants or instrument firmware. TekSecure Erase Memory ® Use this menu to use the TekSecure function to erase the oscilloscope nonvolatile memory. To open the Security menu and run TekSecure: Tap Utility in the Menu bar. -
Page 320: Enter Password Configuration Menu (Optional)
Passwords and sending the instrument for service. If you need to send the instrument for service or repair, make sure to use the Clear Password function in the Change Password menu before sending to the Tektronix Service Center. Failure to do so may impede servicing the instrument. -
Page 321: Set Password Configuration Menu (Optional)
Passwords and sending the instrument for service. If you need to send the instrument for service or repair, make sure to use the Delete Password function in the Change Password menu before sending to the Tektronix Service Center. Failure to do so may impede servicing the instrument. -
Page 322: Change Password Configuration Menu (Optional)
Passwords and sending the instrument for service. If you need to send the instrument for service or repair, make sure to use the Clear Password function before sending to the Tektronix Service Center. Failure to do so may impede servicing the instrument. -
Page 323: Help
Menus and dialog boxes Demo menu fields and controls. Field or control Description Demo overview pane The upper half of the menu shows an overview of the demonstration available in the selected panel. This pane may also contain a screen shot showing the waveforms and capability being demonstrated. -
Page 324: Location To Save Exit Key Configuration Menu
Description System information Provides system-related information such as model, bandwidth, serial number, Host ID, and installed firmware version. Provide this information when communicating with Tektronix to purchase option licenses or communicate with Customer Support. Probes Detected Lists probes connected to the instrument. TekVPI probes will list the probe model, serial number, and installed probe firmware version. - Page 325 Menus and dialog boxes Location to Save Exit Key configuration menu fields and controls. Field or control Description Look in Shows the current directory path at which to save the exit key file. Tap on the file path and use a keyboard to enter a new path. Or double-tap on the file name to open the on-screen keyboard and enter a path.
-
Page 326: Browse License Files Menu (Help > About)
Menus and dialog boxes Browse License Files menu (Help > About) Use this menu to select and install an option license file to enable new functions. To access the Browse License Files menu: Tap Help > About... on the menu bar. Tap Install License button to open the Browse License Files configuration menu. - Page 327 Menus and dialog boxes Browse License Files configuration menu fields and controls. Field or control Description Look in Shows the current directory path and file name. Tap on the file path and use a keyboard to enter a new path. Or double-tap on the file name to open the on-screen keyboard and enter a path.
-
Page 328: Horizontal Configuration Menu
Menus and dialog boxes Horizontal configuration menu Use this menu to select the horizontal mode, set horizontal parameters, and enable trigger delay. To open the Horizontal configuration menu, double-tap the Horizontal badge in the Settings bar. Horizontal configuration menu fields and controls Field or control Description Horizontal Mode... - Page 329 Menus and dialog boxes Field or control Description Maximum Record Length Tap and select the Maximum Record Length from the drop-down list. Record length is dependent on the Scale setting. If changing the scale causes the record length to exceed the maximum record length Limit, the sample rate is decreased to the next available setting to keep the record length below the set maximum.
-
Page 330: Math Configuration Menu Overview
Menus and dialog boxes Field or control Description Sample Rate Tap to set the Sample Rate using the assigned multipurpose knob, double-tap to set the rate using the virtual keypad, or tap the up and down arrows. This keeps the oscilloscope at the specified sample rate regardless of the horizontal or record length settings. - Page 331 Menus and dialog boxes Math configuration menu fields and controls. Field or control Description Display Turns the math waveform or FFT plot On or Off. Vertical Scale Sets the vertical graticule scale units. Tap the arrows to change the value, tap and use the assigned multipurpose knob to change values, or double-tap to open the virtual keypad to enter a specific value.
-
Page 332: Equation Editor (Math Configuration Menu)
Menus and dialog boxes Field or control Description Math n = Lists the last-accessed advanced equation. Tap the down arrow to display a list of the last- accessed equations (up to a maximum of 20) created by the Equation Editor. Select an equation to display that math waveform. -
Page 333: Add Filter Menu (Math Equation Editor)
Menus and dialog boxes Equation Editor menu fields and controls. Field or control Description Sources Lists all available sources that you can add to an equation. Tap a source icon to add it to the cursor position in the Math x = input box. Drag the sources field up or down to scroll through selections. -
Page 334: Add Variable Menu (Math Equation Editor)
Menus and dialog boxes Add Filter menu fields and controls. Field or control Description Filter Type Sets the filter type: High Pass, Low Pass, or ArbFlt (arbitrary filter). ArbFlt requires you to load a FLR-format filter file. If loading a filter file, tap Load to navigate to and select the FLR file to load. Cutoff Frequency Sets the filter cutoff frequency as a predefined fraction of the sample rate (SR). -
Page 335: Add Functions (Math Equation Editor)
Menus and dialog boxes Add Functions (math Equation Editor) Use the Add Functions controls to add predefined math operations to your equation. Button Description Integral. Inserts the text INTG( into the math expression. Enter an argument to the function. The integral function produces the integral of the argument. - Page 336 Menus and dialog boxes Button Description Absolute. Inserts the text FABS( into the math expression. The FABS function takes the absolute value of the expression. FFT Real. Inserts the text FftReal( into the math expression. Select one of the waveforms as an argument to the function.
-
Page 337: Font Color Menu (Text Settings Configuration)
Menus and dialog boxes Font Color menu (Text Settings configuration) Use this menu to change the label color. Touch and hold on note or label text, select Format Text in the right-click menu, and select Color to open this menu. Click on a color to change the text color. Text Settings configuration menu (Note and Waveform labels text) Use this menu to change and format existing Note or Waveform labels (font type and size, color, bold, italic, and underline). -
Page 338: Eye Diagram Plot Configuration Menu
Menus and dialog boxes Eye Diagram plot configuration menu Use this menu to change settings of a displayed Eye Diagram plot. To open the Eye Diagram plot menu, double-tap anywhere in the Eye Diagram plot view. Settings panel (Eye Diagram plot configuration menu) fields and controls. Field or control Description AutoScale... -
Page 339: Fastframe Timestamp Trend Plot Configuration Menu
Menus and dialog boxes FastFrame Timestamp Trend plot configuration menu Use this menu to change settings of a displayed FastFrame Timestamp plot. To open the FastFrame Timestamp plot configuration menu, double-tap anywhere in a FastFrame Timestamp Plot view. FastFrame Timestamp plot configuration menu fields and controls. Field or control Description AutoScale... -
Page 340: Math Fft Plot Configuration Menu (Math Waveform)
Menus and dialog boxes Math FFT plot configuration menu (Math waveform) Use the Math FFT plot menu to change settings of a displayed FFT plot, including source, FFT window type, plot type, and gating. To open the FFT plot configuration menu, double-tap anywhere in the Math FFT Plot view. Plot Settings panel (Math FFT plot configuration menu) fields and controls. - Page 341 Menus and dialog boxes FFT Settings panel (Math FFT plot configuration menu) fields and controls. Field or control Description FFT Type Magnitude plots the magnitude values of the frequency components. Phase plots the phase of the signal as a function of frequency. Window Sets the FFT window type to use for the waveform plot.
- Page 342 The Tek Exponential window was invented at Use this window for impulse-response testing where Tektronix. In the time domain, it is not asymmetrical the 20% position is the zero phase reference point. bell shape as is the case with the other windows.
-
Page 343: Histogram Plot Configuration Menu
Menus and dialog boxes Histogram plot configuration menu Use this menu to change settings of a displayed Histogram plot. To open the Histogram plot configuration menu, double-tap anywhere in a Histogram Plot view. Settings panel (Histogram plot configuration menu) fields and controls. Field or control Description AutoScale... -
Page 344: Bathtub Plot Configuration Menu
Menus and dialog boxes Closing a plot view. To close (delete) a Plot view, tap the X in the upper right corner of the view. Deleting the Measurement badge that enabled the plot also closes the plot. Bathtub plot configuration menu Use this menu to change settings of a displayed jitter versus BER (bathtub) plot. -
Page 345: Spectrum Plot Configuration Menu
Menus and dialog boxes Save panel fields and controls. Use the Save panel controls to save the plot image or date to a file, for inclusion in reports or further analysis in other applications. Field or control Description Save Plot Image Tap to open the Save As menu. - Page 346 Menus and dialog boxes Settings panel (Spectrum plot configuration menu) fields and controls. Field or control Description AutoScale Toggles Autoscale on or off. Turn AutoScale off to set the X and Y-axis range to view an area of interest. When AutoScale is off, a small Zoom window appears in the plot. Drag the blue zoom area box in the small Zoom window to view that area in the main Plot view.
-
Page 347: Trend Plot Configuration Menu
Menus and dialog boxes Save panel fields and controls. Use the Save panel controls to save the plot image or date to a file, for inclusion in reports or further analysis in other applications. Field or control Description Save Plot Image Tap to open the Save As menu. -
Page 348: Plot Xy Configuration Menu
Menus and dialog boxes Plot XY configuration menu Use this menu to change settings of a displayed XY plot. To open the XY plot menu, double-tap anywhere in the XY Plot view. Settings panel (Plot XY configuration menu) fields and controls. Field or control Description X-Axis... -
Page 349: Harmonics Bar Graph Plot Configuration Menu (Optional)
Menus and dialog boxes Save panel fields and controls. Use the Save panel controls to save the plot image or date to a file, for inclusion in reports or further analysis in other applications. Field or control Description Save Plot Image Tap to open the Save As menu. -
Page 350: Inductance Curve Configuration Menu (Magnetic Analysis Power Measurement) (Optional)
Menus and dialog boxes Save panel fields and controls. Use the Save panel controls to save the plot image or date to a file, for inclusion in reports or further analysis in other applications. Field or control Description Save Plot Image Tap to open the Save As menu. -
Page 351: Bh Curve Configuration Menu (Magnetic Analysis Power Measurement) (Optional)
Menus and dialog boxes Save panel fields and controls. Use the Save panel controls to save the plot image or date to a file, for inclusion in reports or further analysis in other applications. Field or control Description Save Plot Image Tap to open the Save As menu. - Page 352 Menus and dialog boxes Settings panel (BH Curve configuration menu) fields and controls. Field or control Description AutoScale Toggles AutoScaleOn or Off. Turn AutoScale of to manually set the X and Y-axis range to view an area of interest. When AutoScale is Off, a small Zoom window appears in the plot. Drag the blue vertical bar in the Zoom window to view that area in the main Plot view.
-
Page 353: I Vs (Integral Of) V Plot Configuration Menu (Magnetic Analysis Power Measurement) (Optional)
Menus and dialog boxes I vs (integral of) V plot configuration menu (Magnetic Analysis power measurement) (optional) Use this menu to change settings of a displayed I vs. ∫V plot (I vs. ∫V measurement). To open the I vs. ∫V plot configuration menu, double-tap anywhere in the I vs. ∫V Plot view. Settings panel (I vs. -
Page 354: Power Plots And Cursors
Menus and dialog boxes Power plots and cursors Use cursors in I vs. ∫V and BH curve plots to take measurements at any point on these power measurement plot waveforms. Displaying I vs. ∫V and BH curve power plots is optional. Cursor readouts display the voltage and current values at their position and the difference (delta) between the cursors. -
Page 355: Soa Plot Configuration Menu (Optional)
Menus and dialog boxes SOA plot configuration menu (optional) Use this menu to change settings of a displayed SOA (XY) plot. To open the SOA (XY) plot menu, double-tap anywhere in the SOA Plot view to open the configuration. Settings panel (SOA plot configuration menu) fields and controls. Field or control Description AutoScale... -
Page 356: Trajectory Plot Configuration Menu (Switching Loss Power Measurement) (Optional)
Menus and dialog boxes Trajectory plot configuration menu (Switching Loss power measurement) (optional) Use this menu to change settings of a displayed SWL (Switching Loss) Trajectory plot. To open the Trajectory plot menu, double-tap anywhere in the Plot view. Settings panel (Trajectory plot configuration menu) fields and controls. Field or control Description AutoScale... -
Page 357: Save As Configuration Menu (Plot Save Panel, Save Plot Image Button)
Menus and dialog boxes Save As configuration menu (plot Save panel, Save Plot Image button) Use this menu to specify the name and location at which to save an image file for the selected plot. To access the Save As configuration menu to save an image of a plot to a file: Double-tap anywhere in a Plot view top open the plot configuration menu. -
Page 358: Reference Waveform Configuration Menu
Menus and dialog boxes Save As configuration menu (plot Save panel, Save Plot Data button) fields and controls. Field or control Description Save Location Lists the location where the file will be saved. The default value is the last location to which a file was saved. -
Page 359: Recall Configuration Menu (Ref Waveform Configuration Menu)
Menus and dialog boxes Field or control Description Reference File Shows the path and file name of the current Reference waveform. Double-tap the field to open the on-screen keyboard to enter or edit the path to open a different waveform file. Tap the down arrow icon to list the 20 most recently accessed reference waveform files. - Page 360 Menus and dialog boxes Recall configuration menu (Ref configuration menu) fields and controls. Field or control Description Look in Shows the current directory path and file name. Tap on the file path and use a keyboard to enter a new path. Or double-tap on the file name to open the virtual keyboard and enter a path.
-
Page 361: Search Configuration Menu
Menus and dialog boxes Search configuration menu Use the Search configuration menu to define conditions that you want to search for on a channel or waveform signal. Each occurrence of the search condition is marked on the signal with a triangle along the top of the waveform slice or view. To open the Search menu, double-tap on a Search badge in the Results bar. -
Page 362: Bus Trigger Configuration
Menus and dialog boxes Bus Trigger configuration Use the Bus trigger menus to trigger on bus-related events (Start, Stop, Missing Ack, Address, Data, and so on). NOTE. You must add a bus to the Waveform view before you can trigger on it. Add a math, reference, or bus waveform page 93. -
Page 363: Arinc 429 Serial Bus Trigger Settings Panel
Menus and dialog boxes ARINC 429 serial bus trigger settings panel NOTE. Requires option SRAERO. Field or control Description Source Select the ARINC429 bus on which you want to trigger. Trigger On Select the type of information on which to trigger. Trigger When Label Trigger when the label data meets the specified condition Available when Trigger On = Label. - Page 364 Menus and dialog boxes Field or control Description Sets to trigger when the specified Sign/Status Matrix (SSM) bit condition occurs. Tap the Binary or Hex field and use the A and B knobs to select and change the values. Or double-tap on the field and use the virtual keypad to enter values.
- Page 365 DUT. Only available if you have installed the DVM option, which is available when you register your instrument with Tektronix. MSO54, MSO56, MSO58, MSO58LP, MSO64 Help...
-
Page 366: Audio Serial Bus Trigger Settings Panel
Menus and dialog boxes Audio serial bus trigger settings panel NOTE. Requires option SRAUDIO. Field or control Description Source Select the Audio bus on which to trigger. Trigger On Select the type of information on which to trigger. Data Sets the data pattern on which to trigger. Use in conjunction with the Trigger When field to specify the exact trigger condition. - Page 367 DUT. Only available if you have installed the DVM option, which is available when you register your instrument with Tektronix. MSO54, MSO56, MSO58, MSO58LP, MSO64 Help...
-
Page 368: Can Serial Bus Trigger Settings Panel
Menus and dialog boxes CAN serial bus trigger settings panel NOTE. Requires option SRAUTO. Field or control Description Source Select the CAN bus on which you want to trigger. Trigger On Select the type of information on which to trigger. Frame Type Sets the frame type on which to trigger. - Page 369 DUT. Only available if you have installed the DVM option, which is available when you register your instrument with Tektronix. MSO54, MSO56, MSO58, MSO58LP, MSO64 Help...
-
Page 370: Ethernet Serial Bus Trigger Settings Panel
Menus and dialog boxes Ethernet serial bus trigger settings panel NOTE. Requires option SRENET. Field or control Description Source Select the Ethernet bus on which to trigger. Trigger On Select the type of information on which to trigger. MAC Address Destination, Sets the MAC destination and/or source address pattern on which to trigger. - Page 371 Menus and dialog boxes Field or control Description Ack Number Sets the TCP header ack number pattern on which to trigger. Tap a Binary, Hex or Decimal field and use the A and B knobs to select and change the values.
- Page 372 DUT. Only available if you have installed the DVM option, which is available when you register your instrument with Tektronix. MSO54, MSO56, MSO58, MSO58LP, MSO64 Help...
-
Page 373: Flexray Serial Bus Trigger Settings Panel
Menus and dialog boxes FlexRay serial bus trigger settings panel NOTE. Requires option SRAUTO. Field or control Description Source Select the FlexRay bus on which to trigger. Trigger On Select the type of information on which to trigger. Indicator Bits Select the indicator bits type on which to trigger. - Page 374 Menus and dialog boxes Field or control Description Trigger When Sets the trigger when condition. When set to Inside Range or Outside Range, fields are displayed to set a high and low boundary pattern for the specified trigger type. Tap the Binary or Hex field and use the A and B knobs to select and change the values. Or double-tap on the field and use the virtual keypad to enter values.
- Page 375 DUT. Only available if you have installed the DVM option, which is available when you register your instrument with Tektronix. MSO54, MSO56, MSO58, MSO58LP, MSO64 Help...
-
Page 376: I2C Serial Bus Trigger Settings Panel
Menus and dialog boxes I2C serial bus trigger settings panel NOTE. Requires option SREMBD. Field or control Description Source Select the I C bus on which to trigger. Trigger On Select the type of information on which to trigger. Direction Sets the transfer direction on which to trigger (Read, Write, Either). - Page 377 DUT. Only available if you have installed the DVM option, which is available when you register your instrument with Tektronix. MSO54, MSO56, MSO58, MSO58LP, MSO64 Help...
-
Page 378: Lin Serial Bus Trigger Settings Panel
Menus and dialog boxes LIN serial bus trigger settings panel NOTE. Requires option SRAUTO. Field or control Description Source Select the LIN bus on which to trigger. Trigger On Select the type of information on which to trigger. Identifier Sets the identifier pattern on which to trigger. Tap the Binary, Hex, or Decimal field and use the A and B knobs to select and change the values. - Page 379 DUT. Only available if you have installed the DVM option, which is available when you register your instrument with Tektronix. MSO54, MSO56, MSO58, MSO58LP, MSO64 Help...
-
Page 380: Mil-Std-1553 Serial Bus Trigger Settings Panel
Menus and dialog boxes MIL-STD-1553 serial bus trigger settings panel NOTE. Requires option SRAERO. Field or control Description Source Select the MIL-STD-1553 bus on which you want to trigger. Trigger On Select the type of information on which to trigger. Sync Sets to trigger on a Sync condition. - Page 381 Menus and dialog boxes Field or control Description Status Word Bits Sets the status word pattern on which to trigger. Tap the Binary, Hex, or Decimal field and use the A and B knobs to select and change the values. Selecting a bit shows a short description of that bit's function. Or double-tap on the field and use the virtual keypad to enter values.
- Page 382 DUT. Only available if you have installed the DVM option, which is available when you register your instrument with Tektronix. MSO54, MSO56, MSO58, MSO58LP, MSO64 Help...
-
Page 383: Parallel Serial Bus Trigger Settings Panel
Menus and dialog boxes Parallel serial bus trigger settings panel NOTE. Parallel bus triggering is standard on all instruments. Field or control Description Source Select the type of information on which to trigger. Data Sets the data pattern on which to trigger. The number of bits shown depends on how the parallel bus is defined. - Page 384 DUT. Only available if you have installed the DVM option, which is available when you register your instrument with Tektronix. MSO54, MSO56, MSO58, MSO58LP, MSO64 Help...
-
Page 385: Serial Bus Trigger Settings Panel
Menus and dialog boxes RS-232 serial bus trigger settings panel NOTE. Requires option SRCOMP. Field or control Description Source Select the RS232 bus on which to trigger. Trigger On Select the type of information on which to trigger. Data Bytes Sets the number of data bytes (1 byte = 8 bits) on which to trigger (one to ten bytes). - Page 386 DUT. Only available if you have installed the DVM option, which is available when you register your instrument with Tektronix. MSO54, MSO56, MSO58, MSO58LP, MSO64 Help...
-
Page 387: Sent Serial Bus Trigger Settings Panel
Menus and dialog boxes SENT serial bus trigger settings panel NOTE. Requires option SRAUTOSEN. Field or control Description Source Select the SENT bus on which to trigger. Trigger On Select the type of information on which to trigger. Channel Sets the SENT channel type on which to trigger. Available when Trigger On = Start of Packet. - Page 388 Menus and dialog boxes Field or control Description Data Sets the condition and value of the slow channel data on which to trigger. Tap the down arrow and select the condition on which to trigger (=, ≠, >, <, ≥, ≤). The default is Tap the Binary or Hex field and use the A and B knobs to select and change the values.
- Page 389 DUT. Only available if you have installed the DVM option, which is available when you register your instrument with Tektronix. MSO54, MSO56, MSO58, MSO58LP, MSO64 Help...
-
Page 390: Spi Serial Bus Trigger Settings Panel
Menus and dialog boxes SPI serial bus trigger settings panel NOTE. Requires option SREMBD. Field or control Description Source Select the SPI bus on which you want to trigger. Trigger On Select the type of information on which to trigger. Data Words Sets the number of data words (1 word = 8 bits) on which to trigger (one to sixteen bytes). - Page 391 DUT. Only available if you have installed the DVM option, which is available when you register your instrument with Tektronix. MSO54, MSO56, MSO58, MSO58LP, MSO64 Help...
-
Page 392: Spmi Serial Bus Trigger Settings Panel
Menus and dialog boxes SPMI serial bus trigger settings panel NOTE. Requires option SRPM. Field or control Description Source Select the SPMI bus on which to trigger. Trigger On Select the type of information on which to trigger. Slave Address Sets the slave address value on which to trigger. - Page 393 Menus and dialog boxes Field or control Description Data Bytes Sets the number of data bytes on which to trigger. Tap the field and use the A knob to change the value. Or double-tap on the field and use the virtual keypad to enter a value. Available when Trigger On = Extended Register Read, Extended Register Write, Ext.
- Page 394 DUT. Only available if you have installed the DVM option, which is available when you register your instrument with Tektronix. MSO54, MSO56, MSO58, MSO58LP, MSO64 Help...
-
Page 395: Usb Serial Bus Trigger Settings Panel
Menus and dialog boxes USB serial bus trigger settings panel NOTE. Requires option SRUSB2. Field or control Description Source Select the USB bus on which to trigger. Trigger On Select the type of information on which to trigger. Handshake Type Sets the handshake packet type on which to trigger. - Page 396 Menus and dialog boxes Field or control Description Data Packet Type Sets the data packet type on which to trigger. Available when Trigger On = Data Packet. Data Bytes Sets the number of data bytes on which to trigger (one to two bytes). Tap the field and use the A knob to change the value.
- Page 397 DUT. Only available if you have installed the DVM option, which is available when you register your instrument with Tektronix. MSO54, MSO56, MSO58, MSO58LP, MSO64 Help...
-
Page 398: Edge Trigger Configuration Menu
Menus and dialog boxes Edge Trigger configuration menu Use the Edge Trigger menu to trigger the oscilloscope when a signal rises and/or falls through a specified level. To open the Edge trigger menu: Double-tap the Trigger badge on the Settings bar. Set the Trigger Type to Edge. - Page 399 DUT. Only available if you have installed the DVM option, which is available when you register your instrument with Tektronix. MSO54, MSO56, MSO58, MSO58LP, MSO64 Help...
-
Page 400: Logic Trigger Configuration Menu
Menus and dialog boxes Other trigger types. Bus Trigger Menu ■ Logic Trigger menu ■ Pulse Width Trigger menu ■ Rise Fall Time Trigger menu ■ Runt Trigger menu ■ Sequence Trigger menu ■ Setup and Hold Trigger menu ■ ■... - Page 401 Menus and dialog boxes Settings panel (Logic Trigger configuration menu) - fields and controls. Field or control Description Use Clock Edge? Enables or disables finding logic patterns that occur on the specified clock edge. Logic Pattern Define Inputs Opens the Logic Trigger - Define Inputs menu where you define the logic state (High, Low, or Don't Care), and the signal threshold level that defines the logic state (high or low), for each analog or digital signal.
- Page 402 DUT. Only available if you have installed the DVM option, which is available when you register your instrument with Tektronix. MSO54, MSO56, MSO58, MSO58LP, MSO64 Help...
-
Page 403: Logic Trigger - Define Inputs Configuration Menu
Menus and dialog boxes Other trigger types. Bus Trigger Menu ■ Edge Trigger menu ■ Pulse Width Trigger menu ■ Rise Fall Time Trigger menu ■ Runt Trigger menu ■ Sequence Trigger menu ■ Setup and Hold Trigger menu ■ ■... - Page 404 Menus and dialog boxes Settings panel (Pulse Width Trigger configuration menu) fields and controls. Field or control Description Source Lists the source channel or waveform to use to trigger or search. Types that require multiple inputs will replace this control with a different source definition control. Trigger When <...
- Page 405 DUT. Only available if you have installed the DVM option, which is available when you register your instrument with Tektronix. MSO54, MSO56, MSO58, MSO58LP, MSO64 Help...
-
Page 406: Rise/Fall Time Trigger Configuration Menu
Menus and dialog boxes Other trigger types. Bus Trigger Menu ■ Edge Trigger menu ■ Logic Trigger menu ■ Rise Fall Time Trigger menu ■ Runt Trigger menu ■ Sequence Trigger menu ■ Setup and Hold Trigger menu ■ ■ Timeout Trigger menu Window Trigger menu ■... - Page 407 DUT. Only available if you have installed the DVM option, which is available when you register your instrument with Tektronix. MSO54, MSO56, MSO58, MSO58LP, MSO64 Help...
-
Page 408: Runt Trigger Configuration Menu
Menus and dialog boxes Other trigger types. Bus Trigger Menu ■ Edge Trigger menu ■ Logic Trigger menu ■ Pulse Width Trigger menu ■ Runt Trigger menu ■ Sequence Trigger menu ■ Setup and Hold Trigger menu ■ ■ Timeout Trigger menu Window Trigger menu ■... - Page 409 Menus and dialog boxes Settings panel (Runt Trigger configuration menu) fields and controls. Field or control Description Source Lists the source channel or waveform to use to trigger or search. Types that require multiple inputs will replace this control with a different source definition control. Trigger When Occurs: A runt signal event occurs.
- Page 410 DUT. Only available if you have installed the DVM option, which is available when you register your instrument with Tektronix. MSO54, MSO56, MSO58, MSO58LP, MSO64 Help...
-
Page 411: Sequence Trigger Configuration Menu
Menus and dialog boxes Other trigger types. Bus Trigger Menu ■ Edge Trigger menu ■ Logic Trigger menu ■ Pulse Width Trigger menu ■ Rise Fall Time Trigger menu ■ Sequence Trigger menu ■ Setup and Hold Trigger menu ■ ■... - Page 412 Menus and dialog boxes Settings panel (Sequence Trigger configuration menu) fields and controls. Field or control Description A Trigger Event Tap to open the A Trigger Event menu to select the first (A) event trigger condition. See Trigger Event configuration menu on page 394.
- Page 413 DUT. Only available if you have installed the DVM option, which is available when you register your instrument with Tektronix. Other trigger types. ■...
-
Page 414: A Trigger Event Configuration Menu
Menus and dialog boxes A Trigger Event configuration menu Use this menu to set the trigger conditions for the A trigger event of a Sequence trigger. To open the A Trigger Event menu: Double-tap the Trigger badge on the Settings bar. Set the Trigger Type to Sequence. -
Page 415: Setup And Hold Trigger Configuration Menu
Menus and dialog boxes B Trigger Event menu (Sequence Trigger configuration menu) fields and controls. Field or control Description Trigger Type Select the B event trigger type. Other fields and controls The fields and controls shown depend on the selected Trigger Type. Use the following links to access setting information on a specific trigger. - Page 416 DUT. Only available if you have installed the DVM option, which is available when you register your instrument with Tektronix. MSO54, MSO56, MSO58, MSO58LP, MSO64 Help...
-
Page 417: Setup And Hold Trigger - Define Inputs Configuration Menu
Menus and dialog boxes Other trigger types. Bus Trigger Menu ■ Edge Trigger menu ■ Logic Trigger menu ■ Pulse Width Trigger menu ■ Rise Fall Time Trigger menu ■ Runt Trigger menu ■ Sequence Trigger menu ■ ■ Timeout Trigger menu Window Trigger menu ■... - Page 418 Menus and dialog boxes Settings panel (Timeout Trigger configuration menu) fields and controls. Field or control Description Source Lists the source channel or waveform to use to trigger or search. Types that require multiple inputs will replace this control with a different source definition control. Trigger When Stays High: The signal stays above the specified threshold level longer than the specified ■...
- Page 419 DUT. Only available if you have installed the DVM option, which is available when you register your instrument with Tektronix. MSO54, MSO56, MSO58, MSO58LP, MSO64 Help...
-
Page 420: Logic Qualification - Define Inputs Configuration Menu
Menus and dialog boxes Other trigger types. Bus Trigger Menu ■ Edge Trigger menu ■ Logic Trigger menu ■ Pulse Width Trigger menu ■ Rise Fall Time Trigger menu ■ Runt Trigger menu ■ Sequence Trigger menu ■ ■ Setup and Hold Trigger menu Window Trigger menu ■... -
Page 421: Window Trigger Configuration Menu
Menus and dialog boxes Window Trigger configuration menu Use the Window Trigger to trigger when a signal rises above an upper threshold level or falls below a lower threshold level (the 'window'), with or without a time limit constraint. To open the Window trigger menu: Double-tap the Trigger badge on the Settings bar. - Page 422 Menus and dialog boxes Settings panel (Window Trigger configuration menu) fields and controls. Field or control Description Source Lists the source channel or waveform to use to trigger or search. Types that require multiple inputs will replace this control with a different source definition control. Trigger When Enters Window: The signal outside a window enters the window defined by the upper and ■...
- Page 423 DUT. Only available if you have installed the DVM option, which is available when you register your instrument with Tektronix. MSO54, MSO56, MSO58, MSO58LP, MSO64 Help...
-
Page 424: Visual Trigger Panel
Menus and dialog boxes Other trigger types. Bus Trigger Menu ■ Edge Trigger menu ■ Logic Trigger menu ■ Pulse Width Trigger menu ■ Rise Fall Time Trigger menu ■ Runt Trigger menu ■ Sequence Trigger menu ■ ■ Setup and Hold Trigger menu Timeout Trigger menu ■... -
Page 425: Virtual Keyboard
Menus and dialog boxes Virtual Keyboard Use the onscreen virtual keyboard to enter textual information such as a file path, file name, label text, or on-screen note. To access the virtual keyboard, double-tap in a menu or dialog text input box. Enter your text and tap Enter to close the keyboard and add your text to the menu or dialog field. -
Page 426: Virtual Keypad
Menus and dialog boxes Virtual Keypad Use the virtual Keypad to enter numeric values and units for settings. To open the virtual keypad, double-tap inside a field that requires numeric values. Virtual Keypad fields and controls Field or control Description Clear Clears all values from the input entry field. - Page 427 Menus and dialog boxes Field or control Description Vertical Center Sets the area vertical center, in amplitude units, as the point halfway between the topmost vertex and bottommost vertex. Flip Vertical Flips the area vertically around its Vertical Center value. Width Sets the area width, in time units, between the leftmost vertex and the rightmost vertex.
-
Page 428: Visual Trigger Area Combinatorial Logic Menu
Menus and dialog boxes Visual trigger right click menu Right click menu functions associated with visual trigger areas on page 409. Visual Trigger Area Combinatorial Logic menu Use the Area Combinatorial Logic menu to describe the logic conditions required for a true condition of all associated areas. To open the Visual Trigger Area Combinatorial Logic menu: Double-tap the Trigger badge. -
Page 429: Right Click Menu Functions Associated With Visual Trigger Areas
Menus and dialog boxes Right click menu functions associated with visual trigger areas The following functions are available when you right click on a visual trigger area. Field or control Description Sets the area's Waveform Must Be control to In. Sets the area's Waveform Must Be control to Out. - Page 430 Menus and dialog boxes Fields or controls Description Persistence Sets the length of time data points are displayed on screen before being erased. Off sets the record points to appear for the current acquisition only. Infinite continuously accumulates record points on the waveform until you change one of the acquisition display settings or clear the acquisition memory.
-
Page 431: Waveform Acquisition Concepts
Waveform acquisition concepts Acquisition concepts The Acquisition system sets which data points are used to acquire waveforms. Acquisition hardware Before a signal is displayed, it must pass through the input channel where it is scaled and digitized. Each channel has a dedicated input amplifier and digitizer. -
Page 432: Waveform Record
Waveform acquisition concepts Waveform record The instrument builds the waveform record through use of the following parameters: ■ Sample interval: The time between sample points. ■ Record length: The number of samples required to fill a waveform record. ■ Trigger point: The zero time reference in a waveform record. -
Page 433: Acquisition Modes
Waveform acquisition concepts Acquisition modes Acquisition is the process of sampling an analog signal, converting it into digital data, and assembling it into a waveform record, which is then stored in acquisition memory. The acquisition mode determines how the waveform record points are calculated from the sampled waveform data. -
Page 434: Fastframe Concepts
Waveform acquisition concepts Acquisition mode ™ FastFrame segmented memory acquisition uses multiple trigger events to capture widely spaced events of interest at high sample rates while conserving acquisition memory. Capturing thousands of frames is possible, allowing analysis of long-term trends and changes in the bursting signal. -
Page 435: Waveform Sample Interpolation
Waveform acquisition concepts The time stamps of all the frames can be output in tabular form for in-depth analysis using Excel or a wide variety of other popular software tools that read comma-delimited files (.CSV). NOTE. Enabling FastFrame mode disables FastAcq mode (if it was enabled). Likewise, enabling FastAcq mode disables FastFrame mode (if it was enabled). -
Page 436: Scaling And Positioning
Waveform acquisition concepts Scaling and positioning The scaling and positioning controls determine the portion of the input signal received by the acquisition system. Set vertical scaling, positioning, and DC offsets to display the features of interest on your waveform and to avoid clipping. Each waveform Slice or Graticule contains ten major divisions. -
Page 437: Horizontal Acquisition Considerations
Waveform acquisition concepts If the scale of a math waveform is changed so that the math waveform is clipped, it will affect the amplitude measurements on that math waveform as follows: ■ The vertical position adjusts the display of the graticule relative to the waveform display (position is a display control). That is all position does;... - Page 438 Waveform acquisition concepts MSO54, MSO56, MSO58, MSO58LP, MSO64 Help...
-
Page 439: Trigger Concepts
Trigger concepts Triggering concepts Overview User selected trigger conditions are used to capture waveforms for measurement and analysis. The next figure shows how triggers fit into the overall instrument operation. Triggers help you capture meaningful waveforms to display on screen. This instrument has simple edge triggers as well as a variety of advanced triggers. -
Page 440: Trigger Sources
Trigger concepts Trigger sources The trigger source provides the signal that triggers acquisition. Use a trigger source that is synchronized with the signal that you are acquiring and displaying. You can derive your trigger from the following sources: ■ Input channels. Analog input channels are the most commonly used trigger sources. You can select any of the input channels. -
Page 441: Trigger Modes
Trigger concepts CAN. Use to trigger on CAN Bus signals. ■ LIN. Use to trigger on LIN bus signals. ■ FlexRay. Use to trigger on FlexRay bus signals. ■ USB. Use to trigger on USB bus signals. ■ Ethernet. Use to trigger on Ethernet bus signals. ■... -
Page 442: Trigger Coupling
Trigger concepts The Holdoff setting range is 0 s (minimum holdoff available) to 10 s (maximum holdoff available). For more information on how to set holdoff, see on page 119. If you select Auto holdoff, the instrument selects a holdoff value for you. When Set Trigger Holdoff Trigger Holdoff is set to Random, the instrument delays the trigger a random amount of time between triggers. -
Page 443: Trigger Delay
Trigger concepts Trigger delay Use the Trigger Delay to trigger the instrument a specified period of time after the A trigger. After the A trigger arms the trigger system, the instrument triggers on the next B trigger event that occurs after the time that you specify. You can trigger with the A trigger system alone or you can combine the A trigger with the B (Delayed) trigger to trigger on sequential events. -
Page 444: Pulse Width Trigger Concepts
Trigger concepts Pulse width trigger concepts A pulse width trigger occurs when the instrument detects a pulse that is inside or outside some specified time range. The instrument can trigger on positive or negative width pulses. Pulse width triggers can also be qualified by the logical state of other channels. -
Page 445: Rise/Fall Time Trigger Concepts
Trigger concepts Setup/hold triggering uses the setup/hold violation zone to detect when data is unstable too near the time it is clocked. Each time trigger holdoff ends, the instrument monitors the data and clock sources. When a clock edge occurs, the instrument checks the data stream it is processing (from the data source) for transitions occurring within the setup/hold violation zone. - Page 446 Trigger concepts The visual trigger Area menu enables more precise editing of each Visual Trigger area. You can set exact coordinates for the vertices of each area in amplitude and time values, and assign the area to a specified signal source (channel). The menu also lets you set the logic condition for each shape (the waveform must be inside the area, outside the area, or don't care).
-
Page 447: Waveform Display Concepts
Waveform display concepts Waveform display overview This instrument includes a flexible, customizable display that lets you control how waveforms appear. The figure shows how the display features fit into the overall instrument operation. The display shows analog, digital, math, reference and bus waveforms. The waveforms include channel markers, individual waveform graticule readings, and trigger source and level indicators. - Page 448 Waveform display concepts MSO54, MSO56, MSO58, MSO58LP, MSO64 Help...
-
Page 449: Measurement Concepts
Measurement concepts Measurement variables By knowing how the instrument makes calculations, you may better understand how to use your instrument and how to interpret your results. The instrument uses a variety of variables in its calculations. These include: Definition of Base and Top Base is the value used as the 0% level in measurements such as fall time and rise time. - Page 450 Measurement concepts It makes a histogram of the record with one bin for each digitizing level. It splits the histogram into two sections at the halfway point between Min and Max (also called Mid). The level with the most points in the upper histogram is the Top value, and the level with the most points in the lower histogram is the Base value.
- Page 451 Measurement concepts Edge calculations Edge1, Edge2, and Edge3 refer to the first, second, and third Mid reference edge times, respectively. An edge can be detected when the waveform is either rising or falling past Midref. The direction of the edges alternates, that is, if Edge1 is rising, Edge2 will be falling.
-
Page 452: Missing Or Out-Of-Range Samples
Measurement concepts Missing or out-of-range samples If some samples in the waveform are missing or off-scale, the measurements will interpolate between known samples to make an appropriate guess as to the sample value. Missing samples at the ends of the measurement record will be assumed to have the value of the nearest known sample. - Page 453 Measurement concepts This instrument supports mathematical combination and functional transformations of waveforms it acquires. The next figure shows this concept: You create math waveforms to support the analysis of your channel and reference waveforms. By combining and transforming source waveforms and other data into math waveforms, you can derive the data view that your application requires. Create math waveforms that result from: ■...
-
Page 454: Math Waveform Elements
Measurement concepts Math waveform elements You can create Math waveforms from the following: ■ Channel waveforms ■ Reference waveforms ■ Measurement scalars (automated measurements) that measure channel, reference, or math waveforms, or histograms. ■ Other math waveforms ■ Variables ■ Filters Dependencies In general, math waveforms that include sources as operands are affected by updates to those sources:... -
Page 455: Guidelines For Working With Math Waveforms
Measurement concepts Guidelines for working with math waveforms Use the following guidelines when working with math waveforms: ■ Keep math waveforms simple. If the math expression becomes too complex, try separating the expression into more than one math waveform and then combining the waveforms (for example, Math1 = Math2 + Math4). ■... -
Page 456: Math Waveform Differentiation
Measurement concepts Math waveform differentiation The math capabilities of the instrument include waveform differentiation. This allows you to display a derivative math waveform that indicates the instantaneous rate of change of the waveform acquired. Derivative waveforms are used in the measurement of slew rate of amplifiers and in educational applications. You can create a derivative math waveform and then use it as a source for another derivative waveform. -
Page 457: Waveform Integration
Measurement concepts Waveform integration The math capabilities of the instrument include waveform integration. This allows you to display an integral math waveform that is an integrated version of the acquired waveform. Use integral waveforms in the following applications: ■ Measuring power and energy, such as in switching power supplies. ■... -
Page 458: Fft Process
Measurement concepts FFT process The FFT process mathematically converts the standard time-domain signal (repetitive or single-shot acquisition) into its frequency components. The FFT function processes the waveform record and displays the FFT frequency domain record, which contains the input signal frequency components from DC (0 Hz) to ½... -
Page 459: Blackman-Harris Fft Window Concepts
Measurement concepts If you have a variable-frequency signal source, another way to observe aliasing is to adjust the frequency slowly while watching the spectral display. If some of the harmonics are aliased, you will see the harmonics decreasing in frequency when they should be increasing or vice versa. -
Page 460: Flattop2 Window
Measurement concepts Flattop2 window This window has the lowest scallop loss of any of the windows. It also has a wider resolution bandwidth but lower side lobe attenuation. Also, it is unique because the time domain shape has negative values. NOTE. -
Page 461: Hanning Fft Window
Measurement concepts Hanning FFT window FFT windows have various resolution bandwidths and scallop losses (see the figure below). Choose the one that best allows you to view the signal characteristics you are interested in. The Hanning window has the narrowest resolution bandwidth, but higher side lobes. Hanning has slightly poorer frequency resolution than Hamming. -
Page 462: Hamming Window
Measurement concepts Hamming window This window is unique in that the time domain shape does not taper all the way to zero at the ends. This makes it a good choice if you wanted to process the real and imaginary parts of the spectrum off line and inverse transform it back to the time domain. Because the data does not taper to zero, you can remove the effect of the window function from the result. -
Page 463: Rectangular Window
Measurement concepts Rectangular window This window is equal to unity (see the next figure). This means the data samples in the gate are not modified before input to the spectral analyzer. Rectangular windows are best for measuring transients or bursts where the signal levels before and after the event are nearly equal. -
Page 464: Tek-Exponential Window
Measurement concepts Tek-Exponential window In the time domain, it is not a symmetrical bell shape as is the case with the other windows. Instead, it is exponential with a peak at the 20% position of the time domain gate. The frequency domain shape is triangular. NOTE. -
Page 465: Measurement Algorithms
Measurement algorithms Amplitude measurement algorithms AC RMS measurement algorithm AC RMS is the true Root Mean Square of the data points about the Mean (µ). This measurement can be made across the entire record or on each cycle in the record. Area measurement algorithm Area is the arithmetic area for one waveform. -
Page 466: Maximum Measurement Algorithm
Measurement algorithms where s is the sample interval. Similarly, W(t) is the sampled waveform Ŵ(t) is the continuous function obtained by interpolation of W(t) A and B are numbers between 0.0 and RecordLength – 1.0 If A and B are integers, then: where s is the sample interval. -
Page 467: Minimum Measurement Algorithm
Measurement algorithms Minimum measurement algorithm Minimum is the minimum data point. Typically the most negative peak voltage. Negative Overshoot measurement algorithm Negative Overshoot is the difference between Minimum and Base, divided by the amplitude. It is the percent that the waveform goes below base. -
Page 468: Timing Measurement Algorithms
Measurement algorithms Timing measurement algorithms Burst Width measurement algorithm Burst Width is the duration of a series of adjacent crossings of the mid reference level. The duration of a burst. Bursts are separated by a user-defined idle time. Data Rate measurement algorithm Data Rate is the reciprocal of Unit Interval. -
Page 469: Frequency Measurement Algorithm
Measurement algorithms The following figure shows a falling edge with the two edges necessary to calculate a Fall measurement. The figure shows the default high reference level which is 90% of Top and the default low reference level which is 10% of Base. Searching from Start to End, find the first sample in the measurement zone greater than HighRef. -
Page 470: Hold Time Measurement Algorithm
Measurement algorithms Hold Time measurement algorithm Hold Time is the time between the mid reference level crossing of the clock source (Source1) and the next mid reference level crossing of the data source (Source2). The crossings (edges) may be configured to be rising, falling or either. The application calculates this measurement using the following equation: Where: THold is the hold time. -
Page 471: Negative Duty Cycle Measurement Algorithm
Measurement algorithms If the Signal Type is Data. The N–Period measurement calculates the elapsed time for N consecutive unit intervals. The application calculates this measurement using the following equation: Where: NPData is the duration for N unit intervals. TData is the VRefMid crossing time in either direction. If Tn+NData does not exist for a given n, no measurement is recorded for that position. -
Page 472: Positive Duty Cycle Measurement Algorithm
Measurement algorithms (Skew/Period)*360 When "from" edge is either, the calculation is (Skew/half-Period)*180. Positive Duty Cycle measurement algorithm Positive Duty Cycle is the ratio of the positive pulse width to the signal period, expressed as a percentage. PositiveWidth is defined in Positive Pulse Width, following. Positive Pulse Width measurement algorithm Positive Pulse Width is the time the signal remains above the mid reference level. -
Page 473: Setup
Measurement algorithms Setup Setup Time is the time between the mid reference level crossing of the clock source (Source1) and the closest previous mid reference level crossing of the data source (Source2). The crossings (edges) may be configured to be rising, falling or either. The application calculates this measurement using the following equation: Where: T Setup is the setup time. -
Page 474: Time Outside Level Measurement Algorithm
Measurement algorithms T Main is the Main input Mid reference crossing time in the configured direction. T 2nd is the 2nd input Mid2 reference crossing time in the configured direction. Time Outside Level measurement algorithm Time Outside Level is the time the signal remains above the high reference level and/or below the low reference level. Unit Interval measurement algorithm Unit Interval is the time difference between two successive bits. -
Page 475: Bit Amplitude Measurement Algorithm
Measurement algorithms Bit Amplitude measurement algorithm Bit Amplitude is the difference between the levels of the "1" and "0" bits surrounding each transition, measured over a specified range at the center of the recovered unit interval. This measurement is made on each transition bit (Mean) or across the entire record (Mode). -
Page 476: T/Nt Ratio Measurement Algorithm
Measurement algorithms If the Signal Type is Data. The application calculates Data TIE measurement using the following equation: Where: TIEData is the data time interval error. TData is the Mid reference crossing time in either direction. T'Data is the corresponding edge time for the specified reference clock. The subscript k is used to indicate that there is one measurement per actual edge. -
Page 477: F/2 Measurement Algorithm
Measurement algorithms F/2 measurement algorithm F/2 is the peak-to-peak amplitude of the periodic jitter occurring at a rate of Fb (data rate) divided by 2. This measurement is made across the entire record. F/4 measurement algorithm F/4 is the peak-to-peak amplitude of the periodic jitter occurring at a rate of Fb (data rate) divided by 4. This measurement is made across the entire record. -
Page 478: Rj 66 Measurement Algorithm
Measurement algorithms Periodic Jitter (PJ) is the peak-to-peak amplitude for that portion of the deterministic jitter which is periodic, but for which the period is not correlated with any data pattern in the waveform. A single PJ value is determined for each acquisition, by means of RJ-DJ separation analysis. -
Page 479: Eye Low
Measurement algorithms NOTE. This illustration shows how the measurement is made, and does not represent how the oscilloscope actually displays an eye diagram or histograms on an eye diagram plot. Eye low Eye Low calculates the voltage at the selected horizontal position across the unit interval, for all Low bits in the waveform. A histogram of the Eye Low measurement corresponds to a vertical slice through the lower half of a three-dimensional eye diagram. -
Page 480: Eye Width Measurement Algorithm
Measurement algorithms Eye Width measurement algorithm Eye Width is the minimum horizontal eye opening at the user-specified reference level. This measurement is made across the entire record. Height@BER Height@BER is the Eye Height at a specified Bit Error Rate (BER). This extrapolated value predicts a vertical eye opening that will be violated with a probability equal to the BER. - Page 481 Measurement algorithms Power Quality measurement algorithm. The Power Quality measurement calculates the Frequency and RMS values of the voltage and current, Crest Factors of the voltage and current, True Power (TrPwr), Reactive Power (RePwr), Apparent Power (ApPwr), Power Factor (PF), and Phase Angle (θ) of the AC signal. RMS Voltage: The application calculates the RMS voltage using the following equation: ■...
- Page 482 Measurement algorithms ■ Reactive Power (RePwr): The reactive power or the imaginary power delivered to and temporarily stored in the reactive (inductive or capacitive) elements of the load, measured in units of Volt-Amperes-Reactive or VAR. The application calculates the Reactive power using the following equation: Where, RePwr is the Reactive Power, Volt-Amperes-Reactive or VAR.
- Page 483 Measurement algorithms Where, σ is the Phase Angle, Degree. MSO54, MSO56, MSO58, MSO58LP, MSO64 Help...
- Page 484 Measurement algorithms Harmonics algorithm. Harmonics are the sinusoidal voltages or currents having frequencies that are integer multiples of the frequency at which the supply system is designed to operate (termed the fundamental frequency). Distorted waveforms can be decomposed into sum of the fundamental frequency and its harmonics. ■...
- Page 485 Measurement algorithms ■ Total Harmonic distortion (THD-F): It is measured as the ratio to the RMS value of the fundamental component of the source waveform. Reported as a percentage and calculated using the following equation: ■ Total Harmonic Distortion (THD-R): It is measured as a ratio to the RMS value of the source waveform. Reported as a percentage and calculated using the following equation: ■...
-
Page 486: Amplitude Analysis Measurement Algorithms
Measurement algorithms If, Rel[k] < 0 & Im[k] > 0 Phase[k] = Phase[k] + π ■ Partial Odd Harmonics Current (POHC(M)): For the 21st standard higher odd order harmonics, the average values obtained for each individual odd harmonic over the full observation period, are calculated from the acquired waveform. -
Page 487: Timing Analysis Measurement Algorithms
Measurement algorithms Timing analysis measurement algorithms Frequency measurement algorithm. Frequency is the reciprocal of the period. Frequency is typically measured in Hertz (Hz) where 1 Hz = 1 cycle per second. Frequency = 1 / Period Negative Duty Cycle measurement algorithm. Negative Duty Cycle is the ratio of the negative pulse width to the signal period, expressed as a percentage. - Page 488 Measurement algorithms Switching Loss algorithm. Switch-Mode Power Supply (SMPS) design has three types of losses, they are Turn-On (T ), Turn- off (T ), and Conduction loss (Cond). To achieve the maximum efficiency, losses should be reduced. This section details about the basics of Switching Loss Analysis.
- Page 489 Measurement algorithms Where, is the Turn on loss of the i switching cycle, in watt. is the Turn off loss of the i switching cycle, in watt. OFFi fswi is the Switching frequency of the ith switching cycle, in Hz. -Stop ) is the stop point of T region of the i...
- Page 490 Measurement algorithms Nc is the Number of conduction cycles. To measure conduction loss in a BJT/IGBT, using the following equation: Where, V (sat) is the voltage in volt, which should be configure in application. ■ Computation of Average Loss and Total Loss Average and Total loss are calculated using the following equation: Total Switching Loss=Ton Loss+Toff Loss+Conduction Loss Concept to identify Ton and Toff using gate voltage for edge analysis:...
- Page 491 Measurement algorithms dv/dt algorithm. dv/dt represents the rate at which the voltage changes during switching. The application uses the math feature to provide a differentiation waveform of the voltage input. When you run the measurement, the application calculates dv/dt for the first edge by taking the default levels as 10% and 90% and displays the results.
-
Page 492: Magnetic Analysis Algorithms
Measurement algorithms Magnetic Analysis algorithms The Magnetic measurements include I vs. ∫V, Inductance, Magnetic Property, and Magnetic Loss. When using I vs. ∫V measurement, take care to check that the voltage ‘V’ does not have any DC components. Use the oscilloscope AC coupling to avoid any DC shifts on the integral of the voltage waveform. - Page 493 Measurement algorithms Magnetic Property algorithm. The following diagram shows a plot of Hysteresis in a typical magnetic material (magnetic field strength (H) versus saturation flux density (B)). Figure 12: BH Curve is the Saturation Flux Density is the Remanence Flux Density is the Coercive Force (Hc) is the Initial Permeability is the Max Amplitude permeability...
- Page 494 Measurement algorithms Index I where H is maximum I = Index of (Max(H)) = B(I) (2) Remanence (B Remanence is the Induced magnetic flux density that remains in the material after the externally applied magnetic field (H) is returned to zero during the generation of the hysteresis loop. This represents max value of B for all values of zero value of H in the B waveform.
-
Page 495: Output Analysis Algorithms
Measurement algorithms Output analysis algorithms Line Ripple algorithm. Line Ripple measures the voltage of a power supply which has been derived from an alternating current (AC) source, displaying the results as a peak-to-peak value and RMS value. In Line Ripple measurements, the time base is set to display three cycles of 50 Hz or 60 Hz in the input waveform. - Page 496 Measurement algorithms Turn Off Time. Turn Off Time is the time taken to get the output voltage to low level (close to zero) after the input voltage is removed. ■ The Maximum Voltage value should be greater than the Input Trigger level. ■...
-
Page 497: Power Badge Error And Warning Messages (Optional)
References Power badge error and warning messages (optional) These tables provide information to help resolve error or warning messages that appear on the power measurement badges. Error messages displayed on the power measurement badges Error Message Cause Suggestion Empty input The oscilloscope is waiting for Check that the oscilloscope has a valid input waveform. - Page 498 References Error Message Cause Suggestion Insufficient sampling rate Not enough sampling rate Increase the sample rate proportional to input signal frequency. used to capture signal Use Power Autoset to optimize the oscilloscope settings for power measurements. Too few cycles Not enough sampling rate Increase the sample rate proportional to input signal frequency.
- Page 499 References Error Message Cause Suggestion Too few edges No of edges found in the gated Increase the record length. region is less than the number of edges required for the algorithm for calculation. Pos clipping Vertical scale is not set Use Power Autoset to set the vertical scale automatically.
- Page 500 References Warning Message Cause Suggestion Invalid Mask Mask is not of the standard Recreate the mask from the SOA mask configure table such format, cannot have closed that inner mask coordinates do not intersect. mask coordinates or intersection of the coordinate points No data in range No data in the gated region.
- Page 501 Index add a vertex (visual trigger), 122 250 Kohm termination, 297 add filter (math waveform), 312 5-AFG, SUP5-AFG option, 13 Add Filter dialog, 313 5-SEC enhanced instrument security option, 14 add function to math equation, 315 5-WIN, SUP5-WIN option, 12, 13 add measurement statistical readouts to badge, 53 6-SEC enhanced instrument security option, 14 Add New...
- Page 502 Index RMS, 152 Burst Width, 154 Top, 152 Bus badge, 191, 192 Amplitude Measurements panel, 152 Bus button, 35 analog channels, 264 Bus Decode Results table, 221 annotations, 289 Bus Decode Table menu, 225 Arbitrary function generator (option 5-AFG, SUP5-AFG), 13 bus inputs, parallel, 208 arbitrary/function generator, 271, 272 bus menu, parallel, 207...
- Page 503 73 delay trigger, 423 connecting probes, 31 delete a measurement badge, 98 Constant Clock, 168 delete files, 286 contact Tektronix, 3 Demo, 302 Control windows deskew channels, 269 vertical acquisition, 416 copy files, 286 deskew probes, 78, 79...
- Page 504 Index disable LAN port (Opt 5-SEC), 299 Edit Vertices panel (Visual Trigger), 406–408 disable LAN port (Opt 6-SEC), 299 edit visual trigger area add a vertex, 122 disable USB ports (Opt 5-SEC), 299 move a vertex, 122 disable USB ports (Opt 6-SEC), 299 remove a vertex, 122 display a channel, 88 resize, 122...
- Page 505 Index Aux In, 35 F/4 measurement, 457 Aux Trig, 35 F/8 measurement, 457 Bus button (front panel), 35 factory calibration, 298 Channel buttons (front panel), 35 factory settings, 108 Clear button, 35 Fall slew rate, 448 Cursors button, 35 Fall Time, 154 Default Setup, 35 Falling Slew Rate, 154 description, 35...
- Page 506 Index GPIB talk/listen address, 75 horizontal mode, 308 graticule intensity, 105 horizontal scale, 308 graticule intensity, setting, 409 horizontal settings, 308 graticule style, 105, 130 host name, 293 graticule style, setting, 409 how to add a harmonics results table to the screen, 227 add a measurement, 94 add a measurement plot, 98 H Bar cursors, 272, 273...
- Page 507 Index recall a Session file., 144 termination, 415 recall an instrument setup, 143 Input Capacitance algorithms Input Capacitance algorithm, remote access the oscilloscope (from Web), 76 Input channel run signal path compensation (SPC), 67 trigger sources, 420 save a plot image to a file, 337 input signal level requirements, 25 save a report to a file, 141 Inrush Current algorithms...
- Page 508 Index knob A, 35 knob B, 35 MAC address, 293 Magnetic property label, measurement, 165, 176 BH Curve, 102 LAN, 293 marking waveform events, 104 LAN port (rear panel), 46 Math button, 35 LAN reset, 293 math editor, 435 LAN Reset, 296 Math equation, 432 LAN status, 293 math syntax, 435...
- Page 509 Index Edge1, 431 measurement filters, 137 Edge1Polarity, 431 measurement gates setting, 137 Edge2, 431 measurement interpolation mode, 289 Edge3, 431 measurement label, 165, 176 end, 430 measurement limits, 138 EndCycle, 431 Measurement Name panel, 165 frequency, 449 Measurement Results table, 221 HighRef, 430 Measurement Results table menu, 221 histogram method, 430...
- Page 510 Index Time Outside Level, 154 NPJ measurement, 457 Top, 152 numeric keypad, 406 Unit Interval, 154 Nyquist point, 438 memory erase, 299 menu Reference waveform, 338 Menu bar, 47 octal virtual keypad, 405 menu panels, 59 Offset menus, 59 math offset and position, 437 on screen keyboard, 405 MIL-STD-1553 bus trigger settings, 342 open acquisition menu, 87...
- Page 511 Index energy, 103 histogram, 100 packing list, 5 inductance, 102 palette (Fast Acq), 108 power, 103 plot a measurement, 98 Pan, 60 panels, menu, 59 Plot button, 47 plot data file, 337 parallel bus trigger, 120 plot image file, 337 parallel bus inputs, 208 plot menu parallel bus menu, 207...
- Page 512 Index power standby mode, 26 power cord, 46 power-on self tests, 297 security cable lock, 46 power-on test results, 27 USB Device port, 46 power, (Option 5-PWR, SUP5-PWR, 5-PS2), 16 USB Host ports, 46 power, (Option 6-PWR, SUP6-PWR, 6-PS2), 16 VGA video output, 46 powering on or off, 26 video outputs, 46...
- Page 513 Index resize an area (visual trigger), 122 waveform file, 140 Results bar, 47 save a plot image to a file, 337 results table (bus), 225 Save As dialog, 226, 280 Results Table button, 47 save bus decode results table to file, 226 results tables, 221 Save button, 35 return license, 303...
- Page 514 Index Timeout, 260 clock format (12/24 hr), 65 Window, 262 Date/Time badge display on, off, 65 Search menu GPIB talk/listen address, 75 Logic, 251 time zone, 65 search serial bus, 230 set measurement gates, 137 search tables and zoom mode, 132 set password (Opt 5-SEC), 301 searching for events, 104 set password (Opt 6-SEC), 301...
- Page 515 TekExp FFT window, 444 Top, 152 TekSecure, 298, 299 Touch Off button, 35 TekSecure memory erase, 299 touch screen tutorial, 303 Tektronix Technical Support, 3 touchscreen UI tasks, 61 TekVPI input connectors, 35 TPP0500B, 5 TekVPI probes, 7 TPP1000, 5...
- Page 516 Index logic, 380 USB, 293 parallel bus, 120 USB bus trigger settings, 342 position indicator, 48 USB cable, connect to PC, 75 pulse width, 383 USB Device port (rear panel), 46 rise/fall time, 386 USB Host ports (rear panel), 46 serial bus, 120 USB ports (front panel), 35 timeout, 397...
- Page 517 Index voltmeter, 275, 276 Waveforms math, 435 Volts per division waveforms, saving, 280 maximum, 415 Width@BER, 460 Window search menu, 262 window trigger, 401, 424 Wave Inspector, 132 Windows 10 operating system (option 5-WIN, SUP5-WIN), waveform 12, 13 expansion point, 48 Windows 10 operating system (option 6-WIN, SUP6-WIN), intensity, 105 12, 13...
- Page 518 Index MSO54, MSO56, MSO58, MSO58LP, MSO64 Help...
Need help?
Do you have a question about the 5 series and is the answer not in the manual?
Questions and answers