
Related Manuals for FISCHER FERITSCOPE FMP30


Summary of Contents for FISCHER FERITSCOPE FMP30
- Page 1 Operators Manual ® FERITSCOPE FMP30 Coating Thickness Material Analysis Microhardness Material Testing...
- Page 2 Page 2 Operators Manual FERITSCOPE ® FMP30...
- Page 3 All rights reserved. No part of this manual may be reproduced by any means (print, photocopy, microfilm, or any other method) or processed, multiplied or distributed by electronic means without the written consent of Helmut Fischer GmbH Institut für Elektronik und Messtechnik. Operators Manual FERITSCOPE ®...
-
Page 4: Table Of Contents
Table of Contents 1 Important Information ......9 Trademarks and Liabilities ..... . . 9 Symbols and Conventions Used in the Manual . - Page 5 Instrument: On/Off ......36 3.3.1 Measurement Method of the Connected Probe ..36 3.3.2 Power Up .
- Page 6 Corrective Calibration ......71 6.3.1 Selecting the Calibration Standards for the Corrective Calibration ......71 6.3.2 Corrective Calibration Procedure .
- Page 7 7.6.1 Turning the Free-Running Display Mode On/Off . . . 105 7.6.2 Procedure For Making Measurements With the Free-Running Display Mode ....106 7.6.3 Analog Display ......107 Measurements in Standard and Matrix Measuring Mode .
- Page 8 9.4.2 Control Commands ......142 Connecting a Printer ......146 9.5.1 Print Output .
- Page 9 10.7.4 Measuring Mode - Standard/Area Measurement/ Automatic Measurement ....182 10.7.5 Unit ........184 10.7.6 Measured Variable .
- Page 10 Page 10 Operators Manual FERITSCOPE ® FMP30...
-
Page 11: Important Information
Trademarks and Liabilities FERITSCOPE ® is a registered trademark of the Helmut Fischer GmbH Institute for Electronics and Metrology. The fact that the trademark characters ® and ™ may be missing does not indicate that a name is a free trademark. -
Page 12: Intended Use
FMP30 is to be used to determine the ferrite content of aus- tenitic and DUPLEX steel and to determine the portion of deformation martensite in austenitic materials. Only accessories recommended and approved by the Helmut Fischer GmbH In- stitute for Electronics and Metrology ( beginning on Page 23) may be connect- ed to this instrument. -
Page 13: Power Connection
AC adapter pro- vided by Helmut Fischer GmbH Institute for Electronics and Metrology. The line voltage must agree with the line voltage rating stated on the nameplate of the AC adapter. -
Page 14: Probe Handling
Because the instrument and accessories are not acid resis- tant, avoid direct contact with acid or acidic liquids. The instrument and accessories are not suited for operation in explosion-hazard areas! Protect the instrument and accessories from static charges! Electrical discharges may damage internal components or delete internal memories. -
Page 15: Handling, Storage And Transport Of The Base And The Calibration Standards
“Measurement Probes and Measure- ment Aids - Optimized Probes”). You can obtain this bro- chure from the Helmut Fischer GmbH Institute for Electronics and Metrology or from your authorized supplier. Handling, Storage and Transport of the Base and... -
Page 16: 1.10 Instrument Repairs
Helmut Fischer GmbH Institute for Electronics and Metrol- ogy. 1.11 Warranty The Helmut Fischer GmbH Institute for Electronics and Metrology will assume no warranties in the following instances: Use of instrument or accessories for purposes other than the intended use. -
Page 17: Description Of The Instrument
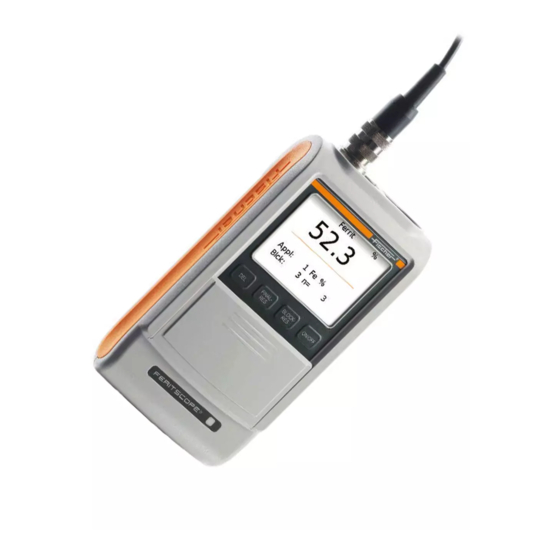
Description of the Instrument Probe connector socket, Page 33 LCD Display, Page 16 Keys for directly retrieving functions, Page 18 USB port for connecting a printer and a PC ON/OFF key to turn the in- strument on or off, Page 36 Connector socket for the AC adapter (included) Cover;... -
Page 18: Lcd-Display
LCD-Display The LCD display consists of several display elements. When powering up the in- strument using ON/OFF ( Page 36), all display elements will appear briefly at the same time. Fig. 2-2 Display elements of the LCD display after power up (example) Display element Explanation A normalization is performed (on the base of the calibra-... - Page 19 Display element Explanation Arrow circle: “Free-running display” is enabled, measurements are displayed continuously when the probe is placed on the specimen beginning on Page 104). Alternatively: Area measurement display Automatic measurement display Arrow up: Upper specification limit is exceeded. Arrow down: Measurement below lower specification limit.
-
Page 20: Control Panel Key Functions
Display element Explanation Chain: Applications that have been set up using the same probe are linked to each other, i.e., the same nor- malization and/or corrective calibration is used for deter- mining the measurements for these Applications beginning on Page 63). Sheets: Matrix measuring mode is enabled ( begin- ning on Page 111). - Page 21 The following overview provides a brief description of the functions of the indi- vidual control panel keys: Function Deletes the last measured reading Repeated pressing of DEL: Deletes the readings of the open block in succession. 2 x DEL: Deletes all readings ..
- Page 22 Function BLOCK-RES Retrieves the block result ( beginning on Page 125 Repeated pressing of BLOCK-RES: Displays the individual components of the block result (mean value, standard deviation, etc.) in succession. ∧ .. and then Ends the display of the block result (return to the measurement screen) without closing the open measurement block (the cur- rent measurement series can be continued).
- Page 23 Function ∧ With Application selection and tolerance limit input: Changes the information displayed on the LCD display. With the calibration: Sets the target value of the used calibra- tion standard that will be displayed after the “CAL Target” noti- fication. With parameter selection: Selects the desired parameters.
- Page 24 Function MENU Displaying and entering of the application-specific set- tings: Tolerance Limits Resolution Block size i individual values Outlier ∧ ∨ .. and then Selects the settings to be edited .. and then PRINT: Prints or displays a print form of the instrument configuration. ..
-
Page 25: Accessories
For available probe models and the probe model best suited for your application, see the respective probe data sheets of the brochure “Measurement Probes and Measurement Aids - Optimized Probes”. You can obtain this brochure from Helmut Fischer GmbH or from your authorized supplier. ® Operators Manual FERITSCOPE... -
Page 26: Base And Calibration Standards
(included with the probe) are available for each probe model and have been compiled specifically for this probe model. You can obtain additional calibration standards on request from Helmut Fischer GmbH Institute for Electronics and Metrology or from your authorized supplier. -
Page 27: Printer
10 mm from the center of the base or the cal- ibration standard, respectively. You can obtain information about available calibration standard sets from the Helmut Fischer GmbH Institute for Electronics and Metrology or from your au- thorized supplier. Certification of the Calibration Standards The Helmut Fischer GmbH Institute for Electronics and Metrology supplies cal- ibration standard sets complete with a valid certificate. -
Page 28: Technical Data
Technical Data Instrument model ® FERITSCOPE FMP30 Display Graphical backlit LCD display Measurable coat- Ferrite content measurements in weld seams and clad- ings dings made of austenitic or duplex steel Determination of the portion of deformation martensite in austenitic materials Measuring modes Magnetic induction measurement method Dimensions Instrument: 170 mm x 90 mm x 35 mm (L x W x H) -
Page 29: Contents Of Shipment And Options
It is also advisable to keep the packaging for future transport. Also verify that all components of the standard content of the shipment and all ordered options are present. Notify your authorized supplier or he Helmut Fischer GmbH Institute for Electronics or Metrology if this is not the case. -
Page 30: Options
2.5.2 Options Available options are: AC adapter Various measurement probes Master and corrective calibration standards sets %Fe/FN 1.5 V NiMh rechargeable battery (4 each/unit) Charger for NiMh battery Support stand V12 for reproducible positioning of measurement probes on the specimen Jig for angle probes for use in the support stand V12 (e.g., for probe FGABW 1.3) Jig for inside probes for use in the support stand V12 (e.g., for probe... -
Page 31: System Setup, Maintenance And Cleaning
System Setup, Maintenance and Clean- Connect or disconnect plug-type connectors only when the instrument is switched off in order to avoid electrical dis- charge. Connecting the AC adapter or inserting a battery should be done carried out with the unit turned off as well! Even a small discharge can delete the instrument memory. -
Page 32: Voltage Supply
To avoid damage to the instrument or wrong measurement results due to a wrong line voltage, the instruments must be connected to a power outlet only via the AC adapter provided by Helmut Fischer GmbH Institute for Electronics and Metrology. The line voltage must agree with the line voltage rating stated on the nameplate of the AC adapter. -
Page 33: Installing Or Replacing Batteries
3.1.2 Installing or Replacing Batteries Indicator for battery replacement. Batteries or rechargeable batter- ies should be replaced. If the battery voltage is too low, the instrument will turn off automatically. Procedure Battery Replacement Use ON/OFF ( ) to switch the instrument off (if not yet done). Page 36 Place the instrument with its back pointing up on the table. - Page 34 Close the battery compartment cover. Observe the cor- rect polarity when installing the bat- teries. Fig. 3-2 Inserting the batteries and closing the battery compartment cover Use only type MIGNON, 1.5 V, LR6 - AA - AM3 - MN1500 batteries or 4 individual rechargeable batteries 1.2 V 2400 mAh Type AA.
-
Page 35: Connecting Probes
Connecting Probes Connect probes only when the instrument is off! To turn the instrument off: Press the ON/OFF key on the right side of the control panel. The LCD display is not backlit and no characters are visi- ble. Protect the instrument and accessories from electrostatic charges! Electrical discharges may damage internal components or delete internal memories. - Page 36 When inserting the plug, ensure that the key of the plug fits into the groove of the socket. Otherwise, an erroneous con- nection between the instrument and the plug may occur or the contact pins of the probe plug may be damaged. Key (plug) Groove (socket) Fig.
- Page 37 Probe connector plug Connector socket Instrument Fig. 3-4 Connecting a probe Use ON/OFF to turn the instrument on again. The instrument automati- cally recognizes the type of probe connected to it. Exception: A flashing symbol for the measurement method on the LCD display indicates that the instrument does not recognize the connected probe.
-
Page 38: Instrument: On/Off
Instrument: On/Off To avoid erroneous readings, no metallic objects must be in close proximity to the probe tip when powering up the instrument. The minimum distance is 25 mm. 3.3.1 Measurement Method of the Connected Probe After powering up the instrument, the measurement method [Ferrite] appears on the LCD display. -
Page 39: Power Up
3.3.2 Power Up Key se- Detail of the LCD Explanation quence display ON/OFF Press the ON/OFF key to power up the in- strument. An audible signal will sound. A monitoring routine will run. All display el- ements of the LCD display will appear briefly at the same time ( Page 16). - Page 40 Detail of the LCD Explanation of the LCD displays after power up display No reading appears after powering up the instrument be- cause the last not closed block does not contain any read- ings. If the settings in the Service function Storage mode are [do not save] or [delete upon off], no reading will ap- pear upon power up as well because the readings have either not been stored at all or have been deleted when...
- Page 41 Detail of the LCD Explanation of the LCD displays after power up display The open Application is set to auto-averaging mode ( 5.6.4 ‘Auto-Averaging Mode’, beginning on Page 58 and 7.3.7 ‘Measurements in Auto-Averaging Mode’, beginning on Page 96). [i=]: Number of single readings measured using the auto- averaging / set number of single readings to be combined The open Application is set to the “free-running”...
-
Page 42: Measured Variables
Detail of the LCD Explanation of the LCD displays after power up display This error message appear briefly after power-up if no probe is connected to the instrument, if the probe is not connected properly or if the connected probe is defective. It is not possible to make measurements without a con- nected probe. -
Page 43: Switching Off The Instrument
3.3.4 Switching Off the Instrument Press the ON/OFF key switch the instrument off manually. The instrument shuts down automatically if for about 5 minutes no measurements are made or no key is pressed. Cleaning To avoid damage to the instrument due to electrical shock, the line plug of the AC adapter must be pulled before cleaning the instru- ment or the accessories! Soiled instruments or accessories should be cleaned using a plastic care product... -
Page 44: Probe Handling
Probe Handling Handling During Measurements Example: Probe FGAB1.3 Always hold the probe at its grip sleeve (right fig- Grip sleeve ure). Specimen Always place the probe gently and at a right angle on the specimen surface. Slide the grip sleeve to the specimen surface such that the sleeve rests on the specimen (center and bot- tom Figure, right). -
Page 45: Assigning A New Probe
Assigning a New Probe The instrument recognizes if the probe connected to the unit is different than the one expected according to the probe identification in the current Application. Reason: Each individual probe has a name that is comprised of the identification number and the model designation (e.g., FGAB 1.3F). - Page 46 Key sequ. / Detail of the LCD Explanation Action display Example: FGAB1.3F = Name of the con- nected probe ZERO DEL: Probe assignment starts ENTER: Probe will not be assigned, mea- surement method display flashes DEL: Probe will be assigned to all Applica- tions ENTER: The probe will be assigned only to the current Application...
-
Page 47: Applications
Applications All relevant settings and parameters for a measuring application as well as the captured measurement data are stored in a file - we refer to this file as an Appli- cation. The instrument has the capability of setting up up to 100 different Applications. A maximum of 20,000 readings can be stored in these Applications. - Page 48 As long as the restricted operating mode is enabled (indicated by on the LCD display), only Applications that have already been set up can be selected, i.e., it is not possible to set up new Applica- tions ( 10.6.1 ‘Restricted Operating Mode’, beginning on Page 171).
- Page 49 Key sequ. / Detail of the LCD Explanation Action display ENTER if [always ask] is selected from the service function Measurement/Unit 10.7.5 ‘Unit’, beginning on Page 184), select the unit of measurement for making the measurements in the Application at this point: Use the arrow keys to select the unit.
-
Page 50: Selecting The Desired Application
Selecting the Desired Application To make ferrite content measurements, a probe must be connected and an Appli- cation must be selected that has been set up using the connected probe before measurements can be made. If [Ferrite] flashes on the LCD Display after instrument power-up or after selecting an Application, an Application has not yet been set up using the connected probe. -
Page 51: Deleting An Application
Key sequ. / Detail of the LCD Explanation Action display ENTER Use ENTER to confirm the selected Appli- cation. The selected Application will be re- trieved. The last reading of the last not closed block is displayed. The instrument is ready to make measurements. Deleting an Application As long as the restricted operating mode is enabled (indicated by on the LCD display), the DEL key will not be enabled, i.e., it is... -
Page 52: List Of Set Up Applications
Key sequ. / Detail of the LCD Explanation Action display Use DEL to start the deletion process. Pressing DEL again: Deletes the Applica- tion. ENTER: Cancels the deletion. It is now possible to select a different Ap- plication ( Page 48) or to set up a new Application ( Page 45). - Page 53 Fig. 5-1). It is now possible to select a different Ap- plication ( Page 48) or to set up a new Application ( Page 45). FISCHER FERITSCOPE FMP30 23.07.08 Applications: 0 sheet FGAB1.3Fe Fe % 23.07.08 n= 7 1 face FGAB1.3Fe Fe %...
-
Page 54: Assigning Application Designations
Assigning the Application designation can be carried out in the following man- ner: Use of the optional software MPNAME (the software is available from your authorized supplier or directly from the Helmut Fischer GmbH Institute for Electronics and Metrology.) Transmitting the command “SAN” via the USB port ( 9.4.2 ‘Control... - Page 55 Key sequ. / Detail of the LCD Explanation Action display ∧ ∨: MENU Selects a menu option by pressing Tolerance Limits ( Page 54) Measurement display resolution Page 56) Automatic block size and block creation Page 57) Number of single readings to be mea- sured in auto-averaging mode before an individual value is generated from them by averaging (...
-
Page 56: Tolerance Limits
5.6.1 Tolerance Limits Having the tolerance limits enabled allows for a simple and quick determination if the measured ferrite contents are within specified limits 7.3.5 ‘Measurements With Tolerance Limits Enabled’, beginning on Page 94). Key sequ. / Detail of the LCD Explanation Action display... - Page 57 ENTER Press ENTER to confirm the entry. The tolerance limits are now set and en- abled. Press DEL to return to the mea- surement screen. The instrument is ready to make measure- ments. As long as the tolerance limits are enabled, will appear on the LCD display.
-
Page 58: Measurement Display Resolution
5.6.2 Measurement Display Resolution The measurement display resolution specifies the resolution for displaying the readings on the LCD display. Example: Reading 18.61 Display with resolution setting “low”:19 Display with resolution setting “standard”: 18.6 Display with resolution setting “high”: 18.61 Resolution 0.0 ...0.999 1.0 ...9.99 10 ...99.99... -
Page 59: Automatic Block Size And Block Creation
5.6.3 Automatic Block Size and Block Creation “Automatic block creation” must be enabled and a block size must be defined for a certain number of readings to be combined in a block automatically during the measurement. The block size must be between 2 and 99 ( 7.3.6 ‘Measurements With a Fixed Block Size’, beginning on Page 94). -
Page 60: Auto-Averaging Mode
Key sequ. / Detail of the LCD Explanation Action display ENTER Press ENTER to confirm the selection and return to the menu to enter additional set- tings. Press DEL to return to the measurement screen. The instrument is ready to make measure- ments. - Page 61 Key sequ. / Detail of the LCD Explanation Action display Enter Use Enter to confirm the value for the number of single readings or: ∧ ∨ specify a new value by pressing the arrow ∧ ∨ keys ENTER If the “i” value is modified during a test se- ries, all readings obtained before must be deleted.
-
Page 62: Outlier Rejection
5.6.5 Outlier rejection With outlier rejection enabled, recognized outliers will be indicated on the LCD display and announced through an audible signal ( 7.3.8 ‘Measurements With Outlier Rejection Enabled’, beginning on Page 97). The following methods are available for the outlier rejection function: Grubbs Test ( Glossary) Specification of a known spread (Sigma) (... -
Page 63: Measured Variables
Key sequ. / Detail of the LCD Explanation Action display ENTER Press ENTER to confirm the selection/en- try and return to the menu to enter addi- tional settings. Press DEL to return to the measurement screen. The instrument is ready to make measure- ments. - Page 64 Measure- Detail of the LCD Explanation ment pro- display gram Ferrite con- Ferrite content display in tent [%]: Ferrite percent % or FN [FN]: Ferrite numbers The ferrite content will be displayed in Fe% or FN corresponding to the set unit 10.7.5 norm.
-
Page 65: Linking Applications
Linking Applications 10.6.4 ‘Linking Applications’, beginning on Page 177) If the linking mode is enabled, all applications that have set up using the same probe (identified by the same serial number) will be linked with each other. Ap- plications that have been linked to each use the same normalization and/or cor- rective calibration to determine measurements. -
Page 66: Enabling And Disabling The Linking Mode
5.7.2 Enabling and Disabling the Linking Mode The linking mode is enabled or disabled from the Service functions of the instru- ment ( 10.6.4 ‘Linking Applications’, beginning on Page 177). As long as the linking mode is enabled will appear on the LCD display. - Page 67 Fig. 5-3 Example for linking of applications ® Operators Manual FERITSCOPE FMP30 Page 65...
- Page 68 Immediately following the linking procedure: Because a normalization or a corrective calibration has not yet been carried out immediately following the linking procedure, the normal- izations and corrective calibrations of the linked Applications still dif- fer from each other. Applications 4 and 6 are also linked to each other , because they have been set up with the same FGABW1.3-FE probe (serial number 505).
-
Page 69: Normalization, Calibration And Master Calibration
(e.g., a calibration standard), can- not be corrected. In such a case, the probe must be sent to your authorized distributor or directly to the Helmut Fischer GmbH Institute for Electronics and Metrology for repair. Information Regarding Normalization, Calibration and Master Calibration The information in Chapter ““1 ‘Important Information’, beginning on... -
Page 70: Normalization
Reference measurements should be performed after every normalization and calibration to verify the normalization and calibration. It is not possible to start a normalization, corrective calibration or a master calibration as long as the restricted operating mode is enabled (indicated by on the LCD display) ( 10.6.1 ‘Restricted Operating Mode’, beginning on Page 171)! -
Page 71: Normalization Procedure
6.2.1 Normalization Procedure Key sequ. / Detail of the LCD Explanation Action display ZERO Use ZERO to start the normalization of the open Application. ZERO appears and remains on the LCD display while the normalization is per- formed. [s]: Standard deviation [n]: Number of measurements [Base material (Fe]: The measurements should be made on the base material of... -
Page 72: Documenting The Normalization With A Printer
6.2.2 Documenting the Normalization with a Printer FISCHER FERITSCOPE FMP30 23.07.08 NORMALIZATION 23.07.08 12:38 Appl.No.: 3 Probe: FGAB1.3Fe fe.= 98.86 Fe%... -
Page 73: Corrective Calibration
Corrective Calibration With a corrective calibration, a new zero point and one additional point (one- point calibration with one calibration standard) or two additional points (two- point calibration with two calibration standards) are established for the calibra- tion curve of the open Application and are stored in the open Application. The coefficients of the master characteristic stored in the EEPROM of the probe plug are not affected. -
Page 74: 6.3.2 Corrective Calibration Procedure
6.3.2 Corrective Calibration Procedure Key sequ. / Detail of the LCD Explanation Action display Use CAL to start the corrective calibration of the open Application. CAL appears and remains on the LCD dis- play while the corrective calibration is per- formed. - Page 75 Key sequ. / Detail of the LCD Explanation Action display ∧∨ ENTER [Entry: ]: Use the arrow keys to set the rated ferrite content value of the calibration standard. The rated value can be set faster if a mea- surement is performed on a calibration standard that is within the tolerance range, and then the rated value is corrected using the arrow keys.
- Page 76 Key sequ. / Detail of the LCD Explanation Action display ENTER A confirmation indicating that the correc- tive calibration has been carried out suc- cessfully appears. Pressing ENTER confirms the message. PRINT: A print form of the corrective cali- bration will be printed if a printer is con- nected and switched on ( Page 76).
-
Page 77: Deleting A Corrective Calibration
6.3.3 Deleting a Corrective Calibration When deleting the corrective calibration, only the corrective calibra- tion of the open Application will be deleted. The corrective calibra- tions of the other Applications are retained. However, if the linking mode is enabled ( on the LCD display), the corrective cali- brations of all Applications that are linked with the open Application will be deleted. -
Page 78: Documenting The Corrective Calibration With A Printer
6.3.4 Documenting the Corrective Calibration with a Printer FISCHER FERITSCOPE FMP30 23.07.08 CALIBRATION 23.07.08 12:43 Appl.No.: 3 Probe:FGAB1.3Fe Measurements on Base fe.= 104.2 Fe% s= 1.671 Fe% Fe: 0.680 Fe% Measurements on fe.= 0.646 Fe% s= 0.010 Fe% Calibration stan- dard # 1 Fe: 3.08 Fe%... -
Page 79: Master Calibration
Factory master calibration One master calibration (factory master calibration) is performed at the facility of the Helmut Fischer GmbH Institute for Electronics and Metrology with a very high precision using 5 calibration standards (incl. 1 base). It cannot be deleted or overwritten by the user. -
Page 80: Selecting The Calibration Standards
During the user master calibration, the master characteristic can be determined only if suitable calibration standards are used. If the master calibration standards of the Helmut Fischer GmbH Institute for Electronics and Metrology are not used, the normalized countrates Xn of the master calibration standards used in their place must be within the specific Xn ranges. -
Page 81: Master Calibration Procedure
(e.g., a calibration standard). In such a case, the probe must be sent to your authorized distributor or directly to the Helmut Fischer GmbH Institute for Electronics and Metrol- ogy for repair. During the master calibration, the master characteristic can be deter- mined only if suitable calibration standards are used. - Page 82 Key sequ. / Detail of the LCD Explanation Action display ENTER ZERO + CAL appear and remain on the LCD display while the master calibration is performed. [s]: Standard deviation [n]: Number of measurements [Base material (Fe)]: The measurements (normalization) should be made on base. [MCL Delete: DEL]: Use DEL to delete an existing master calibration (appears only if a master calibration has already been per-...
- Page 83 Key sequ. / Detail of the LCD Explanation Action display ∧∨ ENTER [Entry: ]: Use the arrow keys to set the rated ferrite content value of the calibration standard. The rated value can be set faster if a mea- surement is performed on the calibration standard and then the rated value is cor- rected using the arrow keys.
- Page 84 Key sequ. / Detail of the LCD Explanation Action display ∧ ∨ ∧ ∨ Use the arrow keys to set the rated ferrite content value of the calibration stan- dard. The rated value can be set faster if a mea- surement is performed on the calibration standard and then the rated value is cor- ∧...
-
Page 85: Displaying Xn Ranges For Calibration Standards For The Master Calibration
6.4.4 Displaying Xn Ranges for Calibration Standards for the Master Calibration During the master calibration, the master characteristic can be determined only if suitable calibration standards are used. The calibration standards are suited for the master calibration only if their nor- malized countrates Xn are within pre-established Xn ranges. -
Page 86: Documenting The Master Calibration With A Printer
6.4.5 Documenting the Master Calibration with a Printer FISCHER FERITSCOPE FMP30 23.07.08 MASTER CALIBRATION 23.07.08 13:34 Appl.No.: 4 Probe: FGAB1.3Fe Measurements on uncoated specimen fe.= 104.2 Fe% s= 1.671 Fe% (base material) Fe: 0.680 Fe% Measurements on fe.= 0.646 Fe% s= 0.010 Fe%... -
Page 87: Determination Of The Normalized Countrate Xn Of A Calibration Standard During A Master Calibration
Mean value of all readings obtained for this step of the calibration. Standard deviation of the readings obtained for this step of the calibration. Determination of the Normalized Countrate Xn of a Calibration Standard During a Master Calibration The normalized countrate Xn of a calibration standard can be determined as de- scribed below during a master calibration without affecting the calibration. -
Page 88: Measuring
Measuring The information stated in Chapter 1 ‘Important Information’, beginning on Page 9 must be observed when making measurements! Preparing for a Measurement The instrument and the measurement area must be prepared in the following manner before measurements can be made: Agreement on the reference areas (determination on where several single readings are to be taken), according to DIN EN ISO 2064. -
Page 89: Parameters That Influence The Ferrite Content
Parameters That Influence the Ferrite Content Mea- surement The following factors influence the readings of a ferrite content measurement: Specimen curvature Specimen thickness Cladding thickness Edge distance of the measurement location The influence of the specimen's shape can be corrected by multiplying the mea- sured ferrite contents with the respective correction factors ( beginning on Page 116). - Page 90 Observe the following during the measurement: Measurements should be made within the reference area. To avoid erroneous readings, do not allow the probe to hover above the spec- imen. To obtain a correct air value, the distance to the specimen should be at least 25 mm.
-
Page 91: Measurement Acquisition
7.3.1 Measurement Acquisition As long as automatic measurement acquisition is enabled, measurement acquisi- tion occurs automatically immediately after the probe is placed on the specimen. An audible signal will sound after the measurement acquisition (unless it has been disabled) ( 7.3.4 ‘Audible Signals After the Measurement Acquisition’, beginning on Page 93). -
Page 92: Measurements With External Start Enabled
7.3.2 Measurements With External Start Enabled When an automatic measurement acquisition is not desired, e.g., when making measurements in pipes, boreholes or grooves, external start should be enabled and automatic measurement acquisition disabled (Enabling externally triggered measurement acquisition and disabling automatic measurement acquisition: Page 180). - Page 93 This measuring mode is advantageous if a mean values of the ferrite content dis- tribution is to be determined quickly within a reference area. This mean value is added to a measurement series as a single reading. With online output of the single readings via the USB port enabled, only this mean value will be output as well.
- Page 94 Measurement Capture Through Automatic Measurements With automatic measurements, a specified number of readings is taken with a se- lectable time interval between 2 measurements. In contrast to the area measure- ment, all single readings will be stored ( Page 90). This measuring mode can be advantageous, for example, when the ferrite content distribution shall be determined along a line.
-
Page 95: Audible Signals After The Measurement Acquisition
7.3.4 Audible Signals After the Measurement Acquisition An audible signal will sound after the measurement acquisition (unless it has been disabled). The measurement acquisition signal indicates that a signal arriv- ing from the probe has been recognized and that the probe can be lifted off the specimen. -
Page 96: Measurements With Tolerance Limits Enabled
7.3.5 Measurements With Tolerance Limits Enabled Having the tolerance limits enabled allows for a simple and quick determination if the measured ferrite contents are within specified limits ( Page 54). As long as the tolerance limits are enabled, will appear on the LCD display. - Page 97 the closure of the block is indicated by a long audible signal (if the measure- ment acquisition signal has been disabled, only the signal to indicated the block closure will sound). With a connected and powered up printer, it is now possible to print the block re- sult automatically after the block closure or upon ( 10.5.4 ‘Block Result’, be- ginning on Page 167).
-
Page 98: Measurements In Auto-Averaging Mode
7.3.7 Measurements in Auto-Averaging Mode With measurements made in auto-averaging mode, the mean value generated from a number of single readings is stored in place of the single readings. Thus, this mode is particularly well suited for rough surfaces. (For setting the number of single readings from which the average of the readings to be stored is determined: 5.6.4 ‘Auto-Averaging Mode’, beginning on Page 58) -
Page 99: Measurements With Outlier Rejection Enabled
7.3.8 Measurements With Outlier Rejection Enabled When making measurements with outlier rejection enabled: the outlier measurements recognized by the instrument will appear on the LCD display and will be indicated acoustically ( 5.6.5 ‘Outlier rejection’, beginning on Page 60), Detail of the LCD Explanation display will appear in front of the reading on the... -
Page 100: Documenting The Measurement With A Printer
Documenting the Measurement with a Printer With a connected and powered up printer, it is possible to print individual read- ings by pressing the PRINT key Fig. 7-3 and Fig. 7-4). [Print single readings on] must be set from the Service Functions/Print menu ( 10.5.3 ‘Print Individual Single Readings’, be- ginning on Page 166). - Page 101 2| | * 3| | * | | 10.3 4|<<| | | 3.1 5| | * | | 10.3 FISCHER FERITSCOPE FMP30 24.07.08 Appl.No. 0 -- Block result -- Block No.: 1 24.07.08 22:05 Mean value fe. = 8.89 +/- 4.04% Std.
- Page 102 The readings and the block results of a single block can be printed during the evaluation of this particular block by pressing the PRINT key.() 8.1.1 ‘Documenting the Block Result With a Printer’, beginning on Page 128 FISCHER FERITSCOPE FMP30 24.07.08 Appl.No. 0 -- Block result -- Block No.: 3 24.07.08 12:09...
-
Page 103: Erroneous Readings
Erroneous Readings 7.5.1 Deleting Erroneous Readings If an erroneous reading is recognized directly after measurement acquisition, the reading can be deleted by pressing DEL. The deleted reading will then not be included in the generation of the block and final results. Repeated pressing of DEL will delete all readings of the open block in succes- sion. -
Page 104: Overwriting Individual Erroneous Measurements
7.5.4 Overwriting Individual Erroneous Measurements at a Later Time During the evaluation of the current block, individual erroneous measurements of the current block or of earlier blocks can be overwritten with new readings. The instrument does not carry out outlier rejection when overwriting stored measurement data (even if outlier rejection is enabled). - Page 105 Key sequ. / Detail of the LCD Explanation Action display MENU Use MENU to retrieve the display of the single readings. [Blck:]: Number of the selected block [n=]: Consecutive number of the displayed single reading ∧ ∨ Use the arrow key to select the sin- gle reading that is to be overwritten.
-
Page 106: Measurements In The Free-Running Display Mode
Key sequ. / Detail of the LCD Explanation Action display Use ENTER to end the block result display. ENTER The last block will be closed automatically and a new block will open. If additional measurements are to be made in the last not yet closed block, do not press ENTER;... -
Page 107: Turning The Free-Running Display Mode On/Off
7.6.1 Turning the Free-Running Display Mode On/Off ∨ To enable the free-running display mode: Press the arrow key. The “free-running” display mode remains enabled until it is disabled; i.e., it does not need to be enabled every time the instrument is powered up. ∨... -
Page 108: Procedure For Making Measurements With The Free-Running Display Mode
7.6.2 Procedure For Making Measurements With the Free-Run- ning Display Mode The magnetic poles are subject to increased wear when moving the probe across a surface. Key sequ. / Detail of the LCD Explanation Action display ∨ ∨ Press the arrow key to enable the free- running display mode. -
Page 109: Analog Display
The audible signals for indicating tolerance limit violations are disabled automatically when making measurements in the free-running display mode. A violation of a tolerance limit will be indicated only through or displayed on the CD display. 7.6.3 Analog Display When making measurements in the “free-running” display mode, the analog dis- play facilitates a quick recognition of tendencies in ferrite content changes. - Page 110 Key sequ. / Detail of the LCD Explanation Action display ∨ ∨ Press the arrow key to enable the free- running display mode. will appear on the LCD display. [3.00 8.00]: Limits for the analog display (example). Place the probe on the specimen and move it across the surface of the specimen to determine the lateral ferrite content dis- tribution.
-
Page 111: Measurements In Standard And Matrix Measuring Mode
Measurements in Standard and Matrix Measuring Mode The preparations required for making the actual measurement are independent of the selected measuring mode and are described in the Chapters “ 7.1 ‘Preparing for a Measurement’, beginning on Page 86 and 7.3 ‘Making a Measurement’, beginning on Page 87. Measuring modes can be changed from the service functions only 10.6.3 ‘Matrix Mode’, beginning on Page 174). -
Page 112: Standard Measuring Mode
Reference area APPL 1 APPL 2 APPL 3 (for sheet metal) (for pipe) (for profile) Norm 1/ Cal 1 Norm 2/ Cal 2 Norm 3/ Cal 3 Block 1 Block 1 Block 1 Readings sheet 1 Readings pipe 1 Readings profile 1 Block 2 Block 2 Block 2... -
Page 113: The Matrix Measuring Mode
7.7.3 The Matrix Measuring Mode When changing to the matrix measuring mode, the number of Applications and the number of blocks must be entered. The same number of blocks is set up for each Application. Each block can receive the same maximum number of read- ings. -
Page 114: Matrix Measuring Mode
All three Applications contain 20 blocks each. With 3 Applications each with 20 blocks, a maximum of n=318 readings can be stored per block. The matrix measuring mode is suited for ferrite content measurements when the measurements are to be made on different specimens of the same type in succes- sion, always at certain reference areas, and the measurements of corresponding areas are to be combined into blocks. - Page 115 Automatic Block changing Automatic Block changing must be selected for the next reading to be stored in the next block automatically. Free block selection is not available with automatic block changing! After the audible signal for the measurement acquisition, a long audible signal will sound to indicate block changing ( 7.3.4 ‘Audible Signals After the Mea- surement Acquisition’, beginning on Page 93).
- Page 116 Key sequ. / Detail of the LCD Explanation Action display ∧ ∨ Use the arrow keys to select the desired block and ENTER to confirm the block se- lection. The display shown to the left appears if a new block (without readings) is selected. Make the measurement in the selected block on the next specimen.
-
Page 117: Assigning Block Designations
Assigning the block designation can be carried out in the following manner: Use of the optional software MPNAME (the software is available from your authorized supplier or directly from the Helmut Fischer GmbH Institute for Electronics and Metrology.) Transmitting the command “SBN” via the USB port ( 9.4.2 ‘Control... -
Page 118: Correction Factors
Correction Factors The following factors influence the readings of a ferrite content measurement: Specimen curvature Specimen thickness Cladding thickness Edge distance to the measurement location Surface roughness However, the surface roughness is strongly dependent on the ferrite content and the influence cannot be stated quantitatively. The influence is relatively small for ferrite contents of <... - Page 119 Fig. 7-9 Correction factors (convex curvature of the specimen) Example: A ferrite content of 50 FN is measured at the longitudinal line on the circumfer- ence of a cylinder with a diameter of 20 mm. A corrective factor of 1.05 can be obtained from Fig.
- Page 120 Fig. 7-10 shows that the influence of the concave curvature is negligible for curvature diameters greater than 80 mm. Fig. 7-10 Correction factors (concave curvature of the specimen) ® Page 118 Operators Manual FERITSCOPE FMP30...
-
Page 121: Influence Of The Specimen Thickness
7.8.2 Influence of the Specimen Thickness With ferrite content measurements on thin specimens (e.g., sheet metal), the mea- sured ferrite content deviates increasingly from the actual (true) ferrite content as the thickness of the specimen decreases. The actual (true) ferrite content can be computed in the following manner: = Fe •... -
Page 122: Influence Of The Cladding Thickness
Example: A ferrite content of 1.72 FN is measured on a metal sheet with a thickness of 1 mm. A correction factor of 1.1 can be obtained from Fig. 7-11. The actual fer- rite content is computed in the following manner: = Fe •... - Page 123 Fig. 7-12 Correction Factors (cladding thickness) Example: A ferrite content of 1.72 FN is measured on a 1 mm cladding. A corrective factor of 0.6 can be obtained from Fig. 7-12. The actual ferrite content is computed in the following manner: = Fe •...
-
Page 124: Influence Of The Edge Distance On The Measurement Location
7.8.4 Influence of the Edge Distance on the Measurement Loca- tion The reading deviates with a decreasing distance of the measurement location from the edge increasingly from the actual (true) ferrite content. The actual ferrite content can be computed in the following manner: = Fe •... - Page 125 Example: A ferrite content of 24 FN is measured at a distance of the probe tip of 1 mm to the edge of the specimen. A correction factor of 1.1 can be obtained from Fig. 7- 13. The actual ferrite content is computed in the following manner: = Fe •...
-
Page 126: Evaluation
Evaluation The following options are available for evaluating the measured ferrite contents: Evaluation of the current block (Block result) Evaluation of the open Application (Final result) An evaluation cannot be carried out in an Application, where no measurements have not yet been stored or where the measurements have been deleted! In this case, the display will not change after pressing BLOCK-RES or FINAL-RES. -
Page 127: Evaluation Of The Current Block "Block Result
Coefficient of variation V Standard deviation sa (only for the final result if automatic block creation is enabled) Specification limit values LSL and USL Process capability indices Cp and Cpk as well as the estimated value s^ for the standard deviation (only if tolerance limits and automatic block creation are enabled) Histogram with information whether a normal distribution is present, skew- ness and kurtosis as well as sum frequencies of the histogram classes (only... - Page 128 the number of readings in this block corresponds to the set block size 7.3.6 ‘Measurements With a Fixed Block Size’, beginning on Page 94). Evaluation of the current block (display “Block result”): Key sequ. / Detail of the LCD Explanation Action display BLOCK-RES...
- Page 129 Key sequ. / Detail of the LCD Explanation Action display Notes: ∨ [Change block: ] or [Change block: ∧∨ ∧ ∨ ]: Use to display the block re- sult of the next or previous block. [Single meas: MENU]: Use MENU to display the single readings ∧...
-
Page 130: Documenting The Block Result With A Printer
1 fe = 10.4% n= 2 fe = 10.4% n= 3 fe = 10.4% n= 4 fe = 10.3% n= 5 fe = 10.2% FISCHER FERITSCOPE FMP30 25.07.08 Appl.No. 0 -- Block result -- Block No.: 3 24.07.08 23:10 Mean value fe. -
Page 131: Printout Of The List Of Single Readings
| | 10.4 3| | | | 10.4 4| | * | | 10.3 5|<<| | | 10.2 FISCHER FERITSCOPE FMP30 25.07.08 Appl.No. 0 -- Block result -- Block No.: 3 24.07.08 12:11 Mean value fe. = 10.33 +/- 0.13% Std. -
Page 132: Computed Parameters - Block Result
), then the block result of this block can be printed as well using PRINT. The printout will then include a list of the readings of this block as well. 8.1.3 Computed parameters - Block result FISCHER FERIT- Instrument type: SCOPE FMP30 2008-07-25 Current date Appl. -
Page 133: Evaluation Of The Open Application "Final Result
Lowest value Lowest block mean value (Minimum) Highest value Highest block mean value (Maximum) LSL/USL Upper / lower specification limit Reading is within the tolerance limits << / >> Reading violates the tolerance limits !/!! The measurement was recognized as an outlier With the Matrix measuring mode enabled (indicated by on the LCD display), the block result will not be printed by pressing... - Page 134 Key sequ. / Detail of the LCD Explanation Action display FINAL-RES Use FINAL-RES to start the evaluation of the open Application. [Page: FINAL-RES]: Pressing FINAL- RES again: Displays additional computed quantities. [Page: FINAL-RES]: Pressing FINAL- RES again: Displays additional computed quantities.
-
Page 135: Documenting The Final Result With A Printer
Key sequ. / Detail of the LCD Explanation Action display FINAL-RES Notes about finishing the final result using FINAL-RES. [Delete meas.: DEL]: Use DEL to delete all readings of the eval- uated Application. [Exit: ENTER]: To end the final results function without deleting the readings use ENTER. - Page 136 FISCHER FERITSCOPE FMP30 27.06.08 Product ......Name ......Appl.No. 0 -- Final result -- from 27.06.08 11:26 to 27.06.08 11:27 Mean value fe..= 39.84% Est.StdDev.. Ã^ = 1.88% COV = 19.11% smallest block= 8.89% largest Block = 10.33% Fig. 8-5 Printout of a final evaluation (example)
-
Page 137: Computed Parameters - Final Result
8.2.2 Computed Parameters - Final Result FISCHER FERIT- Instrument type: SCOPE FMP30 2008-06-27 Current date Product ..Name ..Appl. No. Number of the Application -- Final result -- Result type from ... to ... Date and time of the last block closure of the first and the last block or the current date and the current time (if the last block is not yet closed). -
Page 138: Histogram
8.2.3 Histogram A histogram ( Fig. 8-7) will be printed after the final result only if the respec- tive histogram mode has been set up in the service functions 10.5.6 ‘Histogram’, beginning on Page 169) and there are least 30 readings stored in the Application ( 10.8 ‘Storage Mode’, beginning on Page 187). - Page 139 Skewness and kurtosis are printed out only if the evaluated readings do not have normal distribution (with a normal distribution, skewness and kurtosis are Zero!): H I S T O G R A M 10.1| 7 |* 10.2| 12 |* 10.2| 2 |* 10.3|...
-
Page 140: Data Transfer Using Usb
Transfer measurement data and additional information in the ASCII format, e.g., using PC-DATEX (additional information about the PC-DATEX pro- gram is available from Helmut Fischer GmbH or your authorized system supplier.) directly into an EXCEL spreadsheet, and .Transmit commands and data, e.g., via Windows ®... -
Page 141: Usb Connection To A Pc
USB Connection to a PC Connect the USB port of the instrument with the USB port of the PC. Use the USB cable supplied with the instrument. Fig. 9-1 Side view of the instrument with the USB port Installing the USB Drivers If there is no USB driver installed for the USB connection on your PC, proceed as follows: If the USB driver was downloaded from a Website of Helmut Fis-... -
Page 142: Transfer Of The Measurement Data To The Computer
Transfer of the Measurement Data to the Computer Knowledge regarding operation of the computer and the software in use, which may be obtained form respective instruction manuals, is required. Establish the USB connection: Page 139. Select the data for online export: 10.6 ‘Instrument Mode’, beginning on Page 171 Data transfer from the instrument to the PC... -
Page 143: Offline Operation
9.3.2 Offline Operation With offline operation, the data stored in the instrument are output at a later time (offline) via the USB port. The data output is triggered by pressing PRINT. If the setting in the service function is “USB/Output/Individual Values”, the sin- gle readings are output via the USB port after pressing PRINT. -
Page 144: Control Commands
9.4.2 Control Commands The instrument can be remote controlled and can request readings and other data by sending the control commands from the PC to the instrument. The requested readings or the data, respectively, are then transmitted by the instrument via the USB port and received by the PC. - Page 145 Command Function Sets the measurement date output mode “Single readings with group separator”, i.e., during the measurement data output, the single readings are transferred and a group separator (ASCII GS) is transmitted between each of the measurement blocks. Sets the measurement data output mode “only block mean values”, i.e., during the measurement data output, only the block mean values are transferred.
- Page 146 Command Function GAN0 Requests the designation of the Application with the number 0 (...99). An empty string is output if no designation has been as- GAN99 signed. Assign a designation using the software MPNAME or the command “SAN”. Example: After receiving the command “GAN2”, the instrument outputs the name of the second Application.
- Page 147 Command Function Requests the number of measurement blocks that are stored in the current application. Requests the block size of the current Application, i.e., the number of readings that are to be combined during automatic block creation. “0” is output of automatic block creation is dis- abled.
-
Page 148: Connecting A Printer
Fig. 9-2 Side view of the instrument with the USB port You can obtain an overview of printers that are suitable for connection to the instrument from the Helmut Fischer GmbH Institute for Electronics and Metrology or from your authorized supplier. -
Page 149: Instrument Settings - Service Function Menu
10 Instrument Settings - Service Function Menu The instrument settings described below are configured from the Service func- tion menu. How to access the “Service function” menu: Key sequ. / Detail of the LCD Explanation Action display ON/OFF Use ON/OFF to turn the instrument on 5 x ENTER After pressing ENTER 5 times, the identifi- cation number 157 appears on the LCD... -
Page 150: 10.1 Service Menu Overview
The descriptions below assume that the service functions have been retrieved and not yet exited. 10.1 Service Menu Overview start on Service menu Functions Page System Language Time Datum Date format Contrast Light Auto switch off Initialization Evaluation Block result Histogram Output to port Group separator... -
Page 151: 10.2 System
start on Service menu Functions Page Measurement Audible signal Meas. signal Extern start Measuring Mode - Standard/ Area Measurement/Auto Measurement Unit Measured variable Storage mode store/do not store/delete at off Master calibration Performing a master calibration About ... Information about the instrument configura- tion 10.2 System 10.2.1... -
Page 152: Time
Key sequ. / Detail of the LCD Explanation Action display ENTER Select the desired language by pressing ∧ ∨ the arrow keys and confirm the se- lection with ENTER. 10.2.2 Time Key sequ. / Detail of the LCD Explanation Action display Select System from the service menu. -
Page 153: Date
10.2.3 Date Key sequ. / Detail of the LCD Explanation Action display Select System from the service menu. Use ENTER to confirm the selection. ENTER Select the Date by pressing the arrow keys ∧ ∨ and confirm the selection with EN- TER. -
Page 154: Date Format
10.2.4 Date format Key sequ. / Detail of the LCD Explanation Action display Select System from the service menu. Use ENTER to confirm the selection. ENTER Select the Date format by pressing the ar- ∧ ∨ row key and confirm the selection with ENTER. -
Page 155: Contrast
10.2.5 Contrast Use the contrast setting to adjust the LCD display brightness continuously. The contrast value can be between 0 (brightest LCD display) and 99 (darkest LCD display). The default contrast setting is 60. Key sequ. / Detail of the LCD Explanation Action display... -
Page 156: Lighting
10.2.6 Lighting The following options are available for the light setting” “off after n sec”: The light turns off after n seconds. “always off”: The light is always off. “always on”: The light is always turned on. “on w. power unit”: The light is on only with the power unit connected. Key sequ. - Page 157 Key sequ. / Detail of the LCD Explanation Action display ∧ ∨ always on After confirming the selection “always on” Enter with ENTER, you are immediately returned to the menu in order to enter additional set- tings. ∧ ∨ on w. power unit After confirming the selection “on w.
-
Page 158: Automatic Switch Off
10.2.7 Automatic Switch Off Key sequ. / Detail of the LCD Explanation Action display Select System from the service menu. Use ENTER to confirm the selection. ENTER Select Auto. switch off by pressing the ar- ∧ ∨ row keys and confirm the selection with ENTER. -
Page 159: Re-Initialization Of The Instrument
10.2.8 Re-Initialization of the Instrument The restoration of the default settings of the instrument is called re-initialization. With a re-initialization of the instrument, all Applications are deleted, i.e., the stored measurement data as well as the normalizations and the corrective calibrations of all Applications (thus, after a re-initialization, all Applications must be set up anew!), all readings are deleted, all settings in the service functions are reset to the default settings (i.e., to the... - Page 160 Press DEL only if the re-initialization is indeed desired! [Continue: ENTER]: Press ENTER will re- turn you to the System menu. ® Page 158 Operators Manual FERITSCOPE FMP30...
-
Page 161: 10.3 Evaluation
10.3 Evaluation 10.3.1 Block Result Key sequ. / Detail of the LCD Explanation Action display Select Evaluation from the service menu. Use ENTER to confirm the selection. ENTER Select Block Result by pressing the arrow ∧ ∨ keys and confirm the selection with ENTER. -
Page 162: Histogram
10.3.2 Histogram A histogram can be presented as well when the final result is displayed.( 8.2 ‘Evaluation of the Open Application “Final Result”’, beginning . At least 30 readings are required for this. To display the histogram, on Page 131 proceed as follows: Key sequ. -
Page 163: 10.4 Usb
10.4 USB 10.4.1 Output Key sequ. / Detail of the LCD Explanation Action display Select USB from the service menu. Use ENTER to confirm the selection. ENTER Select the desired output mode by press- ∧ ∨ ing the arrow keys and confirm the selection with ENTER. -
Page 164: Group Separator
10.4.2 Group Separator Key sequ. / Detail of the LCD Explanation Action display Select USB from the service menu. Use ENTER to confirm the selection. ENTER Select the desired groups separator mode ∧ ∨ by pressing the arrow keys confirm the selection with ENTER. [off]: No group separator will be transmit- ted between the individual blocks during the output via the USB port. -
Page 165: Send Free-Running Mode
10.4.3 Send Free-Running Mode Key sequ. / Detail of the LCD Explanation Action display Select USB from the service menu. Use ENTER to confirm the selection. ENTER Select the desired free-running mode by ∧ ∨ pressing the arrow keys and con- firm the selection with ENTER. -
Page 166: 10.5 Printing
10.5 Printing 10.5.1 Printer Selection Key sequ. / Detail of the LCD Explanation Action display Select Print from the service menu. Use ENTER to confirm the selection. ENTER Select the Printer by pressing the arrow ∧ ∨ and confirm the selection with ENTER. -
Page 167: Left Margin Setting
10.5.2 Left Margin Setting Key sequ. / Detail of the LCD Explanation Action display Select Print from the service menu. Use ENTER to confirm the selection. ENTER Select Left Margin by pressing the arrow key Ù or Ú and confirm the selection with ENTER. -
Page 168: Print Individual Single Readings
10.5.3 Print Individual Single Readings Key sequ. / Detail of the LCD Explanation Action display Select Print from the service menu. Use ENTER to confirm the selection. ENTER Select Print sgl. meas. by pressing the ar- ∧ ∨ row keys and conform the selection with ENTER. -
Page 169: Block Result
10.5.4 Block Result Corresponding to the setting, press BLOCK-RES ( 8.1.1 ‘Documenting the Block Result With a Printer’, beginning on Page 128) to print the block result. The following setting options exist: Key sequ. / Detail of the LCD Explanation Action display Select Print from the service menu. -
Page 170: Final Result
10.5.5 Final Result Corresponding to the setting, press FINAL-RES ( 8.2.1 ‘Documenting the Fi- nal Result with a Printer’, beginning on Page 133) to print the FINAL result. The following setting options exist: Key sequ. / Detail of the LCD Explanation Action display... -
Page 171: Histogram
10.5.6 Histogram A histogram can be added to the printout of the final result if at least 30 readings are stored in the Application ( 8.2.3 ‘Histogram’, beginning on Page 136). Key sequ. / Detail of the LCD Explanation Action display Select Print from the service menu. -
Page 172: Auto Formfeed
10.5.7 Auto Formfeed Key sequ. / Detail of the LCD Explanation Action display Select Print from the service menu. Use ENTER to confirm the selection. ENTER Select Auto Formfeed by pressing the ar- ∧ ∨ row keys and confirm the selection with ENTER Select the desired Auto Formfeed mode by... -
Page 173: 10.6 Instrument Mode
10.6 Instrument Mode 10.6.1 Restricted Operating Mode When the restricted operating mode is enabled, only the keys necessary for mea- surement and evaluation are active. This avoids erroneous measurements due to unintentional adjustments of instrument parameters. The following keys are active in the restricted operating mode: ZERO MENU No actions are triggered and the LCD display will not change when pressing... - Page 174 Key sequ. / Detail of the LCD Explanation Action display Select the desired operating mode by ∧ ∨ pressing the arrow keys and con- firm the selection with ENTER. [off]: The restricted operating mode is dis- abled, i.e., all functions are enabled ac- cording to their settings.
-
Page 175: Analog Display
10.6.2 Analog Display When making measurements in the “free-running” display mode, the analog dis- play facilitates a quick recognition of tendencies in the ferrite content changes. If analog display is enabled and measurements are made in the “free-running” dis- play mode, the analog display with the set limits will appear in place of the infor- mation lines. -
Page 176: Matrix Mode
10.6.3 Matrix Mode Key sequ. / Detail of the LCD Explanation Action display Select Instrument Mode by pressing the ∧ ∨ arrow keys and confirm the selec- tion with ENTER. ENTER Select the Matrix Mode by pressing the ∧ ∨ arrow keys and confirm the selec- tion with ENTER. - Page 177 Key sequ. / Detail of the LCD Explanation Action display Enter When changing to a different measuring mode, the instrument will b re-initialized 10.2.8 ‘Re-Initialization of the Instru- ment’, beginning on Page 157). [Yes: DEL]: Press DEL to carry out the re- initialization.
- Page 178 ENTER Select the desired block change by press- ∧ ∨ ing the arrow keys and confirm the selection with ENTER. [Manually]: The block change must be done manually, i.e., when making mea- surements in the matrix mode, the block where the next reading is to be stored can be selected freely using BLOCK-RES and ∧...
-
Page 179: Linking Applications
10.6.4 Linking Applications Key sequ. / Detail of the LCD Explanation Action display Select Instrument Mode by pressing the ∧ ∨ arrow keys and confirm the selec- tion with ENTER. ENTER Select Linking by pressing the arrow key ∧ ∨ and confirm the selection with EN- TER. -
Page 180: 10.7 Measurement
10.7 Measurement 10.7.1 Audible Signal The audible signal, i.e., the measurement acquisition signal that sounds after ev- ery measurement can be disabled. The audible signals that sound after instrument power-up, after a tolerance limit violation, after recognition of an outlier measurement or after concluding a block (when making measurements with auto- matic block creation) cannot be disabled! (Details about the audible signals:... -
Page 181: Measurement Effect
10.7.2 Measurement Effect Key sequ. / Detail of the LCD Explanation Action display Select Measurement by pressing the ar- ∧ ∨ row key and confirm the selection with ENTER. ENTER Select Meas. signal by pressing the arrow ∧ ∨ keys and confirm the selection with ENTER. -
Page 182: External Start
10.7.3 External Start Key sequ. / Detail of the LCD Explanation Action display Select Measurement by pressing the ar- ∧ ∨ row key and confirm the selection with ENTER. ENTER Select Extern start by pressing the arrow ∧ ∨ keys and confirm the selection with ENTER. - Page 183 Key sequ. / Detail of the LCD Explanation Action display Select the desired “delay” by pressing the ENTER ∧ ∨ arrow keys and confirm the selec- tion with ENTER. [0 ms]: no pause after external start [100 ms]: 100 ms pause after external start [2500 ms]: 2500 ms pause after external start...
-
Page 184: Measuring Mode - Standard/Area Measurement/Automatic Measurement
10.7.4 Measuring Mode - Standard/Area Measurement/Automatic Measurement Key sequ. / Detail of the LCD Explanation Action display Select Measurement by pressing the ar- ∧ ∨ row key and confirm the selection with ENTER. ENTER Select Measuring Mode by pressing the ∧... - Page 185 Key sequ. / Detail of the LCD Explanation Action display Select the mode for “Automatic measure- ∧ ∨ ment” by pressing the arrow keys Automatic measurement is possible (en- abled) 7.3.3 ‘Automatic Measurement Acquisi- tion’, beginning on Page 90. Use ENTER to confirm the selection. Use DEL at any time to cancel the proce- dure.
-
Page 186: Unit
10.7.5 Unit You can specify the unit of measurement for making measurements in the newly set up Application. Key sequ. / Detail of the LCD Explanation Action display Select Measurement by pressing the ar- ∧ ∨ row key and confirm the selection with ENTER. -
Page 187: Measured Variable
10.7.6 Measured Variable The menu option “Measured variable” appears only when the current Application is set up. Key sequ. / Detail of the LCD Explanation Action display Select Measurement by pressing the ar- ∧ ∨ row key and confirm the selection with ENTER. - Page 188 Key sequ. / Detail of the LCD Explanation Action display With every modification of the measured variable, a prompt for deleting readings al- ready stored in the open Application will appear because it is not possible to evalu- ate different types of measured variables statistically at the same time.
-
Page 189: 10.8 Storage Mode
10.8 Storage Mode Key sequ. / Detail of the LCD Explanation Action display Select Storage mode by pressing the ar- ∧ ∨ row key and confirm the selection with ENTER. ENTER Select the desired mode by pressing the ∧ ∨ arrow keys and confirm the selec- tion with ENTER. -
Page 190: 10.10 About
10.10 About ... Key sequ. / Detail of the LCD Explanation Action display Select About ... by pressing the arrow key ∧ ∨ and confirm the selection with EN- TER. ENTER Displays the software version, the internal state and the name of the connected probe. - Page 191 FISCHER FERITSCOPE FMP30 25.07.08 Software version : FFA00i18 internal state : 03 00000685 a Probe : FGAB1.3Fe Serial number : 0708V00001 Meas. range : 0.15 - 105 Language : english Date format : european Contrast : 71 Auto. switch off...
-
Page 192: 11 Malfunctions And Messages
11 Malfunctions and Messages 11.1 Malfunctions Malfunction/Mes- Cause Correction start sage Page No display Instrument not switched Use ON/OFF to turn the instrument on. Instrument switched off Use ON/OFF to turn automatically (energy the instrument on. savings function during operation without AC adapter Batteries are dis- Replace rechargeable... - Page 193 Malfunction/Mes- Cause Correction start sage Page Unable to set up, Restricted operating Use ON/OFF + ENTER overwrite or delete mode is enabled. to disable the restricted Applications. operating mode with the instrument switched off before- hand. ∨ Unable to retrieve “Free-running”...
- Page 194 Malfunction/Mes- Cause Correction start sage Page Probe does not mea- Automatic Enable automatic mea- sure measurement acquisi- surement acquisition tion disabled. from the service func- tions or trigger the ex- ternal measurement acquisition by pressing ∨ key (or FINAL- RES during the nor- malization or calibra- tion).
- Page 195 Malfunction/Mes- Cause Correction start sage Page Wrong readings Wrong voltage due to Connect the correct AC connecting a wrong AC adapter. adapter (e.g., for 110 V instead of 220 V). Probe tip worn. Use a probe with a proper probe tip. Printer prints hiero- Wrong printer setting in Select an appropriate...
-
Page 196: 11.2 Messages On The Lcd Display
11.2 Messages on the LCD Display The error messages (E***) and warning messages (W***) that may occur during instrument operation are contained in the overview on the following pages. Malfunction/Mes- Cause Correction start sage Page Reading cannot be dis- Perform the measure- played (because the ment correctly (e.g., do - - - -... - Page 197 Malfunction/Mes- Cause Correction start sage Page Instrument-internal er- Use ON/OFF to turn ror. the instrument off and then again on. Math Error ! If this error occurs re- peatedly: Inform cus- tomer service. The internal instrument Delete the measure- memory is full. ment data stored in the Application or delete a Appl.
- Page 198 Malfunction/Mes- Cause Correction start sage Page Cause: ENTER was Place the probe on the pressed during the specimen and then measurement in the press ENTER to trigger “free-running” display the measurement ac- mode while the probe quisition. was lifted off. Outlier measurement Repeat the calibration recognized during nor-...
- Page 199 Malfunction/Mes- Cause Correction start sage Page Unable to complete cor- Repeat the corrective rective calibration. calibration and per- Cause: Measurement form the calibration Measurements out carried out incorrectly. measurement correct- of interval ! ly (e.g., do not allow the probe to hover over the standard before or after the measurement;...
- Page 200 Malfunction/Mes- Cause Correction start sage Page Cause: Calibration Repeat the master cali- standards used that did bration with correct and not exhibit the required good calibration stan- ferrite content or are de- dards. fective. Instrument-internal er- Repeat the master cali- ror: Unable to compute bration.
- Page 201 Malfunction/Mes- Cause Correction start sage Page Unable to generate the Take additional mea- final result when making surements until the first measurements with block is concluded and Not enough fixed block sizes if the re-create the final re- measurements ! first block of the evalu- sult.
- Page 202 Malfunction/Mes- Cause Correction start sage Page Instrument-internal er- Delete the faulty Appli- ror. cation and output the measurement data via Error in the USB port. application ! ([Delete Appl.? Yes:DEL N.:EN- TER]: DEL to deleted the Application. [To port? Yes: DEL N.:EN- TER], DEL to output the measurement data...
- Page 203 Malfunction/Mes- Cause Correction start sage Page The measurement elec- Inform customer ser- tronics has not been vice. balanced properly. Be- Measurem. equip. cause of this, measure- not adjusted ! ment data may be incorrect. Internal write/read error. Inform customer ser- vice.
- Page 204 Malfunction/Mes- Cause Correction start sage Page Printer switched off or Turn printer on or place offline. online and restart print- ing procedure. Printer not ready ! Printer not connected to Connect the printer the instrument. and restart the printing procedure. Wrong printer setting in Correct the printer set- the service function.
- Page 205 Malfunction/Mes- Cause Correction start sage Page A probe of the same type but with a different serial number has been Probe changed ! connected. ® Operators Manual FERITSCOPE FMP30 Page 203...
- Page 206 ® Page 204 Operators Manual FERITSCOPE FMP30...
-
Page 207: Glossary
12 FERITSCOPE FMP30Glossary ® 12.1 Terms and Formula Symbols See “Additional Literature” on Page 230. This chapter explains the most common terms and symbols in ferrite content measurement and related fields (e.g., quality assurance). In some cases, alter- nate terms or synonyms are mentioned in parentheses. χ²-Test Chi squared test (c²-Test) Rechargeable battery... - Page 208 Outlier rejection Is used to prevent the distortion of the measurement results by outlier mea- surements. With the FERITSCOPE FMP30, outlier rejection can be enabled ® or disabled. Measurements recognized as outliers will not be included in the evaluation. Two methods are available for outlier rejection: Grubbs Test Sigma outlier rejection (Specification of a known spread) Evaluation...
- Page 209 Bit (Binary Digit) Binary number. 1 bit is the smallest unit in the binary number system. The value of a bit is either 0 or 1. Being the smallest unit of information in a com- puter, a bit forms the basis of every computer system. 8 bits are combined to a byte, or several bytes to a word.
- Page 210 Process capability index Process capability index CR (Carriage Return) Carriage Return (CR) DIP switch Dual Inline Package = electronic component ready to be installed. In this case, a series of little switches. They are often used in peripheral devices, i. e., in printers, to change the basic settings of the device.
- Page 211 Mean value. The arithmetic mean value Fe. is the sum of Fe readings of a measurement series (a Blocks), divided by the number N of readings. ∑ ------------------------------------------------------- - ----------------------- - where:Fe. = Mean value (block mean value) = single reading N = single readings (of a block) Fe..
- Page 212 Accuracy Qualitative designation for the degree of approximation of a measurement re- sult to the true value. Usually, the accuracy is divided into Trueness (Ac- curacy of the mean) and Precision. Accuracy Trueness Precision Agreement between the “true” value Agreement between the individual mea- and the mean value of a measure- surement results under precisely de- ment result generally obtained under...
- Page 213 Figure 16.2: Printout of a histogram (example) Calibration curve (characteristics) Quantitative relationship between the probe signal and a function of the fer- rite content as defined by calibration standards. The mid portion of the calibration curve approaches a straight line and con- stitutes the range with the lowest relative measurement error.
- Page 214 FMP30 consist of the Base and three calibration standards of dif- ® ferent ferrite contents (cf. Figure 16.5). Various calibration standards sets for corrective calibration are available from Fischer to prepare the instrument for different measuring ranges. Figure 16.5: Calibration standard set (example) ®...
- Page 215 Calibration Standards Calibration standards (ferrite standards) Characteristic Calibration curve (characteristics) Class Range between a lower and an upper class boundary (e.g., ferrite content lim- its). The single readings of a measurement series can be sorted according to classes of equal width, which cover the entire range of the measurement se- ries.
- Page 216 Figure 16.6: LCD display of the FERITSCOPE ® FMP30 Line feed (LF) LF line feed. Advances the printer paper by one line. Is usually used together with the CR (carriage return) character to start the next line at the beginning. Unit of measurement Unit for displaying measurement data.
- Page 217 Measuring Measuring is comparing. The probe signal generated at the measuring posi- tion is compared to the probe signal of the calibration standard. Using the cal- ibration curve, the instrument converts the probe signal to the measurement result. Measuring Application Structure of the measuring object according to material, thickness and other properties (hard/soft, porous/dense, homogenous/inhomogeneous, etc.) and any other conditions relevant to the measurement requirement.
- Page 218 corrective measures, if necessary (re-calibration of instrument or repair). System Check Measuring Object Object on which the measurements are to be performed to determine the fer- rite content for example. Measurement Series A series of single readings between two block or final results. Measurement probe Probe Measurement Location...
- Page 219 The coefficients of the master characteristic that is stored in the EEPROM of the probe plug are not affected by a re-initialization because the re-initializa- tion concerns only the memory of the instrument. Standard Calibration standards (ferrite standards) Normal distribution (Gaussian normal distribution, Gaussian distribu- tion) Probability distribution discovered by C.
- Page 220 application with the FERITSCOPE ® FMP30, a Kolmogorov-Smirnov test is χ performed for small random samples (up to 40 measurements) and a 2 test is performed for large random samples (more than 40 measurements) to check whether the measurements can be classified as having normal distribution. Normalized countrate Countrate Normalization...
- Page 221 Precision Agreement between the single measurement results under precisely defined test conditions. The precision is composed of reproducibility and repeatabil- ity. Accuracy; Reproducibility; Repeatability/Repeatability pre- cision Process capability The process capability is assessed by the indices cp and cpk. (For further in- formation see / 4 /.) Process capability is met when the process capability exceeds specified val- ues.
- Page 222 Process control chart (quality control chart, SPC chart) Statistical Process Control (SPC) often uses random samples to control a pro- duction such that the production process is under statistical control. To do this, the variable features of the manufactured product are entered in a process control chart.
- Page 223 Reference sample Reference sample Control chart Process control chart (quality control chart, SPC chart) True value Trueness (Accuracy of the mean) Trueness (Accuracy of the mean) Agreement between the true value and the mean value of a measurement re- sult generally obtained under practical conditions. ( Accuracy;...
- Page 224 Figure 16.8 demonstrates that two measurement series with different standard deviations can still have the same mean value. Figure 16.8: Measurement series with the same mean value but different standard de- viation Standard deviation of the readings that have been taken using a fixed block size.
- Page 225 σ ˆ σ = estimated value for the standard deviation of the population If, for instance, the same number of measurements is performed on several specimens and the readings on each object are combined into a block (e.g., when making measurements with a fixed block size), s. is a measure for the instrument deviation and sa is the product deviation with the instrument de- viation eliminated.
- Page 226 Interface Transfer or connecting point between components, circuits or programs. In- terfaces are used for data transfer. Using a serial interface, the data are trans- ferred bit by bit. Using a parallel interface, the data are transferred by sending several bits simultaneously. Sigma outlier rejection Outlier rejectionMethod for the outlier rejection.
- Page 227 Stability As with every process, test methods are also subject to deviations. This may lead to systematic measurement errors (e.g., drift), independent of handling. By examining the stability and by regular checks, one can ensure stability. Standard deviation Statistical Process Control (SPC) A quality control method.
- Page 228 Sum frequency chart Probability chart (Gaussian probability paper, sum frequency chart, probability paper) Systematic measurement errors Measurement errors The student distribution factor t can be obtained from any popular publication of mathematical statistics tables (e.g., / 4 /) and is given as follows: α...
- Page 229 ⋅ --------- Data transfer rate Baud Rate Lower specification limit. Specification limits (LSL and USL) C.O.V. Coefficient of variation. The standard deviation of a measurement series in percentage points, i.e., the standard deviation in reference to the mean value. For many manufacturing processes, C.O.V. [%] is a characteristic process constant.
- Page 230 Reference sample Specimen with a known ferrite content on a defined reference area that can be used to check the calibration. The ferrite content within the reference area should be as regular as possible. The reference sample should have the same properties (geometry, etc.) as the specimen on which the calibration was per- formed.
- Page 231 Curvature Excess and Kurtosis are measures for the curvature (e.g., how pointed or how wide) of a distribution compared to a normal distribution. A positive curva- ture indicates a relatively narrow, pointed distribution. A negative curvature indicates a relatively flat distribution. The curvature of a normal distribution is Zero.
-
Page 232: 12.2 Additional Literature
Graf, Henning, Stange, Wilrich: Formeln und Tabellen der angewandten mathematischen Statistik; Berlin, Heidelberg, New York: Springer-Verlag / 6 / Helmut Fischer GmbH Institute for Electronics and Metrology: Report re- prints / 7 / Kotecki, D. J.: Extension of the WRC Ferrite Number System; Welding Research Supplement November 1982, S. -
Page 233: Standards
12.2.2 Standards / 12 / DIN 1319, Parts 1, 2 and 3: Basic Concepts in Metrology / 13 / DIN EN ISO 2064: Definitions and Conventions Concerning the Mea- surement of Coating Thicknesses (previously DIN 50 982, Part 1) / 14 / DIN EN ISO 2178: Measurement of Coating Thicknesses: Magnetic Methods (previously DIN 50 981) / 15 /... - Page 234 ® Page 232 Operators Manual FERITSCOPE FMP30...
-
Page 235: Index
Index Block mean values Block size AC adapter, connector socket Accessories Calibration Acoustic signals Deleting corrective calibration Air humidity Ambient Temperature Master calibration Analog display Calibration Standard Certification Application Assign designation Calibration Standards delete Cleaning Linking Content of Shipment List Contrast Control commands Save... - Page 236 Contrast Date/Time External start Fixed block size Histogram and block evaluation Formulas Instrument mode Language Free-running display Lighting Free-running mode Limited operating mode Master calibration Measurement acquisition signal Glossary Measurement effect Group separator Measurement output Re-initialization Standard and matrix measuring mode Histogram and block evaluation Storage mode...
- Page 237 Lighting Limited Operating Mode Limited operating mode Normalization Linking mode Print form Applications Normalized count rate Xn enable/disable Low Voltage Offline operation On/Off Making measurements Online operation acoustic signals Operating Personnel Malfunctions Options Master Calibration Outlier measurement Master calibration Outlier rejection Print form Xn Ranges for calibration stan- dards...
- Page 238 Rechargeable battery Switch on Re-initialization Repairs Technical Data Resolution of the measurement dis- Technical Terms play Temperature Operation Storage Service function Analog display Terms Area measurement Time Automatic measurement Transfer formats Block change Contrast Date/Time Unit External start Histogram and block evaluation Connection Connector Instrument mode...
- Page 239 Moosmattstrasse 1 · Postfach · CH-6331 Hünenberg : (+41) 41 785 08 00 · Fax: (+41) 41 785 08 01 switzerland@helmutfischer.com Valid for Helmut Fischer AG and www.helmutfischer.com Branch Offices Branch Offices of Helmut Fischer AG, Switzerland: SPAIN ITALY JAPAN FISCHER INSTRUMENTS, S.A. HELMUT FISCHER S.R.L.
Need help?
Do you have a question about the FERITSCOPE FMP30 and is the answer not in the manual?
Questions and answers