
Related Manuals for Tektronix MDO4104-6


Summary of Contents for Tektronix MDO4104-6
- Page 1 Tektronix MDO4034-3 Manual Get Pricing & Availability at ApexWaves.com Call Today: 1-800-915-6216 Email: sales@apexwaves.com https://www.apexwaves.com/oscilloscopes/tektronix-inc/mdo4000/MDO4034-3...
- Page 2 MDO4000 Series Mixed Domain Oscilloscopes User Manual *P071291300* 071-2913-00...
- Page 4 MDO4000 Series Mixed Domain Oscilloscopes User Manual www.tektronix.com 071-2913-00...
- Page 5 Copyright © Tektronix. All rights reserved. Licensed software products are owned by Tektronix or its subsidiaries or suppliers, and are protected by national copyright laws and international treaty provisions. Tektronix products are covered by U.S. and foreign patents, issued and pending. Information in this publication supersedes that in all previously published material.
- Page 6 Warranty Tektronix warrants that the product will be free from defects in materials and workmanship for a period of three (3) years from the date of original purchase from an authorized Tektronix distributor. If the product proves defective during this warranty period, Tektronix, at its option, either will repair the defective product without charge for parts and labor, or will provide a replacement in exchange for the defective product.
- Page 7 Warranty Tektronix warrants that the product will be free from defects in materials and workmanship for a period of one (1) year from the date of original purchase from an authorized Tektronix distributor. If the product proves defective during this warranty period, Tektronix, at its option, either will repair the defective product without charge for parts and labor, or will provide a replacement in exchange for the defective product.
-
Page 8: Table Of Contents
Table of Contents Table of Contents General Safety Summary ......................Compliance Information .. - Page 9 Table of Contents When and Why to Turn On MagniVu ................... Using MagniVu .
- Page 10 Table of Contents Saving and Recalling Setups ....................Saving with One Button Push ..
- Page 11 Table of Contents MDO4000 Series Oscilloscopes User Manual...
-
Page 12: General Safety Summary
General Safety Summary General Safety Summary Review the following safety precautions to avoid injury and prevent damage to this product or any products connected to it. To avoid potential hazards, use this product only as specified. Only qualified personnel should perform service procedures. To Avoid Fire or Personal Injury Use proper power cord. - Page 13 General Safety Summary Terms in This Manual These terms may appear in this manual: WARNING. Warning statements identify conditions or practices that could result in injury or loss of life. CAUTION. Caution statements identify conditions or practices that could result in damage to this product or other property. Symbols and Terms on the Product These terms may appear on the product: DANGER indicates an injury hazard immediately accessible as you read the marking.
-
Page 14: Compliance Information
EN 61000-3-2:2006. AC power line harmonic emissions EN 61000-3-3:1995. Voltage changes, fluctuations, and flicker European contact. Tektronix UK, Ltd. Western Peninsula Western Road Bracknell, RG12 1RF United Kingdom This product is intended for use in nonresidential areas only. Use in residential areas may cause electromagnetic interference. -
Page 15: Safety Compliance
Compliance Information Australia / New Zealand Declaration of Conformity – EMC Complies with the EMC provision of the Radiocommunications Act per the following standard, in accordance with ACMA: CISPR 11:2003. Radiated and Conducted Emissions, Group 1, Class A, in accordance with EN 61326-1:2006 and EN 61326-2-1:2006. -
Page 16: Pollution Degree
Compliance Information Pollution Degree Description A measure of the contaminants that could occur in the environment around and within a product. Typically the internal environment inside a product is considered to be the same as the external. Products should be used only in the environment for which they are rated. - Page 17 This symbol indicates that this product complies with the applicable European Union requirements according to Directives 2002/96/EC and 2006/66/EC on waste electrical and electronic equipment (WEEE) and batteries. For information about recycling options, check the Support/Service section of the Tektronix Web site (www.tektronix.com).
-
Page 18: Preface
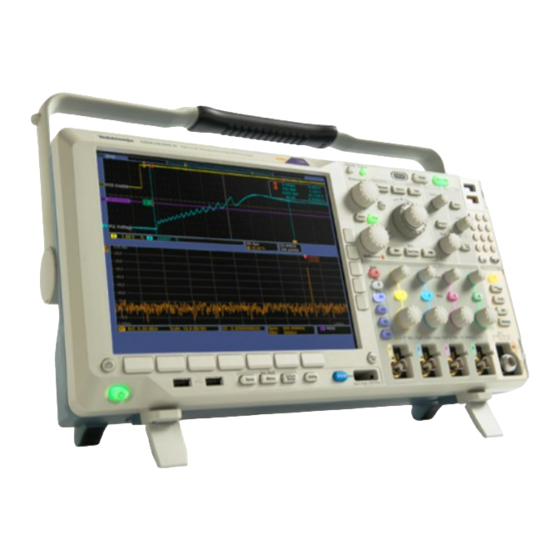
Preface Preface This manual describes the installation and operation of the following oscilloscopes: MDO4104-6 MDO4104-3 MDO4054-6 MDO4054-3 Key Features MDO4000 Mixed Domain Oscilloscopes provide time-correlated acquisition of analog, digital, and RF signals in a single instrument. They can help you verify, debug, and characterize electronic designs by providing views and measurements in both the time and frequency domains simultaneously. - Page 19 Preface MDO4000 Series Oscilloscopes User Manual...
-
Page 20: Installation
Before Installation Unpack the oscilloscope and check that you received all items listed as standard accessories. The following pages list recommended accessories and probes, instrument options, and upgrades. Check the Tektronix Web site (www.tektronix.com) for the most current information. Standard accessories... - Page 21 Installation Standard accessories (cont.) Tektronix part Accessory Description number Probes For 500-MHz models, one 500-MHz, 10X TPP0500 passive probe per channel For 1-GHz models, one 1-GHz, 10X passive TPP1000 probe per channel Front Cover Hard plastic cover to help protect the instrument...
- Page 22 Installation Optional accessories (cont.) Tektronix part Accessory Description number FlexRay, CAN, and LIN serial triggering and This module enables triggering on packet level DPO4AUTOMAX analysis application module information in FlexRay, CAN, and LIN buses. Also, it provides digital views of the signal, bus...
- Page 23 Adapter from N connection (RF input) to TPA-N-VPI TekVPI probe. The MDO4000 Series oscilloscopes work with multiple optional probes. (See page 8, Connecting Probes.) Check the Tektronix Web site (www.tektronix.com) for the most current information. MDO4000 Series Oscilloscopes User Manual...
-
Page 24: Operating Considerations
Installation Operating Considerations MDO4000 Series Oscilloscopes Operating Line Frequency and Voltage Range Volts 100-240 50-60 Mains input voltage range: 100 V - 240 V Maximum Power Consumption: 225 W Weight: 5.0 kg (11.0 lbs), standalone instrument, without front cover Height, feet folded in, handle folded down: MDO4000 Series 229 mm (9.0 in) Width, from handle hub to handle hub: 439 mm... - Page 25 Installation Acquisition System: 1 MΩ The maximum input voltage at the BNC, 300 V . Installation Category II. Derate at 20 dB/decade between 4.5 MHz and 45 MHz. Derate at 14 dB/decade between 45 MHz and 450 MHz. Above 450 MHz, 5 V Acquisition System: 50 Ω...
-
Page 26: Operating Positions
Installation CAUTION. To ensure proper cooling, keep the sides and rear of the instrument clear of obstructions. Ventilation clearance should be at least 51 mm (2 in) on the left side, when looking at the front of the instrument, and on the rear of the instrument Find more information on MDO4000 Series oscilloscope specifications in Appendix A. -
Page 27: Connecting Probes
(on or off state) information. 6. The TPA-N-VPI Adapter allows you to use TekVPI probes in the RF input. For more information on the many probes available for use with MDO4000 Series oscilloscopes, refer to www.tektronix.com. MDO4000 Series Oscilloscopes User Manual... -
Page 28: Securing The Oscilloscope
Installation Securing the Oscilloscope 1. Use a standard laptop computer style security lock to secure your oscilloscope to your location. MDO4000 Series Oscilloscopes User Manual... -
Page 29: Powering On The Oscilloscope
Installation Powering on the Oscilloscope Ground the Oscilloscope and Yourself To power on the instrument, connect the power cord that was provided with the instrument to the power connector on the rear panel. Connect the power cord to a properly grounded electrical outlet. To power off the instrument, remove the power cord from the instrument. -
Page 30: Powering Off The Oscilloscope
Installation Powering off the Oscilloscope To power off the oscilloscope and remove the power cord: Functional Check Perform this quick functional check to verify that your oscilloscope is operating correctly. 1. Connect the oscilloscope power cable as described in Powering On the Oscilloscope. -
Page 31: Compensating A Tpp0500 Or Tpp1000 Passive Voltage Probe
Installation 3. Connect the probe connector to oscilloscope channel 1 and the probe tip and reference lead to the PROBE COMP terminals on the oscilloscope front panel. 4. Push Default Setup. 5. Push Autoset. The screen should now display a square wave, approximately 2.5 V at 1 kHz. - Page 32 Installation 3. Connect the probe connector to the oscilloscope channel and the probe tip and reference lead to the PROBE COMP terminals on the oscilloscope front panel. NOTE. Connect only one probe at a time to the probe comp terminals. 4.
-
Page 33: Compensating A Non-Tpp0500 Or Non-Tpp1000 Passive Voltage Probe
If you are interested in using the automatic probe compensation procedure described above for the TPP0500 and TPP1000 probes (See page 12, Compensating a TPP0500 or TPP1000 Passive Voltage Probe.) on a non-TPP0500/TPP1000 Tektronix passive probe, check the instruction manual for your probe to see if it qualifies. Otherwise, to properly compensate your passive probe: 1. -
Page 34: Application Module Free Trial
Installation 2. Check the shape of the displayed waveform to determine if your Properly compensated probe is properly compensated. Under compensated Over compensated 3. If necessary, adjust your probe. Repeat as needed. Quick Tips Use the shortest possible ground lead and signal path to minimize probe-induced ringing and distortion on the measured signal. -
Page 35: Changing The Language Of The User Interface Or Keyboard
Installation Optional application module packages extend the capability of your oscilloscope. You can physically install up to four application modules at one time. Application modules go into the two slots with windows in the upper right corner of the front panel. Two additional slots are directly behind the two that you can see. To use these slots, install the module with the label facing away from you. -
Page 36: Changing The Date And Time
Installation 4. Push Language from the resulting Utility Language Set Date & TekSecure About Page Time lower-bezel menu. Erase Config Memory Language 5. Push Menus from the resulting side menu Menus (a) English and turn multipurpose knob a to select the desired language for the user interface. - Page 37 Installation 2. Push Utility Page. Utility Page 3. Turn multipurpose knob a and select Config. Config 4. Push Set Date & Time. Utility Language Set Date & TekSecure About Time Page Erase Config Memory 5. Push the side-bezel buttons and turn both Display Date &...
-
Page 38: Signal Path Compensation
Installation Signal Path Compensation Signal Path Compensation (SPC) corrects for DC inaccuracies caused by temperature variations and/or long-term drift. Run the compensation whenever the ambient temperature has changed by more than 10 °C (18 °F) or once a week if you use vertical settings of 5 mV/division or less. Failure to do so may result in the instrument not meeting warranted performance levels at those volts/div settings. - Page 39 Service personnel use the factory calibration functions to calibrate the internal voltage references of the oscilloscope using external sources. Contact your Tektronix field office or representative for assistance with factory calibration. NOTE. Signal Path Compensation does not include calibration to the probe tip. (See page 14, Compensating a non-TPP0500 or non-TPP1000 Passive Voltage Probe.)
-
Page 40: Upgrading Firmware
Upgrading Firmware To upgrade the firmware of the oscilloscope: 1. Open up a Web browser and go to www.tektronix.com/software. Proceed to the software finder. Download the latest firmware for your oscilloscope on your PC. Unzip the files and copy the firmware.img file into the root folder of a USB flash drive... - Page 41 Installation 3. Insert the USB flash or hard drive into the front-panel USB port on your oscilloscope. 4. Power on the oscilloscope. The instrument automatically recognizes the replacement firmware and installs it. If the instrument does not install the firmware, rerun the procedure. If the problem continues, try a different model of USB flash or hard drive.
- Page 42 Installation 6. Power on the oscilloscope. 7. Push Utility. 8. Push Utility Page. Utility Page 9. Turn multipurpose knob a and select Config. Config 10. Push About. The oscilloscope displays the Utility Language Set Date & TekSecure About Page Time English Erase firmware version number.
-
Page 43: Connecting Your Oscilloscope To A Computer
VISA lets you use your MS-Windows computer to acquire data from your oscilloscope for use in an analysis package that runs on your PC, such as Microsoft Excel, National Instruments LabVIEW, Tektronix OpenChoice Desktop software, or a program of your own creation. You can use a common communications connection, such as USB, Ethernet, or GPIB, to connect the computer to the oscilloscope. - Page 44 Installation 3. Push Utility. 4. Push Utility Page. Utility Page 5. Turn multipurpose knob a and select I/O. 6. If you are using USB, the system sets itself Utility Ethernet & Network Socket GPIB Page Configura- Server Computer up automatically for you, if USB is enabled. tion Automatic Check USB on the lower-bezel menu to...
- Page 45 Your oscilloscope shipped with a CD that contains a variety of Windows-based software tools for efficient connectivity between your oscilloscope and your computer. These include toolbars that speed connectivity with Microsoft Excel and Word. There are also two standalone acquisition programs called NI LabVIEW SignalExpress™, Tektronix Edition and Tektronix OpenChoice Desktop.
- Page 46 Installation 3. Push Utility Page. Utility Page 4. Turn multipurpose knob a and select I/O. 5. Push Ethernet & LXI. Utility Network Socket GPIB Ethernet & Page Configura- Server Computer tion Automatic 6. View the top side-menu item to determine Ethernet &...
- Page 47 Installation Ethernet & 11. Push Change Names to change the name Change Names of the oscilloscope, the network domain, or the service name. 12. Push Change Ethernet & LXI Password to Change Ethernet change the name of the password. & LXI Password 13.
- Page 48 Installation 16. For e*Scope, click the Instrument Control (e*Scope) link on the left side of the LXI Welcome page. You should then see a new tab (or window) open in your browser with e*Scope running. Using a Socket Server A socket server provides two-way communication over an Internet Protocol-based computer network. You can use your oscilloscope’s socket server feature to let your oscilloscope communicate with a remote-terminal device or computer.
- Page 49 Installation 2. Push Utility. 3. Push Utility Page. Utility Page 4. Turn multipurpose knob a and select I/O. 5. Push Socket Server. Utility Ethernet & Network GPIB Socket Server Page Configura- Computer tion Manual Socket Server 6. On the resulting Socket Server side menu, Enabled Disabled push the top entry to highlight Enabled.
- Page 50 Installation 10. After you have set up the socket server parameters, the computer is now ready to communicate with the oscilloscope. If you are running an MS Windows PC, you could run its default client Telnet, which has a command interface. One way to do this is by typing “...
-
Page 51: Connecting A Usb Keyboard To Your Oscilloscope
Installation 12. You can now type in a standard query, such *idn? The Telnet session window will respond by displaying a character string describing your instrument. You can type in more queries and view more results using this Telnet session window. -
Page 52: Get Acquainted With The Instrument
Get Acquainted with the Instrument Get Acquainted with the Instrument Front-Panel Menus and Controls The front panel has buttons and controls for the functions that you use most often. Use the menu buttons to access more specialized functions. Overview 1. Frequency domain display 2. -
Page 53: Using The Menu System
Get Acquainted with the Instrument Using the Menu System To use the menu system: 1. Push a front-panel menu button to display the menu that you want to use. NOTE. The B1 through B4 buttons support up to four different serial or parallel buses. 2. - Page 54 Get Acquainted with the Instrument 4. To remove a side-bezel menu, push the lower-bezel button again or push Menu Off. 5. Certain menu choices require you to set a numeric value to complete the setup. Use the upper and lower multipurpose knobs a and b to adjust values.
- Page 55 Get Acquainted with the Instrument 7. Utility. Push to activate the system utility functions, such as selecting a language or setting the date/time. 8. Save / Recall Menu. Push to save and recall setups, waveforms, and screen images to internal memory, a USB flash drive, or a mounted network drive.
- Page 56 Get Acquainted with the Instrument Also, push the B1, B2, B3, or B4 button to display or remove the corresponding bus from the display. 11. R. Push to manage reference waveforms and traces, including the display or removal of each reference waveform or trace from the display.
- Page 57 Get Acquainted with the Instrument Using Other Controls These buttons and knobs control waveforms, cursors, and other data input. 1. Waveform Intensity. Push to enable multipurpose knob a to control waveform display intensity and knob b to control graticule intensity. 2.
- Page 58 Get Acquainted with the Instrument 6. Turn the upper multipurpose knob a, when activated, to move a cursor, to set a numerical parameter value for a menu item, or to select from a pop-out list of choices. Push the Fine button to toggle between coarse and fine adjustment.
- Page 59 Get Acquainted with the Instrument 16. Run/Stop. Push to start or stop acquisitions. 17. Single. Push to make a single acquisition. 18. Autoset. Push to automatically set the vertical, horizontal, and trigger controls for a usable, stable display. 19. Trigger Level. Turn to adjust the trigger level.
- Page 60 Get Acquainted with the Instrument 27. Save. Push to perform an immediate save operation. The save operation uses the current save parameters, as defined in the Save / Recall menu. 28. Default Setup. Push to perform an immediate restore of the oscilloscope to the default settings.
- Page 61 Get Acquainted with the Instrument 30. Menu Off. Push to clear a displayed menu from the screen. Identifying Items in the Time Domain Display The items shown to the right may appear in the display. Not all of these items are visible at any given time.
- Page 62 Get Acquainted with the Instrument 2. The trigger position icon shows the trigger position in the acquisition. 3. The expansion point icon (an orange triangle) shows the point that the horizontal scale expands and compresses around. To make the expansion point the same as the trigger point, push Acquire and set the lower-menu Delay item to Off.
- Page 63 Get Acquainted with the Instrument 7. The trigger level icon shows the trigger level on the waveform. The icon color corresponds to the trigger source color. 8. The trigger readout shows the trigger source, slope, and level. The trigger readouts for other trigger types show other parameters.
- Page 64 Get Acquainted with the Instrument 12. Measurement readouts show the selected measurements. You can select up to eight measurements to display at one time. symbol appears instead of the expected numerical measurement if a vertical clipping condition exists. Part of the waveform is above or below the display.
- Page 65 Get Acquainted with the Instrument 18. The bus display shows decoded packet level information for serial buses or for parallel buses. The bus indicator shows the bus number and bus type. Identifying Items in the Frequency Domain Display Activate the frequency domain display by pressing the front-panel RF button. 1.
-
Page 66: Front-Panel Connectors
Get Acquainted with the Instrument Front-Panel Connectors 1. Logic Probe Connector 2. Channel 1, 2, 3, 4. Channel inputs with TekVPI Versatile Probe Interface. 3. RF Input Connector. 4. PROBE COMP. Square wave signal source to compensate or calibrate probes. Output voltage: 0 – 2.5 V, amplitude ±... -
Page 67: Rear-Panel Connectors
Get Acquainted with the Instrument Rear-Panel Connectors 1. Auxiliary Output. Use this output to generate a signal on a main trigger pulse, as a 10 MHz reference signal, or to output a signal when other events happen, such as mask-limit test events. To use this to synchronize other test equipment with your oscilloscope, push the front-panel Utility button,... - Page 68 Get Acquainted with the Instrument 5. Device. Use the USB 2.0 High speed device port to control the oscilloscope through USBTMC or GPIB with a TEK-USB-488 Adapter. The USBTMC protocol allows USB devices to communicate using IEEE488 style messages. This lets you run your GPIB software applications on USB hardware.
-
Page 69: Acquire The Signal
Acquire the Signal Acquire the Signal This section describes concepts of and procedures for setting up the oscilloscope to acquire the signal as you want it to. Setting Up Analog Channels Use front-panel buttons and knobs to set up your instrument to acquire signals using the analog channels. 1. - Page 70 Acquire the Signal 4. Push Autoset. 5. Push the desired channel button. Then adjust the vertical position and scale. 6. Adjust the horizontal position and scale. The horizontal position determines the number of pretrigger and posttrigger samples. The horizontal scale determines the size of the acquisition window relative to the waveform.
- Page 71 Acquire the Signal 2. Push a lower-bezel button to create a label, Label such as for channel 1 or B1. 3. Push Select Preset Label to view a list of Select Preset labels. Label 4. Turn multipurpose knob b to scroll through the list to find a suitable label.
-
Page 72: Using The Default Setup
Acquire the Signal 7. Turn multipurpose knob a to scroll through the list of letters, numbers, and other characters to find the character in the name that you want to enter. ABCDEFGHIJKLMNOPQRSTUVWXYZ abcdefghijklmnopqrstuvwxyz 0123456789_=+-!@#$%^&*()[]{}<>/~’”\|:,.? 8. Push Select or Enter Character to let the oscilloscope know that you have picked the proper character to use. -
Page 73: Using Autoset
Acquire the Signal 2. If you change your mind, push Undo Undo Default Default Setup to undo the last default Setup setup. Using Autoset Autoset adjusts the instrument (acquisition, horizontal, trigger, and vertical controls) such that it displays four or five waveform cycles for analog channels with the trigger near the midlevel, and ten cycles for digital channels. -
Page 74: Acquisition Concepts
Acquire the Signal 2. Push and hold Menu Off. 3. Release Menu Off, and then release Autoset. 4. Select the desired side-bezel setting. Autoset Enabled Autoset Disabled Quick Tips To position the waveform appropriately, Autoset may change the vertical position. Autoset always sets vertical offset to 0 V. -
Page 75: Waveform Record
Acquire the Signal Real-Time Sampling MDO4000 Series oscilloscopes use Record points real-time sampling. In real-time sampling, the instrument digitizes all of the points it acquires using a single trigger event. Sampling rate Waveform Record The instrument builds the waveform record through use of the following parameters: Sample interval: The time between recorded sample points. -
Page 76: How The Analog Acquisition Modes Work
Acquire the Signal How the Analog Acquisition Modes Work Sample mode retains the first sampled point from each acquisition interval. Sample is the default mode. Peak Detect mode uses the highest and lowest of all the samples contained in two consecutive acquisition intervals. - Page 77 Acquire the Signal 2. Push Mode. Mode Record Delay Set Horiz. Waveform XY Display Length Position to Display Sample |Off 3. Then choose the acquisition mode from Acquisition Mode the side-bezel menu. You can chose from: Sample, Peak Detect, Hi Res, Envelope, or Average.
-
Page 78: Using Roll Mode
Acquire the Signal 7. Push the lower-bezel Delay button to select On when you want to delay the acquisition relative to the trigger event. With Delay set to On, turn the Horizontal Position knob counterclockwise to increase the delay. The trigger point will move to the left and ultimately outside of the acquired waveform. -
Page 79: Setting Up A Serial Or Parallel Bus
Acquire the Signal Setting Up a Serial or Parallel Bus Your oscilloscope can decode and trigger on signal events or conditions that occur on: Bus type With this hardware Audio (I S, Left Justified (LJ), Right DPO4AUDIO application module Justified (RJ), and TDM) CAN and LIN DPO4AUTO or DPO4AUTOMAX application module Ethernet... - Page 80 Acquire the Signal 2. Push Trigger Menu and enter trigger parameters. (See page 83, Choosing a Trigger Type.) You can display bus information without triggering on the bus signal. Setting Up Bus Parameters NOTE. For most bus sources, you may use any combination of channels 1 through 4, and D15 through D0. With some buses, you may also use Ref 1 through 4 and Math as sources for protocol decode.
- Page 81 Acquire the Signal Use the side-bezel buttons to define Define Inputs parameters for the inputs, such as specific signals to an analog or digital channel. If you select Parallel, push the side-bezel Clocked Data button to enable or disable Clocked Data. Yes|No Push the side-bezel button to select the Clock...
- Page 82 Acquire the Signal 5. Optionally, push B1 Label to edit the label for Bus B1 Define Thresholds B1 Label Event Parallel Display Table Inputs Parallel the bus. (See page 51, Labeling Channels and Buses.) 6. Push Bus Display and use the side-bezel menu to define how to display the parallel or serial bus.
- Page 83 Acquire the Signal This example of an Event Table is from an RS-232 bus. RS-232 event tables display one line for each 7- or 8-bit byte when Packets are set to Off. RS-232 event tables display one line for each packet when Packets are set to On.
- Page 84 Acquire the Signal 9. Push B1, B2, B3, or B4 and turn multipurpose knob a to move the bus display up or down on the screen. C Bus To acquire data from an I C bus, you need to also set up these items: 1.
- Page 85 Acquire the Signal 3. Push SCLK to set the edge of the signal to SCLK match the SPI bus being acquired. 4. Set the level of the SS, MOSI, and MISO Active signals to match the SPI bus. High Active Low Active High means that a signal is considered MOSI active when the signal is greater than the...
- Page 86 Acquire the Signal 2. Push Bit Rate, and turn multipurpose knob a Bit Rate 9600 bps to select the appropriate bit rate. 3. Push Data Bits and select the number to Data Bits match the bus. 4. Push Parity and turn multipurpose knob a to Parity match the polarity used by the bus as None, (a) None...
- Page 87 Acquire the Signal 2. Turn multipurpose knob a to select the CAN Input (a) 1 channel connected to the CAN bus source. 3. Turn multipurpose knob a to select the type Signal Type of CAN signal: CAN_H, CAN_L, Rx, Tx, or CAN_H Differential.
- Page 88 Acquire the Signal 5. Push Configure and the appropriate Bus B1 Define Thresholds Configure B1 Label Event Display Table Inputs side-bezel menu choices. 6. Push Bit Rate, and turn multipurpose knob a Bit Rate to select from the list of predefined bit rates. 19.2K bps Alternatively, you can set the bit rate to a specific value.
- Page 89 Acquire the Signal 2. Push Type, and turn multipurpose knob Audio Bus Type a to select the type of audio bus data configuration on which to trigger. 3. Select I2S to trigger on the standard Inter-IC Sound, or Integrated Interchip Sound, electrical serial bus interface standard stereo format.
- Page 90 Acquire the Signal 2. The Thresholds, Label, Bus Display, and Event Table menus operate similarly to the other serial buses. Ethernet To acquire data from an Ethernet bus, you need to also set up these items: 1. If you selected Ethernet, push Define Bus (B1) Define Thresholds...
- Page 91 Acquire the Signal 2. The Thresholds, Label, Bus Display, and Event Table menu items operate similarly to how they work on other serial bus menus. 3. Push RT if you wish to change the Response Time (RT) maximum and minimum default values.
-
Page 92: Setting Up Digital Channels
Acquire the Signal Setting Up Digital Channels Use front-panel buttons and knobs to set up your instrument to acquire signals using the digital channels. 1. Connect the P6616 16-channel logic probe to the input signal source. 2. Connect the ground lead or leads to the circuit ground. - Page 93 Acquire the Signal 7. Turn multipurpose knob a to scroll through the list of digital channels. Turn multipurpose knob b to position the selected channel. As you position channels close to each other on the display, the oscilloscope groups the channels, and adds the group to the pop-up list.
-
Page 94: When And Why To Turn On Magnivu
When and Why to Turn On MagniVu Tektronix MagniVu acquisition technology allows you to have higher timing resolution so that you can more accurately determine edge placement and make more precise timing measurements on digital edges. Using MagniVu, you can see up to 32 times more detail than you can using normal digital channel sampling. -
Page 95: Setting Up The Rf Inputs
Acquire the Signal Setting Up the RF Inputs Frequency and Span Parameters 1. The center frequency is a precise frequency at the center of the display. In many applications, it is a carrier frequency. 2. The span is the range of frequencies you can observe around the center frequency. - Page 96 Acquire the Signal Frequency & Span 2. Push Center Frequency from the side Center Frequency menu and use either the multipurpose knob a or the oscilloscope keypad to enter the 2.24 GHz desired center frequency. If you use the keypad, you can also use the resulting side menu choices to enter units.
- Page 97 Acquire the Signal Amplitude 2. Push Ref Level and rotate multipurpose Ref Level knob a to set the approximate maximum -25.0 dBm power level, as shown by the baseline indicator at the top of the frequency graticule. 3. Push Vertical and rotate multipurpose knob Vertical 420 mdiv a to adjust the vertical position.
- Page 98 Acquire the Signal 1. Push BW to bring up the resolution bandwidth side menu. This allows you to set the smallest frequency difference that the instrument can discern in the frequency axis. Bandwidth 2. Push RBW Mode to select either Auto or Mode Manual.
-
Page 99: Trigger Setup
Trigger Setup Trigger Setup This section contains concepts and procedures for setting up the oscilloscope to trigger on your signal. Triggering Concepts Trigger Event The trigger event establishes the time-reference point in the waveform record. All waveform record data is located in time with respect to that point. -
Page 100: Trigger Holdoff
Trigger Setup Trigger Holdoff Adjust holdoff to obtain stable triggering when the instrument is triggering on undesired trigger events. Trigger holdoff can help stabilize triggering, since the oscilloscope does not recognize new triggers during the holdoff time. When the instrument recognizes a trigger event, it disables the trigger system until acquisition is complete. -
Page 101: Slope And Level
Trigger Setup 1. Adjust the position (delay) time by rotating the Horizontal Position knob. 2. Turn horizontal SCALE to acquire the detail that you need around the position (delay) expansion point. The part of the record that occurs before the trigger is the pretrigger portion. The part that occurs after the trigger is the posttrigger portion. -
Page 102: Choosing A Trigger Type
Trigger Setup Choosing a Trigger Type To select a trigger: 1. Push Trigger Menu. 2. Push Type to bring up the Trigger Type Trigger Type side-bezel menu. Sequence NOTE. The bus trigger in the MDO4000 (B Trigger) Series works on parallel buses even without Pulse an application module. -
Page 103: Selecting Triggers
Trigger Setup Selecting Triggers Trigger Type Trigger Conditions Edge Trigger on a rising or falling edge, as defined by the slope control. Coupling choices are DC, LF Reject, HF Reject, and Noise Reject. Edge triggers are the simplest and most commonly used trigger type, with both analog and digital signals. - Page 104 Trigger Setup Trigger Type Trigger Conditions Logic Trigger when all channels transition to the specified state. Use multipurpose knob a to select a channel. Push the appropriate side-bezel button to set that channel’s state to High (H), Low (L), or Don’t Care (X). Use the Clock side-bezel button to enable clocked (state) triggering.
-
Page 105: Triggering On Buses
Trigger Setup Trigger Type Trigger Conditions Video Trigger on specified fields or lines of a composite video signal. Only composite signal formats are supported. Trigger on NTSC, PAL, or SECAM. Works with Macrovision signals. With the DPO4VID module, trigger on a variety of HDTV video standard signals, as well as custom (non-standard) bilevel and trilevel video signals with 3 to 4,000 lines. - Page 106 Trigger Setup 2. Push Trigger Menu. 3. Push Type. Type Source Trigger On Address Direction Mode Address Write Auto B1 (I2C) & Holdoff 4. Turn multipurpose knob a to scroll through the trigger type side menu until you select Bus. 5.
- Page 107 Trigger Setup If you are setting up an SPI trigger and have made a Trigger On selection of MOSI or MISO, push the lower-bezel Data button, push the side-bezel MOSI or MISO button, and enter the data parameters of interest with multipurpose knobs a and b. Then push the Number of Bytes button and enter the number of bytes with multipurpose knob a.
- Page 108 Trigger Setup USB Bus Trigger You can trigger on Sync, Reset, Suspend, Resume, End of Packet, Token (Address) Packet, Data Packet, Handshake Packet, Special Packet, or Error. Ethernet Bus Trigger You can trigger on Start Frame Delimiter, MAC Addresses, MAC Length/Type, TCP/IPv4 Client Data, End of Packet, Idle, or an FCS (CRC) Error.
-
Page 109: Checking Trigger Settings
Trigger Setup Specific byte matching (non-rolling window matching for a specific position in the packet) for I C, SPI, USB, CAN, and FlexRay. You can trigger on a specific byte for I C, SPI, CAN, and FlexRay in several ways: For I C and SPI, enter the number of bytes to match the number of bytes in the signal. -
Page 110: Using Sequence Trigger (A (Main) And B (Delayed))
Trigger Setup Using Sequence Trigger (A (Main) and B (Delayed)) Combine an edge A Event (Main) trigger with the B Event (Delayed) trigger to capture more complex signals. After the A Event occurs, the trigger system looks for the B Event before triggering and displaying the waveform. A and B triggers can (and typically do) have separate sources. - Page 111 Trigger Setup Push a side-bezel button to select Time (a) 8 ns sequencing the B trigger after the A as Time or as Events. B Events Set to Minimum 5. Set the other Sequence Trigger parameters in the related side- and lower-bezel menus. B Trigger After Delay Time The A trigger arms the instrument.
-
Page 112: Starting And Stopping An Acquisition
Trigger Setup Starting and Stopping an Acquisition After you have defined the acquisition and trigger parameters, start the acquisition with Run/Stop or Single. Push Run/Stop to start acquisitions. The oscilloscope acquires repeatedly until you push the button again to stop the acquisition. - Page 113 Trigger Setup The RF power detector is relatively slow RF Power Detector Response to 100 MHz 500 Cycle Sine Wave Burst compared to an analog channel trigger. The power detector can take up to 2 μs to respond to changes in the RF power level. In the plot at the right, the RF channel is driven with a 100 MHz sine wave with a 500 cycle burst, for a burst duration of 5...
- Page 114 Trigger Setup In the figure to the right, the edge trigger power level is now raised to -10 dBm. The trigger indication is now delayed approximately 500 ns from the start of the burst. This is due to the power detector response discussed previously.
-
Page 115: Display Waveform Or Trace Data
Display Waveform or Trace Data Display Waveform or Trace Data This section contains concepts and procedures for displaying the acquired waveform or trace. Adding and Removing a Waveform 1. To add or remove a waveform from the display, push the corresponding front-panel channel button or the D15-D0 button. - Page 116 Display Waveform or Trace Data 3. Push Dots Only On Off from the side-bezel Waveform Display menu. Dots on will display the waveform record points as dots on the screen. Dots off connects the dots with vectors. Dots Only |Off 4.
-
Page 117: Setting The Graticule Style
Display Waveform or Trace Data 8. To display the amplitude from one waveform against the amplitude from another, push XY Display. Then push Triggered XY from the side menu. A data point from the first waveform specifies the horizontal location while the corresponding data point from the second waveform specifies the vertical location for each displayed point. -
Page 118: Setting The Lcd Backlight
Display Waveform or Trace Data 5. Select the desired style from the resulting side-bezel menu. The Frame graticule provides a clean screen on which you can most easily read automatic measurement results and other screen text. The Full graticule can help you make cursor measurements on hard copies. -
Page 119: Setting Waveform Intensity
Display Waveform or Trace Data 4. Push Backlight Intensity. Utility Backlight Graticule Screen Page Intensity Annotation Full Display High 5. Select the intensity level from the resulting Backlight Intensity side-bezel menu. Choices are: High, Medium, and Low. High Setting Waveform Intensity 1. -
Page 120: Scaling And Positioning A Waveform
Display Waveform or Trace Data Scaling and Positioning a Waveform Use the horizontal controls to adjust the time base, adjust the trigger point, and to examine waveform details more closely. You can also use the Wave Inspector Pan and Zoom controls to adjust the display of waveforms. (See page 144, Using Wave Inspector to Manage Long Record Length Waveforms.) Original waveform Scaled horizontally... -
Page 121: Setting Input Parameters
Display Waveform or Trace Data Quick Tips Preview. If you change the Position or Scale controls when the acquisition is stopped or when it is waiting for the next trigger, the oscilloscope rescales and repositions the relevant waveforms in response to the new control settings. It simulates what you will see when you next push the RUN button. - Page 122 Display Waveform or Trace Data 5. Push Bandwidth, and select the desired bandwidth from the resulting side-bezel menu. The set choices are: Full, 250 MHz, and 20 MHz. Additional choices may appear, depending on the probe that you use. Select Full to set the bandwidth to the full oscilloscope bandwidth.
- Page 123 This is especially important when using a current probe in conjunction with a voltage probe. For best results, use a deskew fixture, such as the Tektronix 067-1686-xx. MDO4000 Series Oscilloscopes User Manual...
- Page 124 Display Waveform or Trace Data If you do not have a deskew fixture, you can use the controls in the Deskew menu to set the oscilloscope’s deskew parameters to recommended values, based on the nominal propagation delay of each probe. The oscilloscope automatically loads the nominal propagation delay values of TekVPI and TekProbe II (requires use of a TPA-BNC...
-
Page 125: Positioning And Labeling Bus Signals
Display Waveform or Trace Data Positioning and Labeling Bus Signals Positioning bus signals. Push the appropriate front-panel bus button and turn multipurpose knob a to adjust the vertical position of the selected bus. (See page 60, Setting Up a Serial or Parallel Bus.) 1. - Page 126 Display Waveform or Trace Data 2. Push the lower-bezel D15–D0 menu item. D15 – D0 Thresholds Edit Labels MagniVu Height On/Off |Off | M L 3. Push the side-bezel Select button. Select (a) D0 (b) 1.04 div Display On| Off Turn on D7–D0 Turn on...
-
Page 127: Viewing Digital Channels
Display Waveform or Trace Data 8. To group some or all of the digital channels together, move the channels right next to each other. All the channels that are next to each other automatically form a group. You can see the groups by pushing the side-bezel Select item and turning multipurpose knob a. -
Page 128: Viewing The Trigger Frequency
Display Waveform or Trace Data 2. Push Utility Page. Utility Page 3. Turn multipurpose knob a and select Display Display. 4. Push Screen Annotation from the resulting Utility Backlight Graticule Screen Trigger Page Intensity Annotation Frequency Full lower-bezel menu. Readout Display High 5. -
Page 129: Displaying The Frequency Domain Menu
Display Waveform or Trace Data 2. Push Utility Page. Utility Page 3. Turn multipurpose knob a and select Display Display. 4. Push Trigger Frequency Readout from the Utility Backlight Graticule Screen Trigger Page Intensity Annotation Frequency Full resulting lower-bezel menu. Readout Display High... - Page 130 Display Waveform or Trace Data 6. Push Edit Label to label the RF and RF versus time traces. 7. Push More to choose between side menus to compensate the RF signal path or to configure the RF input probe. Trace Types The frequency domain window supports four spectrum traces.
- Page 131 Display Waveform or Trace Data The figure to the right shows the frequency domain window’s trace indicator. 1. An RF trace indicator is placed at the Reference Level. 2. A capital M appears if the maximum trace is turned on. 3.
- Page 132 Display Waveform or Trace Data 5. Average: Averages all points in each interval. 6. -Peak: Uses the lowest amplitude point in each interval. RF Time Domain Traces The time domain window can also display three RF time domain traces, in addition to the usual analog and digital waveforms.
- Page 133 Display Waveform or Trace Data The trace options are: 1. The Amplitude versus Time trace: The instantaneous amplitude of the input, after band-pass filtering, to the current frequency range, as defined by the center frequency and span settings. 2. The Frequency versus Time trace: The instantaneous frequency of the input, relative to the center frequency.
- Page 134 Display Waveform or Trace Data Use squelch to suppress (not display) the phase and frequency information when the amplitude of the RF input is below a user-specified value. This keeps both the frequency versus time and the phase versus time traces from displaying broad bands of noise when there is no signal present on the RF input.
- Page 135 Display Waveform or Trace Data To use the spectrogram feature, push Spectrogram from the RF Menu to bring up the related side menu. Spectro- gram 1. Push Display to On to start the spectrogram. Display On| Off 2. To review each spectrum captured in the Slice (Normal) spectrogram, push the Run / Stop button...
-
Page 136: Analyze Waveform Or Trace Data
Analyze Waveform or Trace Data Analyze Waveform or Trace Data After having properly set up the acquisition, triggering, and display of your desired waveform or trace, you can analyze the results. Select from features such as cursors, automatic measurements, statistics, waveform histograms, math, and FFT. Using Markers in the Frequency Domain 1. - Page 137 Analyze Waveform or Trace Data Automatic Peak Markers Automatic peak markers are on by default and assist with quickly identifying the frequency and amplitude of peaks in the spectrum. 1. The Reference Marker is placed on the highest amplitude peak. It is marked with a red R in a triangle.
- Page 138 Analyze Waveform or Trace Data Each automatic marker has a readout associated with it. These can be absolute or delta readouts. An absolute marker readout shows the actual frequency and amplitude of the associated marker. A delta marker readout shows the frequency and amplitude differences from the Reference Marker.
-
Page 139: Taking Automatic Measurements In The Frequency Domain
Analyze Waveform or Trace Data Taking Automatic Measurements in the Frequency Domain To take an automatic measurement in the frequency domain: 1. Push Measure. 2. Push Domain to select Frequency. Domain Select Measure- Time ment Frequency None 3. Push Select Measurement. 4. -
Page 140: Taking Automatic Measurements In The Time Domain
Analyze Waveform or Trace Data Taking Automatic Measurements in the Time Domain To take an automatic measurement in the time domain: 1. Push Measure. 2. Push Domain to select Time domain Domain Add Mea- Remove Indicators Waveform Bring surement Measure- Cursors on His- measurements. -
Page 141: Selecting Automatic Measurements In The Time Domain
Analyze Waveform or Trace Data Selecting Automatic Measurements in the Time Domain The following tables list each automatic measurement by category: time or amplitude. (See page 121, Taking Automatic Measurements in the Time Domain.) Time measurements Measurement Description Frequency The first cycle in a waveform or gated region. Frequency is the reciprocal of the period; it is measured in hertz (Hz) where one Hz is one cycle per second. - Page 142 Analyze Waveform or Trace Data Time measurements (cont.) Measurement Description Negative Duty The ratio of the negative pulse width to the signal period expressed as a percentage. Cycle The duty cycle is measured on the first cycle in the waveform or gated region. Burst Width The duration of a burst (a series of transient events) and is measured over the entire waveform or gated region.
- Page 143 Analyze Waveform or Trace Data Amplitude measurements (cont.) Measurement Description Positive This is measured over the entire waveform or gated region and is expressed as: Overshoot Positive Overshoot = (Maximum – High) / Amplitude x 100%. Negative This is measured over the entire waveform or gated region and is expressed as: Overshoot Negative Overshoot = (Low –...
- Page 144 Analyze Waveform or Trace Data Miscellaneous measurements (cont.) Measurement Description Area Area measurement is a voltage over time measurement. It returns the area over the entire waveform or gated region in volt-seconds. Area measured above ground is positive; area measured below ground is negative. Cycle Area A voltage over time measurement.
-
Page 145: Customizing An Automatic Measurement In The Time Domain
Analyze Waveform or Trace Data Customizing an Automatic Measurement in the Time Domain You can customize automatic measurements by using gating, modifying measurement statistics, adjusting the measurement reference levels, or taking a snapshot. Gating Gating confines the measurement to a certain portion of a waveform. To use: 1. - Page 146 Analyze Waveform or Trace Data 2. Push More as many times as needed to Add Mea- Remove Indicators Waveform Bring surement Measure- Cursors select Statistics from the resulting pop-up His- More ment On Screen tograms menu. 3. Push the side-bezel menu options. These Measure- ment Sta- include whether to turn statistics on or off...
- Page 147 Analyze Waveform or Trace Data 4. Turn multipurpose knob b to select the Measurement Type of Snapshot. 5. Push OK Snapshot All Measurements. Snapshot All Mea- surements 6. View results. Snapshot on 1 Period : 312.2μs Freq : 3.203 kHz +Width : 103.7μs –Width...
-
Page 148: Taking Manual Measurements With Cursors
Analyze Waveform or Trace Data 2. Push More as many times as needed to Add Mea- Remove Indicators Wave- Bring surement Measure- form His- Cursors select Reference Levels from the resulting More ment tograms On Screen pop-up menu. 3. Set the levels from the side-bezel menu. Reference Levels Set Levels... - Page 149 Analyze Waveform or Trace Data In this example, two vertical cursors appear on the selected waveform. As you turn multipurpose knob a, you move one cursor to the right or left. As you turn knob b, you move the other cursor. 2.
- Page 150 Analyze Waveform or Trace Data 7. Push Select. This makes the vertical cursors active and the horizontal cursors inactive. Now, as you turn the multipurpose knobs, the vertical cursors will move. Push Select to make the horizontal cursors active again. 8.
- Page 151 Analyze Waveform or Trace Data 15. Push Cursors again. This turns off the cursors. The screen no longer displays the cursors and the cursor readout. Using Cursor Readouts Cursor readouts supply textual and numeric information relating to the current cursor positions. The oscilloscope always shows the readouts when the cursors are turned on.
-
Page 152: Setting Up A Histogram
Analyze Waveform or Trace Data The vertical cursor lines on the display measure horizontal parameters, typically time. The square and circle shapes in the readout map to the multipurpose knobs when both vertical and horizontal cursors are present. Using XY Cursors When the XY Display mode is on, the cursor readouts will appear to the right of the lower graticule (XY). - Page 153 Analyze Waveform or Trace Data 4. Push the top side-bezel button to select Vertical the waveform axis for which you want to Horizontal show the histogram values: Vertical or Horizontal. 5. Push the Source side-bezel button and use Source (a) 1 multipurpose knob a to select the channel for which to display histogram measurements.
- Page 154 Analyze Waveform or Trace Data 4. Push the OK Add Measurement side-bezel button to add the measurement to the Add Mea- surement measurement readout list. To Reset Histogram Measurements and Statistics To reset the histogram measurements and statistics, follow these steps: 1.
-
Page 155: Using Math Waveforms
Analyze Waveform or Trace Data 5. Push the Reset Statistics side-bezel button. Reset Statistics You can view the histogram at the top (for horizontal histograms) or the left edge (for vertical histograms) of the graticule. Quick Tips Use horizontal histograms to measure signal jitter. Use vertical histograms to measure signal noise. -
Page 156: Using Fft
Analyze Waveform or Trace Data 2. Push Dual Wfm Math. Dual Wfm Advanced Spectrum (M) Label Math Math Math 3. On the side-bezel menu, set the sources to either channel 1, 2, 3, 4, or reference waveforms R1, 2, 3, or 4. Choose the +, –, x, or ÷... - Page 157 Analyze Waveform or Trace Data 2. Push FFT. Dual Wfm Advanced Spectrum (M) Label Math Math Math 3. Push the side-bezel menu FFT Source Source button, if needed, and turn multipurpose knob a to select the source to use. Choices are: channels 1, 2, 3, 4, reference waveforms 1, 2, 3, and 4.
- Page 158 Analyze Waveform or Trace Data 7. The FFT will appear on the display. Quick Tips Use short record lengths for faster instrument response. Use long record lengths to lower the noise relative to the signal and increase the frequency resolution. If desired, use the zoom feature along with the horizontal Position and Scale controls to magnify and position the FFT waveform.
-
Page 159: Using Advanced Math
Analyze Waveform or Trace Data Description Window Hanning This is a very good window for measuring amplitude accuracy but less so for resolving frequencies. Use Hanning for measuring sine, periodic, and narrow band random noise. This window works on transients or bursts where the signal levels before and after the event are significantly different. -
Page 160: Using Spectrum Math
Analyze Waveform or Trace Data 4. Push Edit Expression and use the multipurpose knobs and the resulting lower-bezel buttons to create an expression. When done, push the side-bezel menu OK Accept button. For example, to use Edit Expression to take the integral of a square wave: 1. -
Page 161: Using Reference Waveforms And Traces
Analyze Waveform or Trace Data The math waveform will appear on the display as a red trace. 6. Push Label from the lower-menu and use the resulting side-menu choices to give your math trace an appropriate label. NOTE. The oscilloscope will only complete the calculation if the units of measure of the source waveforms, when combined, make logical sense. - Page 162 Analyze Waveform or Trace Data 3. Push Vertical in the side-bezel menu and Vertical 0.00 div use the multipurpose knobs to adjust the 100 mV/div vertical settings of the reference waveform or trace. 4. Push Horizontal in the side-bezel menu Horizontal and use the multipurpose knobs to adjust 0.00 s...
-
Page 163: Using Wave Inspector To Manage Long Record Length Waveforms
Analyze Waveform or Trace Data Using Wave Inspector to Manage Long Record Length Waveforms The Wave Inspector controls (zoom/pan, play/pause, marks, search) help you to efficiently work with long record length waveforms. To magnify a waveform horizontally, turn the Zoom knob. To scroll through a zoomed waveform, turn the Pan knob. - Page 164 Analyze Waveform or Trace Data 3. Examine the zoomed view of the waveform that appears on the larger, lower portion of the display. The upper portion of the display will show the position and size of the zoomed portion in the waveform, within the context of the overall record.
- Page 165 Analyze Waveform or Trace Data 3. Change the play direction by reversing the direction that you are turning the pan knob. 4. During play, up to a point, the more you turn the ring, the faster the waveform accelerates. If you rotate the ring as far as it can go, the play speed does not change, but the zoom box quickly moves in that direction.
- Page 166 Analyze Waveform or Trace Data 3. Investigate your waveform by moving from search mark to search mark. Use the next ( →) or previous (←) arrow button to jump from one marked location to another, without adjusting any other controls. 4.
- Page 167 Analyze Waveform or Trace Data 4. On the screen, hollow triangles show the location of automatic marks and solid triangles show the custom (user-defined) locations. These appear on both normal and zoomed waveform views. 5. You can quickly investigate your waveform by moving from search mark to search mark with the next ( →) and previous (←) arrow buttons.
-
Page 168: Auto-Magnify
Analyze Waveform or Trace Data Search Description Rise/Fall Time Search for rising and/or falling edges that are >, <, =, or ≠ a user specified time. Parallel: Search for a binary or hex value. C: Search for Start, Repeated Start, Stop, Missing Ack, Address, Data, or Address and Data. -
Page 169: Time-Correlated Multi-Domain Display
Analyze Waveform or Trace Data 1. The entire acquisition is indicated by the horizontal bar in the upper display. 2. The portion of the acquisition shown in the time domain graticule is shown within the part of the upper display defined by the brackets. - Page 170 Analyze Waveform or Trace Data 3. RF Acquisition time: This is the amount of time acquired by the RF system. At mid-to-fast time base settings, it equals analog time. At slower time base settings, it can be less than analog time. In the figure to the right, it is shown by a pair of brackets around the spectrum time.
- Page 171 Analyze Waveform or Trace Data When you rotate the pan knob clockwise, you move the RF acquisition time and spectrum time to the right of the display. When the right side of the RF acquisition time reaches the far right side of the screen, you cannot move RF acquisition time any further to the right.
- Page 172 Analyze Waveform or Trace Data When the oscilloscope is not acquiring data (stopped), the RF acquisition time is fixed on the display. Turning the pan control clockwise or counter-clockwise will not move the RF acquisition time. Turning the pan control will, however, move the spectrum time within the RF acquisition time.
-
Page 173: Limit And Mask Testing
Analyze Waveform or Trace Data 1. The zoomed-in portion of the analog time is shown by brackets. In the figure to the right, this time is outside of the RF acquisition time. 2. The RF acquisition time is shown by a pair of vertical brackets. - Page 174 Analyze Waveform or Trace Data 3. Push the front-panel Autoset button. 4. Push the front-panel Test button. 5. Push the lower-bezel menu Application item. Turn multipurpose knob a to select Limit/Mask Test from the menu. 6. Push the lower-bezel menu Select Mask item and, from the resulting side menu, select Limit Test.
- Page 175 Analyze Waveform or Trace Data 3. Push the lower-bezel menu Select Mask item and, from the resulting side menu, select Standard. 4. Push the lower-bezel Select Standard. 5. Use the resulting side menu items to select the desired standard to use. 6.
- Page 176 Analyze Waveform or Trace Data 9. Push Edit Custom Mask from the lower-bezel menu. 10. Turn multipurpose knob a to adjust the custom mask Vertical Margin, as shown in the resulting side-bezel menu. A positive value will spread the upper and lower mask segments apart.
- Page 177 Analyze Waveform or Trace Data 4. From the resulting side-bezel menu, push Recall Mask from File. Your mask text file should have an “.msk” file name extension and use the following format: :REM "Initialize the custom mask" :MASK:CUSTom INIT :REM "Mask Setup Information" :MASK:USER:LABEL "Custom Mask of STS-1"...
- Page 178 Analyze Waveform or Trace Data Setting Description Select Action on Failure Set how the oscilloscope responds to test failure. You can set multiple actions. These are: Stop acquisition Save waveform to file Save screen image to file Print screen image Aux out pulse Set a remote interface service request (SRQ) Select Action on Test Completion...
-
Page 179: Analyzing Power
Analyze Waveform or Trace Data Analyzing Power Acquire, measure, and analyze power signals with the DPO4PWR Power Analysis Module. To use this application: 1. Push Test. 2. Turn multipurpose knob a to select Power Analysis. 3. Push Analysis. Applica- Analysis tion None 4. -
Page 180: Save And Recall Information
Save and Recall Information Save and Recall Information The oscilloscope provides permanent storage for setups, waveforms, and screen images. Use the internal storage of the oscilloscope to save setup files and reference waveform data. Use external storage, such as USB flash drives or network drives, to save setups, waveforms, and screen images. Use the external storage to carry data to remote computers for further analysis and for archiving. - Page 181 Save and Recall Information PVT for a phase versus time trace TIQ for a baseband I & Q file Analog, digital, and RF waveforms and traces and those waveforms and traces derived from them (such as math NOTE. and reference) can be saved to an ISF file. When saving all channels in ISF format, a group of files will be saved. Each will have the same value for XXXX, but the YYY values will be set to the different channels that were turned on when the Save All Waveforms operation was performed.
-
Page 182: Saving A Screen Image
Save and Recall Information 6. Push Edit File Name. Edit the file name the same way you edit labels for channels. (See page 51, Labeling Channels and Buses.) 7. Push the Menu Off button to cancel the save operation, or push a side-bezel menu OK Save item to complete the operation. -
Page 183: Saving And Recalling Waveform And Trace Data
.csv files, not reference memories. The oscilloscope cannot recall digital waveforms. NOTE. The oscilloscope can save, but not recall, RF acquisitions as .TIQ files. You can use .TIQ files with Tektronix SignalVu Vector Signal Analysis software. MDO4000 Series Oscilloscopes User Manual... - Page 184 When saving RF trace data, you can select to save it as either the standard display data or as baseband I and Q data (.TIQ files). Use the I and Q data with Tektronix SignalVu Vector Signal Analysis software. 4. Rotate multipurpose knob b and select the location to save the waveform or trace data to or to recall it from.
- Page 185 Save and Recall Information 5. Push File Details to save to a USB or File Details network drive. This brings up the file manager screen. Use it to navigate to the desired drive and folder, and optionally to specify the file name. Skip this step to use the default name and location.
-
Page 186: Saving And Recalling Setups
Save and Recall Information 2. Push R1, R2, R3, or R4. (On) (Off) (Off) (Off) (R1) | (R2) | (R3) | (R4) | If you push the side-menu Ref Details, you can read whether the reference holds analog waveform or RF trace information. Removing a reference waveform from the display. - Page 187 Save and Recall Information 3. From the resulting side-bezel menu, select Save Setup the location to save the setup to or to recall it from. To File To save setup information to one of the ten internal setup memories in the oscilloscope, Edit Labels push the appropriate side-bezel button.
-
Page 188: Saving With One Button Push
Save and Recall Information 5. Save the file. Save to Selected File Quick Tips Recalling the Default Setup. Push the front-panel Default Setup button to initialize the oscilloscope to a known setup. (See page 53, Using the Default Setup.) Saving with One Button Push After you have defined the save/recall parameters with the Save/Recall Menu button and menu, you can save files with a single push of the Save button. -
Page 189: Managing Drives, Directories, And Files
Save and Recall Information 4. From now on, when you push Save the oscilloscope will perform the action that you just specified rather than requiring you to navigate through the menus each time. Managing Drives, Directories, and Files You can manage drives, directories, and files from the oscilloscope user interface. 1. -
Page 190: Printing A Hard Copy
Connect a non-PictBridge printer to a USB port on the rear or front panel of the oscilloscope. Alternatively, connect a PictBridge printer to the USB device port on the rear panel, or hook up a networked printer through the Ethernet port. NOTE. Refer to the www.tektronix.com/printer_setup Web page for a list of compatible printers. MDO4000 Series Oscilloscopes User Manual... - Page 191 Save and Recall Information Set Up Print Parameters To set up the oscilloscope to print hard copies: 1. Push Utility. 2. Push Utility Page. Utility Page 3. Turn multipurpose knob a and select Print Print Setup Setup. 4. Push Select Printer if you are changing the Utility Select Orientation...
- Page 192 Save and Recall Information 6. Choose Ink Saver On or Off. The On selection will print out a copy with a clear (white) background. Ink Saver on Ink Saver off Printing to a PictBridge Printer To set up the oscilloscope to print to a PictBridge printer: 1.
- Page 193 Save and Recall Information Device Port Connect to Computer 5. Push Connect to PictBridge Printer. Connect to PictBridge Printer Disabled (Off bus) Printing Over Ethernet To set up the oscilloscope to print over Ethernet: 1. Connect an Ethernet cable to the rear-panel Ethernet port.
- Page 194 Save and Recall Information 5. Push Select Printer. Utility Select Orientation Ink Saver Page Printer Landscape Print Setup 6. Push Add Network Printer. Network Printer Rename Printer Delete Network Printer 7. Turn multipurpose knob a to scroll through the list of letters, numbers, and other characters to find the first character in the printer name that you want to enter.
- Page 195 Save and Recall Information 10. Push the down arrow key to move the Printer character cursor down a row to the Server Name field. 11. Turn multipurpose knob a and push Select or Enter Character as often as needed to enter the name.
-
Page 196: Erasing Oscilloscope Memory
Save and Recall Information Erasing Oscilloscope Memory You can erase all setup and waveform information saved in the nonvolatile oscilloscope memory with the TekSecure function. If you have acquired confidential data on your oscilloscope, you may want to execute the TekSecure function before you return the oscilloscope to general use. - Page 197 Save and Recall Information 6. Power off the oscilloscope, and then power it back on to complete the process. MDO4000 Series Oscilloscopes User Manual...
-
Page 198: Using Application Modules
Some modules are described in the following list. Additional modules may be available. Contact your Tektronix representative or visit our Web site at www.tektronix.com for more information. Also, refer to Contacting Tektronix at the beginning of the manual. -
Page 199: Appendix A: Mdo4000 Specifications
Input Impedance, DC 50 Ω 50 Ω ±1% coupled MDO4104-3, VSWR ≤1.5:1 from DC to 1 GHz, typical MDO4104-6 MDO4054-3, VSWR ≤1.5:1 from DC to 500 MHz, typical MDO4054-6 13 pF ± 2 pF Input Capacitance, 1 MΩ DC coupled, typical 0.1 div with DC-50 Ω... - Page 200 DC coupled Instrument Volts/Div setting Bandwidth MDO4104-3, 5 mV/div – 10 V/div DC to 500 MHz MDO4104-6 2 mV/div – 4.98 mV/div DC to 350 MHz 1 mV/div – 1.99 mV/div DC to 175 MHz MDO4054-3, 5 mV/div – 10 V/div...
- Page 201 Appendix A: MDO4000 Specifications Table 2: Horizontal and acquisition system specifications (cont.) Characteristic Description Delta-time measurement The formula to calculate the delta-time measurement accuracy (DTA) for a given instrument setting and input signal is given below (assumes insignificant signal content accuracy above Nyquist and insignificant error due to aliasing): = slew rate around 1st point in measurement (1...
- Page 202 Table 4: RF Channel Characteristics (cont.) Characteristic Description Display Average Noise Level MDO4104-6 and MDO4054-6 50 kHz to 5 MHz: < -130 dBm/Hz (DANL) 5 MHz to 3 GHz: < -148 dBm/Hz 3 GHz to 6 GHz: < -140 dBm/Hz MDO4104-3 and MDO4054-3 50 kHz to 5 MHz: <...
-
Page 203: Appendix B: Tpp0500 And Tpp1000 500 Mhz And 1 Ghz 10X Passive Probes Information
The TPP0500 and TPP1000 10X Passive Probes are compact passive probes with 10X attenuation that are designed for use with Tektronix MDO4000 Series oscilloscopes. The probes have no user- or Tektronix-serviceable parts. Connecting the Probe to the Oscilloscope Connect the probe as shown in the illustrations below. - Page 204 Hook tip Press the hook tip onto the probe tip and then clamp the hook onto the circuit Reorder Tektronix part number 013-0362-XX Micro Hook tip Use this tip to access test points in tight spaces. Press the hook tip onto the probe tip and then...
-
Page 205: Optional Accessories
Compact Probe Tip Ckt Board Test Point 131-4210-xx Wire, spool, 32 AWG 020-3045-xx Replacing the Probe Tip Order Tektronix part number 206-0610-xx for rigid tip replacement, or order part number 206-0611–xx for pogo pin replacement. MDO4000 Series Oscilloscopes User Manual... -
Page 206: Specifications
Appendix B: TPP0500 and TPP1000 500 MHz and 1 GHz 10X Passive Probes Information Specifications Table 7: Electrical and mechanical specifications Characteristic TPP0500 TPP1000 Bandwidth (–3 dB) 500 MHz 1 GHz <350 ps <700 ps System rise time (typical) System input capacitance Rigid tip: 3.9 pF ±0.3 pf Pogo pin tip: 5.1 pf ±0.5 pf System attenuation accuracy... - Page 207 Equipment Recycling. This product complies with the European Union’s requirements according to Directive 2002/96/EC on waste electrical and electronic equipment (WEEE). For more information about recycling options, check the Support/Service section of the Tektronix Web site (www.tektronix.com). MDO4000 Series Oscilloscopes User Manual...
-
Page 208: Safety Summary
Appendix B: TPP0500 and TPP1000 500 MHz and 1 GHz 10X Passive Probes Information Safety Summary Review the following safety precautions to avoid injury and prevent damage to this product or any products connected to it. To avoid potential hazards, use this product only as specified. Using the probe or accessories in a manner not specified could result in a shock or fire hazard. - Page 209 Appendix B: TPP0500 and TPP1000 500 MHz and 1 GHz 10X Passive Probes Information Symbols on the Product. These symbols may appear on the product: MDO4000 Series Oscilloscopes User Manual...
-
Page 210: Appendix C: P6616 General-Purpose Logic Probe Information
Appendix C: P6616 General-Purpose Logic Probe Information Product Description The P6616 general-purpose logic probe connects the Tektronix MDO4000 Series of mixed-signal oscilloscopes to digital buses and signals on your target system. The probe contains 16 data channels split between two lead sets (GROUP 1 and GROUP 2). -
Page 211: Connecting The Probe To Your Circuit
Appendix C: P6616 General-Purpose Logic Probe Information Connecting the Probe to Your Circuit Attach the probe to the circuit using the appropriate connectors and adapters. Select the best method for your needs, and then proceed to Setting up the Probe. To set and view the digital channel parameters, do the following: Push the D15–D0 button. -
Page 212: Typical Application
Instructions 1 ea 071-2831-XX Instructions are included with the probe, but not in the accessory kit. The instructions can be downloaded at www.tektronix.com/manuals. These optional accessories can be ordered for your probe: Description Part number P6960 Probe D-MAX Footprint to Square Pin Header Adapter... -
Page 213: Specifications
Equipment Recycling. This product complies with the European Union’s requirements according to Directive 2002/96/EC on waste electrical and electronic equipment (WEEE). For more information about recycling options, check the Support/Service section of the Tektronix Web site (www.tektronix.com). MDO4000 Series Oscilloscopes User Manual... -
Page 214: Safety Summary
Appendix C: P6616 General-Purpose Logic Probe Information Safety Summary To avoid potential hazards, use this probe only as specified. Connect and Disconnect Properly. Connect the probe output to the measurement instrument before connecting the probe to the circuit under test. Disconnect the probe input and the probe ground from the circuit under test before disconnecting the probe from the measurement instrument. - Page 215 Appendix C: P6616 General-Purpose Logic Probe Information MDO4000 Series Oscilloscopes User Manual...
- Page 216 Index Index Symbols and Numbers Audio Button bus trigger, 88 Acquire, 35, 57, 96 50 Ω protection, 105 Auto Level, 78 Ampl, 37, 77 Auto trigger mode, 80 Autoset, 12, 35, 40, 51, 54 Auto-magnify mode, 149 B/W, 37 Autoset, 54 B1 / B2 / B3 / B4, 36, 60, 61, 86 About, 23 Video, 55...
- Page 217 Index Date and time, changing, 17 Envelope acquisition mode, 57 Default Setup, 53, 169 Erase setup and ref memory, 177 Calibration, 19, 20 button, 41, 50, 53 Ethernet, 25, 26, 27, 36, 60, 86 Calibration certificate, 1 menu, 41 bus trigger, 89 CAN, 36, 60, 86 Undo, 54 port, 48...
- Page 218 Index Frequency versus time Histogram measurements, 125 How to baseline indicator, 114 Hits in Box measurement, 125 calibrate a TPP0500 or Frequency versus time trace, 113 Holdoff, trigger, 81 TPP1000 voltage Frequency, center, 77 Horizontal delay, 81 probe, 12 Front cover, 2 Horizontal lines compensate a non-TPP0500 Front panel, 33...
- Page 219 Index Left Justified (LJ), 36, 60, 86 Measurements Level, trigger, 82 automatic, 121 I2C, 36, 60, 86 License transfers for application cursor, 129 I2S, 36, 60, 86 modules, 15 defined, 122 Icon Limit testing, 154 frequency domain, 120 Expansion point, 43 LIN, 36, 60, 86 histogram, 125 Trigger level, 44...
- Page 220 Index Negative Pulse Width Play, 145 Probes measurement, 122 Play-pause BNC, 8 Network printing, 174 button, 39, 145 connecting, 8 Networked drives, mounting and mode, 145 ground lead, 15 Pollution Degree, 5 logic, 8 unmounting, 170 NEX-HD2HEADER, 3 Portrait, 164, 172 P6616, 191 Next button, 39 Position...
- Page 221 Index Rename a drive, directory, or Securing memory, 177 Stop an acquisition, 93 file, 170 Security lock, 9 Switch, power, 40 Resolution bandwidth, 78 Select button, 38 RF Acquisition time, 151 Selecting a keyboard key layout RF button, 20, 37, 46, 110 style, 32 Table, Event, 63 RF input connector, 33, 47...
- Page 222 Index data matching on a rolling Trigger menu, 35, 83, 91 Video window, 89 button, 83 Autoset, 55 delayed, 91 Trigger modes port, 48 Edge, defined, 84 Auto, 80 Video trigger, defined, 86 Ethernet bus, 89 Normal, 80 View event, defined, 80 Trigger types, defined, 84 digital channels, 108 FlexRay bus, 88...
Need help?
Do you have a question about the MDO4104-6 and is the answer not in the manual?
Questions and answers