
Related Manuals for Tektronix MDO3104


Summary of Contents for Tektronix MDO3104
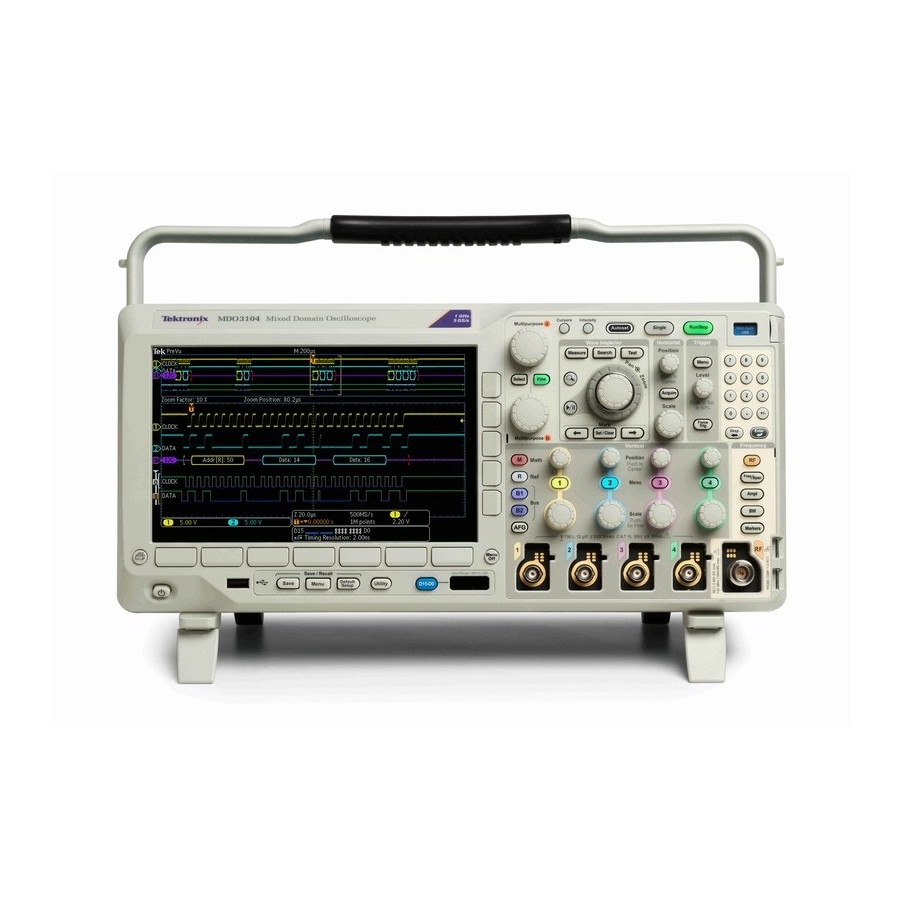
- Page 1 MDO3000 Series Mixed Domain Oscilloscopes User Manual *P077096802* 077-0968-02...
- Page 3 MDO3000 Series Mixed Domain Oscilloscopes User Manual www.tek.com 077-0968-02...
- Page 4 Copyright © Tektronix. All rights reserved. Licensed software products are owned by Tektronix or its subsidiaries or suppliers, and are protected by national copyright laws and international treaty provisions. Tektronix products are covered by U.S. and foreign patents, issued and pending. Information in this publication supersedes that in all previously published material.
- Page 5 Warranty Tektronix warrants that the product will be free from defects in materials and workmanship for a period of three (3) years from the date of original purchase from an authorized Tektronix distributor. If the product proves defective during this warranty period, Tektronix, at its option, either will repair the defective product without charge for parts and labor, or will provide a replacement in exchange for the defective product.
- Page 6 Warranty Tektronix warrants that the product will be free from defects in materials and workmanship for a period of one (1) year from the date of original purchase from an authorized Tektronix distributor. If the product proves defective during this warranty period, Tektronix, at its option, either will repair the defective product without charge for parts and labor, or will provide a replacement in exchange for the defective product.
-
Page 7: Table Of Contents
Table of Contents Table of Contents Important safety information ......................General safety summary.. - Page 8 Table of Contents Using FastAcq........................How the Analog Acquisition Modes Work ..
- Page 9 Table of Contents Auto-magnify ........................Limit and Mask Testing.
- Page 10 Table of Contents MDO3000 Series Oscilloscopes User Manual...
-
Page 11: Important Safety Information
Do not connect or disconnect probes or test leads while they are connected to a voltage source. Use only insulated voltage probes, test leads, and adapters supplied with the product, or indicated by Tektronix to be suitable for the product. - Page 12 Be sure your work area meets applicable ergonomic standards. Consult with an ergonomics professional to avoid stress injuries. Use only the Tektronix rackmount hardware specified for this product. Probes and test leads Before connecting probes or test leads, connect the power cord from the power connector to a properly grounded power outlet.
- Page 13 Important safety information Keep fingers behind the finger guards on the probes. Remove all probes, test leads and accessories that are not in use. Use only correct Measurement Category (CAT), voltage, temperature, altitude, and amperage rated probes, test leads, and adapters for any measurement. Beware of high voltages.
-
Page 14: Service Safety Summary
Important safety information Service safety summary The Service safety summary section contains additional information required to safely perform service on the product. Only qualified personnel should perform service procedures. Read this Service safety summary and the General safety summary before performing any service procedures. To avoid electric shock. -
Page 15: Terms In This Manual
Important safety information Terms in this manual These terms may appear in this manual: WARNING. Warning statements identify conditions or practices that could result in injury or loss of life. CAUTION. Caution statements identify conditions or practices that could result in damage to this product or other property. Symbols and terms on the product These terms may appear on the product: DANGER indicates an injury hazard immediately accessible as you read the marking. -
Page 16: Compliance Information
EN 61000-3-2:2006. AC power line harmonic emissions EN 61000-3-3:1995. Voltage changes, fluctuations, and flicker European contact. Tektronix UK, Ltd. Western Peninsula Western Road Bracknell, RG12 1RF United Kingdom This product is intended for use in nonresidential areas only. Use in residential areas may cause electromagnetic interference. -
Page 17: Safety Compliance
Compliance information Australia / New Zealand Declaration of Conformity – EMC Complies with the EMC provision of the Radiocommunications Act per the following standard, in accordance with ACMA: CISPR 11:2003. Radiated and Conducted Emissions, Group 1, Class A, in accordance with EN 61326-1:2006 and EN 61326-2-1:2006. - Page 18 Compliance information Additional compliances IEC 61010-1. Safety Requirements for Electrical Equipment for Measurement, Control, and Laboratory Use – Part 1: General Requirements. IEC 61010-2-030. Safety Requirements for Electrical Equipment for Measurement, Control, and Laboratory Use – Part 2-030: Particular requirements for testing and measuring circuits. Equipment type Test and measuring equipment.
- Page 19 Compliance information Measurement and overvoltage category descriptions Measurement terminals on this product may be rated for measuring mains voltages from one or more of the following categories (see specific ratings marked on the product and in the manual). Category II. Circuits directly connected to the building wiring at utilization points (socket outlets and similar points). Category III.
-
Page 20: Environmental Considerations
This symbol indicates that this product complies with the applicable European Union requirements according to Directives 2002/96/EC and 2006/66/EC on waste electrical and electronic equipment (WEEE) and batteries. For information about recycling options, check the Support/Service section of the Tektronix Web site (www.tektronix.com). -
Page 21: Preface
Preface Preface This manual describes the installation and operation of the following oscilloscopes: Model MDO3104 MDO3102 MDO3054 MDO3052 MDO3034 Bandwidth 500 MHz 500 MHz 350 MHz 1 GHz 1 GHz Analog Channels Digital Channels RF Channels Sample Rate 5 GS/s 5 GS/s 2.5 GS/s... -
Page 22: Key Features
Models are available with bandwidths from 100 MHz to 1 GHz Sample rates of 2.5 GS/s on all analog channels (5 GS/s on 1 or 2 channels for the MDO3104 or MDO3102) 10 M points record length on all channels Maximum waveform capture rate: >280,000 waveforms/second with FastAcq. -
Page 23: Installation
Before Installation Unpack the oscilloscope and check that you received all items listed as standard accessories. The following pages list recommended accessories and probes, instrument options, and upgrades. Check the Tektronix Web site (www.tektronix.com) for the most current information. Standard accessories... - Page 24 Installation Standard accessories (cont.) Tektronix part Accessory Description number Power Cord North America (Option A0) 161-0348-XX 161-0343-XX Universal Euro (Option A1) United Kingdom (Option A2) 161-0344-XX Australia (Option A3) 161-0346-XX Switzerland (Option A5) 161-0347-XX Japan (Option A6) 161-0342-XX 161-0341-00 China (Option A10)
- Page 25 Add password protected security to enable or disable all communication ports and firmware upgrades to any MDO3000 Series oscilloscope. Bandwidth upgrades Upgrade the analog bandwidth on MDO3000 Series products post-purchase. Visit www.tektronix.com for information on available upgrade products. Optional accessories Tektronix part...
- Page 26 Installation Optional accessories (cont.) Tektronix part Accessory Description number Hard transit case Traveling case, which requires use of the soft HCTEK4321 transit case (ACD3000) Front cover Hard plastic cover to help protect the 200-5052-00 instrument Demonstration Board Electronic circuit board used for demonstration 020-3087-XX and training on the MDO3000 Series.
-
Page 27: Operating Considerations
Tektronix MDO3000 Series oscilloscopes The MDO3000 Series oscilloscopes support a multitude of optional probes. (See page 7, Connecting Probes.) Visit the Oscilloscope Probe and Accessory Selector Tool on the Tektronix Web site (www.tektronix.com/probes) for the most up to date information. Operating Considerations MDO3000 Series Oscilloscopes Mains Input Voltage: 100 V to 240 V ±10%... - Page 28 Installation Humidity: Operating: 5% to 90% relative humidity (% RH) at up to +40°C, 5% to 60% RH above +40 C up to +55°C, non-condensing Non-Operating: 5% to 90% RH (Relative Humidity) at up to +40 C, 5% to 60% RH above +40°C up to +55°C, 5% to 40% RH above +55 °C up to +71 °C non-condensing Altitude:...
-
Page 29: Connecting Probes
To avoid damage to the surface of the oscilloscope or probes, do not use any abrasive or chemical cleaning agents. Connecting Probes The oscilloscope supports probes with the following: 1. Tektronix Versatile Probe Interface (TekVPI) These probes support two-way communication with the oscilloscope through on-screen menus and remotely through programmable support. -
Page 30: Securing The Oscilloscope
TekVPI probes in the RF input. For more information on the many probes available for use with MDO3000 Series oscilloscopes, visit the Oscilloscope Probe and Accessory Selector Tool on the Tektronix website at www.tektronix.com. Securing the Oscilloscope 1. Use a standard laptop computer style security lock to secure your oscilloscope to your location. -
Page 31: Powering On The Oscilloscope
Installation Powering on the Oscilloscope Ground the Oscilloscope and Yourself To power on the instrument, connect the power cord that was provided with the instrument to the power connector on the rear panel. Connect the power cord to a properly grounded electrical outlet. To power off the instrument, remove the power cord from the instrument. -
Page 32: Powering Off The Oscilloscope
Installation Powering off the Oscilloscope To power off the oscilloscope and remove the power cord: 1. Push the power button on the instrument front-panel to turn the instrument off. 2. If you want to remove power completely, disconnect the power cord from the rear-panel of the instrument. Functional Check Perform this quick functional check to verify that your oscilloscope is operating correctly. -
Page 33: Compensating A Tpp0250, Tpp0500B Or Tpp1000 Passive Voltage Probe
Installation 3. Connect the probe connector to oscilloscope channel 1 and the probe tip and reference lead to the PROBE COMP terminals on the oscilloscope front panel. 4. Push Default Setup. 5. Push Autoset. The screen should now display a square wave, approximately 2.5 V at 1 kHz. - Page 34 Installation 3. Connect the probe connector to the oscilloscope channel, and the probe tip and reference lead to the PROBE COMP terminals on the oscilloscope front panel. NOTE. Connect only one probe at a time to the probe comp terminals. 4.
-
Page 35: Compensating A Non-Tpp0250, Non-Tpp0500B Or Non-Tpp1000 Passive Voltage Probe
TPP1000 probes (See page 11, Compensating a TPP0250, TPP0500B or TPP1000 Passive Voltage Probe.). On a non-TPP0250/TPP0500B/TPP1000 Tektronix passive probe, check the instruction manual for your probe to see if it qualifies. Otherwise, to properly compensate your passive probe: 1. -
Page 36: Application Module Free Trial
Installation 2. Check the shape of the displayed waveform to determine if your Properly compensated probe is properly compensated. Under compensated Over compensated 3. If necessary, adjust your probe. Repeat as needed. Quick Tips Use the shortest possible ground lead and signal path to minimize probe-induced ringing and distortion on the measured signal. -
Page 37: Upgrading Bandwidth
Installation Optional application module packages extend the capability of your oscilloscope. You can physically install up to two application modules at one time. Application modules can go into the slots with a window in the upper right corner of the front panel. One additional slot is directly behind the one that you can see. To use the hidden slot, install the module with the label facing away from you. - Page 38 Installation 200 MHz 1 GHz MDO3BW2T102 350 MHz 500 MHz MDO3BW3T52 350 MHz 1 GHz MDO3BW3T102 500 MHz 1 GHz MDO3BW5T102 MDO3014 100 MHz 200 MHz MDO3BW1T24 100 MHz 350 MHz MDO3BW1T34 100 MHz 500 MHz MDO3BW1T54 100 MHz 1 GHz MDO3BW1T104 200 MHz 350 MHz...
- Page 39 To enable the upgrade, you will need to order a bandwidth upgrade product. 1 GHz upgrades require you to send your instrument to a Tektronix Service Center. All others can be performed in the field by the customer. You will need to supply the model number and serial number when placing your order. To determine the serial number of your instrument, push Utility, and then push About.
-
Page 40: Changing The Language Of The User Interface Or Keyboard
Installation 5. On the side menu, push License Type until License Type Options is highlighted. Modules Options 6. Push Install Option. Install Option 7. Enter the Option Key number by turning Enter Character Multipurpose a and pushing Enter Character on the lower menu. Alternatively, you may use a USB keyboard. - Page 41 Installation 2. Push Utility Page. Utility Page 3. Turn Multipurpose a and select Config. Config 4. Push Language from the resulting lower Utility Language Set Date & About Manage Page Time Modules & menu. Options Config Language 5. Push Menus from the resulting side menu Menus (a) English and turn Multipurpose a to select the...
-
Page 42: Changing The Date And Time
Installation Changing the Date and Time To set the internal clock with the current date and time: 1. Push Utility. 2. Push Utility Page. Utility Page 3. Turn Multipurpose a and select Config. Config 4. Push Set Date & Time. Utility Language Set Date &... -
Page 43: Signal Path Compensation
Installation Signal Path Compensation Signal Path Compensation (SPC) corrects for DC inaccuracies caused by temperature variations and/or long-term drift. Run the compensation whenever the ambient temperature has changed by more than 10 °C (18 °F) or once a week if you use vertical settings of 5 mV/division or less. Failure to do so may result in the instrument not meeting warranted performance levels at those volts/div settings. - Page 44 Service personnel use the factory calibration functions to calibrate the internal voltage references of the oscilloscope using external sources. Contact your Tektronix field office or representative for assistance with factory calibration. NOTE. Signal Path Compensation does not include calibration to the probe tip. (See page 13, Compensating a non-TPP0250, non-TPP0500B or non-TPP1000 Passive Voltage Probe.)
-
Page 45: Upgrading Firmware
Installation Upgrading Firmware To upgrade the firmware of the oscilloscope: 1. Open up a Web browser and go to www.tektronix.com/software/downloads. Proceed to the software finder. Download the latest firmware for your oscilloscope on your PC. Unzip the files and copy the firmware.img file into the root folder of a USB flash drive... - Page 46 Installation 4. Power on the oscilloscope. The instrument automatically recognizes the replacement firmware and installs it. If the instrument does not install the firmware, rerun the procedure. If the problem continues, try a different model of USB flash or hard drive. Finally, if needed, contact qualified service personnel.
- Page 47 Installation 8. Push Utility Page. Utility Page 9. Turn Multipurpose a and select Config. Config 10. Push About. The oscilloscope displays the Utility Language Set Date & About Manage Page Time Modules & firmware version number. Options Config 11. Confirm that the version number matches that of the new firmware.
-
Page 48: Connecting Your Oscilloscope To A Computer
For VISA, load the VISA drivers on your computer. Also, load your application, such as OpenChoice Desktop. You will find the drivers and OpenChoice Desktop software on the appropriate CD that comes with your oscilloscope or at the Tektronix software finder Web page (www.tektronix.com). - Page 49 Installation 2. Connect the oscilloscope to your computer with the appropriate USB or Ethernet cable. To communicate between the oscilloscope and a GPIB system, connect the oscilloscope to the TEK-USB-488 GPIB-to-USB Adapter with a USB cable. Then connect the adapter to your GPIB system with a GPIB cable.
- Page 50 Installation 7. To use Ethernet, push Ethernet & LXI on the lower menu. Use the side menu buttons to adjust your network settings, as needed. For more information, see the e*Scope setup information below. 8. If you want to change socket server parameters, push Socket Server and enter new values through the resulting side menu.
- Page 51 These include tool bars that speed connectivity with Microsoft Excel and Word. There is also a standalone acquisition program called Tektronix OpenChoice Desktop. The rear-panel USB 2.0 device port is the correct USB port for computer connectivity. Use the rear and front panel USB 2.0 host port to connect your oscilloscope to USB flash drives.
- Page 52 Installation 3. Push Utility Page. Utility Page 4. Turn Multipurpose a and select I/O. 5. Push Ethernet & LXI. Utility Ethernet & Network Socket GPIB Page Configura- Server Computer tion Automatic 6. View the top item on the side menu to Ethernet &...
- Page 53 Installation Ethernet & 11. Push Change Names to change the name Change Names of the oscilloscope, the network domain, or the service name. 12. Push Change Ethernet & LXI Password to Change Ethernet change the name of the password. & LXI Password 13.
- Page 54 Installation 16. For e*Scope, click the Instrument Control (e*Scope) link on the left side of the LXI Welcome page. You should then see a new tab (or window) open in your browser with e*Scope running. Using a Socket Server A socket server provides two-way communication over an Internet Protocol-based computer network. You can use your oscilloscope’s socket server feature to let your oscilloscope communicate with a remote-terminal device or computer.
- Page 55 Installation 2. Push Utility. 3. Push Utility Page. Utility Page 4. Turn Multipurpose a and select I/O. 5. Push Socket Server. Utility Ethernet & Network Socket GPIB Page Configura- Server Computer tion Manual Socket Server 6. On the resulting Socket Server side menu, Enabled Disabled push the top entry to highlight Enabled.
- Page 56 Installation 10. After you have set up the socket server parameters, the computer is now ready to communicate with the oscilloscope. If you are running an MS Windows PC, you could run its default client Telnet, which has a command interface. One way to do this is by typing “...
-
Page 57: Connecting A Usb Keyboard To Your Oscilloscope
Installation 12. You can now type in a standard query, such *idn? The Telnet session window will respond by displaying a character string describing your instrument. You can type in more queries and view more results using this Telnet session window. -
Page 58: Get Acquainted With The Instrument
Get Acquainted with the Instrument Get Acquainted with the Instrument Front-Panel Menus, Controls, and Connectors Overview The front panel has buttons and controls for the functions that you use most often. Use the menu buttons to access more specialized functions. 1. -
Page 59: Front Panel Menus And Controls
Get Acquainted with the Instrument Front Panel Menus and Controls The front panel has buttons and controls for the functions that you use most often. Use the menu buttons to access more specialized functions. Using the Menu System To use the menu system: 1. - Page 60 Get Acquainted with the Instrument 4. To remove a side menu, push the lower button again or push Menu Off. 5. Certain menu choices require you to set a numeric value to complete the setup. You can use the upper and lower multipurpose knobs a and b to adjust values.
- Page 61 Get Acquainted with the Instrument 5. Acquire. Push to set the acquisition mode and adjust the record length. 6. Trigger Menu. Push to specify trigger settings. 7. M. Push to manage the math waveform, including the display or removal of the math waveform from the display. 8.
- Page 62 Get Acquainted with the Instrument 4. B1 or B2. Push to define and display a bus if you have the appropriate module application keys. MDO3AERO supports ARINC429 and MIL-STD-1553 buses. MDO3AUDIO supports I S, Left Justified (LJ), Right Justified (RJ), and TDM buses.
- Page 63 Get Acquainted with the Instrument Using Spectral Analysis Controls These buttons configure the acquisition and display of the RF input. 1. RF. Push to bring up the frequency domain display and menu. The RF menu provides access to the Spectrogram display.
- Page 64 Get Acquainted with the Instrument For example, when using the two vertical cursors (and no horizontal ones are visible), you can push this button to link or unlink the cursors. When the two vertical and two horizontal cursors are both visible, you can push this button to make either the vertical cursors or the horizontal cursors active.
- Page 65 Get Acquainted with the Instrument 14. Horizontal Position. Turn to adjust the trigger point location relative to the acquired waveforms. Push to center when delay is on. Push to set to 10% when delay is off. 15. Horizontal Scale. Turn to adjust the horizontal scale (time/division). 16.
- Page 66 Get Acquainted with the Instrument 21. Print. Push to print to the selected printer. 22. Power switch. Push to power on or off the oscilloscope. 23. USB 2.0 Host port. Insert a USB peripheral to the oscilloscope, such as a keyboard or a flash drive. 24.
- Page 67 Get Acquainted with the Instrument Identifying Items in the Time Domain Display The items shown in the graphic below may appear in the display. Not all of these items are visible at any given time. Some readouts move outside the graticule area when menus are turned off. 1.
- Page 68 Get Acquainted with the Instrument 4. The waveform record view shows the trigger location relative to the waveform record. The line color corresponds to the selected waveform color. The brackets show the part of the record currently displayed on the screen. 5.
- Page 69 Get Acquainted with the Instrument 11. The horizontal position/scale readout shows on the top line the horizontal scale (adjust with the Horizontal Scale knob). With Delay Mode on, the bottom line shows the time from the T symbol to the expansion point icon (adjust with the Horizontal Position knob).
- Page 70 Get Acquainted with the Instrument 17. The group icon indicates when digital channels are grouped. 18. The bus display shows decoded packet level information for serial buses or for parallel buses. The bus indicator shows the bus number and bus type. 19.
- Page 71 Get Acquainted with the Instrument 1. Vertical graticule labels 2. Start frequency 3. Reference level 4. Vertical scale 5. Center frequency 6. Span and resolution bandwidth 7. Stop frequency 8. Reference marker MDO3000 Series Oscilloscopes User Manual...
- Page 72 Get Acquainted with the Instrument Identifying Items in the Arbitrary Function Generator Display 1. If visible, the output is on 2. AFG label 3. Waveform type, e.g. “Sine” 4. Additive Noise icon 5. Frequency 6. Amplitude (See page 185, Use the Arbitrary Function Generator.) MDO3000 Series Oscilloscopes User Manual...
- Page 73 Get Acquainted with the Instrument Identifying Items in the Digital Voltmeter Display 1. Measurement type (AC+DC RMS, DC, AC RMS, or Frequency) 2. Numerical value of the current measurement 3. Graphic (min, max, value, five-second rolling range) The number on the left side of the graphic’s linear scale is the minimum value of the range (e.g. 0.000 V). The number on the right side of the graphic’s linear scale is the maximum value of the range (e.g.
-
Page 74: Front Panel Connectors
Get Acquainted with the Instrument Front Panel Connectors 1. Logic Probe Connector 2. Channel 1, 2, 3, 4. Channel inputs with TekVPI Versatile Probe Interface. 3. RF input connector. 4. PROBE COMP. Square wave signal source to compensate or calibrate probes. -
Page 75: Rear-Panel Connectors
Get Acquainted with the Instrument Rear-Panel Connectors 1. AFG OUT. Use the AFG OUT port to transmit signals from the arbitrary function generator. 2. AUX OUT 3. LAN. Use the LAN (Ethernet) port (RJ-45 connector) to connect the oscilloscope to a 10/100 Base-T local area network. 4. -
Page 76: Acquire The Signal
Acquire the Signal Acquire the Signal This section describes concepts of and procedures for setting up the oscilloscope to acquire the signal as you want it to. Setting Up Analog Channels Use front panel buttons and knobs to set up your instrument to acquire signals using the analog channels. 1. - Page 77 Acquire the Signal 5. Push the desired channel button. Then adjust the vertical position and scale. 6. Adjust the horizontal position and scale. The horizontal position determines the number of pretrigger and posttrigger samples. The horizontal scale determines the size of the acquisition window relative to the waveform.
- Page 78 Acquire the Signal 2. Push a lower menu button to create a label, Label such as for channel 1 or B1. 3. Push Choose Preset Label to view a list Choose Preset of labels. Label 4. Turn Multipurpose b to scroll through the list to find a suitable label.
-
Page 79: Using The Default Setup
Acquire the Signal 7. Turn Multipurpose a to scroll through the list of letters, numbers, and other characters to find the character in the name that you want to enter. ABCDEFGHIJKLMNOPQRSTUVWXYZ abcdefghijklmnopqrstuvwxyz 0123456789_=+-!@#$%^&*()[]{}<>/~'”\|:,.? 8. Push Select or Enter Character to let the oscilloscope know that you have picked the proper character to use. -
Page 80: Using Autoset
Acquire the Signal Using Autoset Autoset adjusts the instrument (acquisition, horizontal, trigger, and vertical controls) such that it displays four or five waveform cycles for analog channels with the trigger near the midlevel, and ten cycles for digital channels. Autoset works with both the analog and digital channels. 1. -
Page 81: Acquisition Concepts
Acquire the Signal 4. Select the desired setting using the side Autoset Enabled menu. Autoset Disabled Quick Tips To position the waveform appropriately, Autoset may change the vertical position. Autoset always sets vertical offset to 0 V. If you use Autoset when no channels are displayed, the instrument turns on channel 1 and scales it. If you use Autoset and the oscilloscope detects a video signal, the oscilloscope automatically sets the trigger type to video and makes other adjustments to display a stable video signal. -
Page 82: Using Fastacq
Acquire the Signal Waveform Record The instrument builds the waveform record through use of the following parameters: Sample interval: The time between recorded sample points. Adjust this by turning the Horizontal Scale knob or pushing Acquire and changing the record length in the Acquire menu. Record length: The number of samples required to fill a waveform record. - Page 83 Acquire the Signal 2. Push FastAcq. Mode Record FastAcq Delay Set Horiz. Waveform XY Display Length Position to Display Sample FastACq 3. Toggle the FastAcq side-menu button to Fast Acq select On. 4. Push Waveform Palette. Waveform Palette a Temper- ature 5.
-
Page 84: How The Analog Acquisition Modes Work
Acquire the Signal How the Analog Acquisition Modes Work Sample mode retains the first sampled point from each acquisition interval. Sample is the default mode. Peak Detect mode uses the highest and lowest of all the samples contained in two consecutive acquisition intervals. - Page 85 Acquire the Signal 3. Then choose the acquisition mode from the Acquisition Mode side menu. You can chose from: Sample, Peak Detect, Hi Res, Envelope, or Average. Sample Peak Detect Hi Res Envelope Average NOTE. Peak Detect and Hi Res modes take advantage of sample points that the oscilloscope would have discarded at lower sweep speeds.
-
Page 86: Using Roll Mode
Acquire the Signal 7. Push Delay on the lower menu to select On when you want to delay the acquisition relative to the trigger event. With Delay set to On, turn the Horizontal Position knob counterclockwise to increase the delay. The trigger point will move to the left and ultimately outside of the acquired waveform. -
Page 87: Act On Event
Acquire the Signal Act on Event Tell the oscilloscope to perform a defined action after a defined event has occurred. The event can be a trigger or a certain number of acquisitions. The action can be to: Stop acquisitions Save a waveform or a screen image to a file Print Send a pulse out the AUX OUT port Generate a remote interface SRQ... - Page 88 Acquire the Signal Event Type None Trigger Acquisi- tions (a) 10 5. Push Actions on the lower menu. This brings up the Actions side menu. Use the menu to select an action to occur on the event. Actions 6. Select the action type from the resulting Select Actions pop-out menu.
-
Page 89: Setting Up A Serial Or Parallel Bus
Acquire the Signal Setting Up a Serial or Parallel Bus Your oscilloscope can decode and trigger on signal events or conditions that occur on: Bus type With this hardware Audio (I S, Left Justified (LJ), Right MDO3AUDIO application module Justified (RJ), and TDM) CAN, CAN FD, and LIN MDO3AUTO application module FlexRay... - Page 90 Acquire the Signal 2. Push Trigger Menu and enter trigger parameters. (See page 92, Choosing a Trigger Type.) You can display bus information without triggering on the bus signal. Setting Up Bus Parameters NOTE. For most bus sources, you may use any combination of channels 1 through 4, and D15 through D0. With some buses, you may also use Ref 1 through 4 and Math as sources for protocol decode.
- Page 91 Acquire the Signal Use the side menu buttons to define Define Inputs parameters for the inputs, such as specific signals to an analog or digital channel. If you select Parallel, push the side menu Clocked Data button to enable or disable Clocked Data. Push the side menu button to select the Clock Edge...
- Page 92 Acquire the Signal 5. Optionally, push B1 Label to edit the label for Bus B1 Define Thresholds B1 Label Event Parallel Display Table Inputs Parallel the bus. (See page 55, Labeling Channels and Buses.) 6. Push Bus Display and use the side menu to define how to display the parallel or serial bus.
- Page 93 Acquire the Signal This example of an Event Table is from an RS-232 bus. RS-232 event tables display one line for each 7- or 8-bit byte when Packets are set to Off. RS-232 event tables display one line for each packet when Packets are set to On.
- Page 94 Acquire the Signal 4. Push Thresholds to configure the high and Bus B1 Define Thresh- Configure B1 Label Event olds Display Table Inputs low thresholds for the ARINC429 bus being INC429 800mV INC429 acquired or select from available presets. 0.00 V 5.
- Page 95 Acquire the Signal SPI Bus To acquire data from an SPI bus, you need to also set up these items: 1. If you selected SPI, push Define Inputs and Bus B1 Define Thresholds Configure B1 Label Event Display Table Inputs the appropriate side menu choices.
- Page 96 Acquire the Signal RS-232 Bus To acquire data from a RS-232 bus, you need to also set up these items: 1. If you selected RS-232, push Configure and Bus B1 Define Thresholds Configure B1 Label Event RS-232 Display Table Inputs RS-232 the desired side menu choices.
- Page 97 Acquire the Signal CAN, CAN FD BUS To acquire data from a CAN or CAN FD bus, you need to set up these items: 1. If you selected CAN, push Define Inputs Bus B1 Define Thresh- Configure B1 Label Event Table olds Display Inputs...
- Page 98 Acquire the Signal 6. Push Standard to select between CAN 2.0 Standard and CAN FD decode/trigger standards. CAN 2.0 While CAN FD is backwards compatible CAN FD with CAN 2.0 packets, CAN 2.0 should be selected for best performance with non CAN Bit Rate FD bus configurations.
- Page 99 Acquire the Signal LIN Bus To acquire data from a LIN bus, you need to also set up these items: 1. If you selected LIN, push Define Inputs and Bus B1 Define Thresholds Configure B1 Label Event Display Table Inputs the appropriate side menu choices.
- Page 100 Acquire the Signal FlexRay Bus To acquire data from a FlexRay bus, you need to also set up these items: 1. If you selected FlexRay , push Define Bus B1 Define Thresholds Bit Rate B1 Label Event FlexRay Display Table Inputs FlexRay Inputs and the desired side menu choices.
- Page 101 Acquire the Signal USB Bus To acquire data from a USB bus, you need to also set up these items: 1. If you selected USB, push Define Inputs to Bus B1 Define Thresholds B1 Label Event Display Table Inputs set the USB bus speed and probe type. Full Speed 2.
- Page 102 Acquire the Signal Physical Layer Bus Activity Oscilloscope waveform traces from analog channels 1 to 4, digital channels D15 to D0, Math waveforms, and the traces you see when you choose to display a bus always show the physical layer bus activity. In the physical layer display, bits that were transmitted earlier are to the left, and bits that were transmitted later are to the right.
-
Page 103: Setting Up Digital Channels
Acquire the Signal Setting Up Digital Channels Use front panel buttons and knobs to set up your instrument to acquire signals using the digital channels. 1. Connect the P6316 16-channel logic probe to the input signal source. 2. Connect the ground lead or leads to the circuit ground. - Page 104 Acquire the Signal 7. Turn Multipurpose a to scroll through the list of digital channels. Turn Multipurpose b to position the selected channel. As you position channels close to each other on the display, the oscilloscope groups the channels, and adds the group to the pop-up list.
-
Page 105: When And Why To Turn On Magnivu
When and Why to Turn On MagniVu Tektronix MagniVu acquisition technology allows you to have higher timing resolution so that you can more accurately determine edge placement and make more precise timing measurements on digital edges. Using MagniVu, you can see up to 16 times more detail than you can using normal digital channel sampling. -
Page 106: Setting Up The Rf Inputs
Acquire the Signal Quick Tips If you think you need more timing resolution, turn on MagniVu to increase the resolution. MagniVu is always acquired. If the oscilloscope is in a stopped state, you can turn on MagniVu and still get the resolution without taking another acquisition. - Page 107 Acquire the Signal Frequency & Span 2. Push Center Frequency on the side menu Center Frequency and use either the Multipurpose a knob or the oscilloscope keypad to enter the desired 2.24 GHz center frequency. If you use the keypad, you can also use the resulting side menu choices to enter units.
- Page 108 Acquire the Signal Amplitude 2. Push Ref Level and turn Multipurpose a to Ref Level set the approximate maximum power level, -25.0 dBm as shown by the baseline indicator at the top of the frequency graticule. 3. Push Vertical and turn Multipurpose a to Vertical 420 mdiv adjust the vertical position.
- Page 109 Acquire the Signal 1. Push BW to bring up the resolution bandwidth side menu. This allows you to set the smallest frequency difference that the instrument can discern in the frequency axis. Bandwidth 2. Push RBW Mode to select either Auto or Mode Manual.
- Page 110 Acquire the Signal Description Window Kaiser The frequency resolution when using the Kaiser window is fair; the spectral leakage and amplitude accuracy are both good. The Kaiser window is best used when frequencies are very close to the same value but have widely differing amplitudes (the side lobe level and shape factor are closest to the traditional Gaussian RBW).
-
Page 111: Trigger Setup
Trigger Setup Trigger Setup This section contains concepts and procedures for setting up the oscilloscope to trigger on your signal. Triggering Concepts Trigger Event The trigger event establishes the time-reference point in the waveform record. All waveform record data is located in time with respect to that point. -
Page 112: Trigger Holdoff
Trigger Setup Trigger Holdoff Adjust holdoff to obtain stable triggering when the instrument is triggering on undesired trigger events. Trigger holdoff can help stabilize triggering, since the oscilloscope does not recognize new triggers during the holdoff time. When the instrument recognizes a trigger event, it disables the trigger system until acquisition is complete. -
Page 113: Slope And Level
Trigger Setup 1. Adjust the position (delay) time by rotating the Horizontal Position knob. 2. Turn horizontal SCALE to acquire the detail that you need around the position (delay) expansion point. The part of the record that occurs before the trigger is the pretrigger portion. The part that occurs after the trigger is the posttrigger portion. -
Page 114: Choosing A Trigger Type
Trigger Setup Choosing a Trigger Type To select a trigger: 1. Push Trigger Menu. 2. Push Type to bring up the Trigger Type Trigger Type side menu. Sequence NOTE. The bus trigger in the MDO3000 (B Trigger) Series works on parallel buses even without Pulse an application module. -
Page 115: Selecting Triggers
Trigger Setup Selecting Triggers Trigger Type Trigger Conditions Edge Trigger on a rising edge, a falling edge, or both edges, as defined by the slope control. Coupling choices are DC, LF Reject, HF Reject, and Noise Reject. Edge triggers are the simplest and most commonly used trigger type, with both analog and digital signals. - Page 116 Trigger Setup Trigger Type Trigger Conditions Logic Trigger when all channels transition to the specified state. Turn Multipurpose a to select a channel. Push the appropriate button on the side menu to set that channel's state to High (H), Low (L), or Don't Care (X). Push Clock on the side menu to enable clocked (state) triggering.
-
Page 117: Triggering On Buses
Trigger Setup Trigger Type Trigger Conditions Video Trigger on specified fields or lines of a composite video signal. Only composite signal formats are supported. Trigger on NTSC, PAL, or SECAM. Works with Macrovision signals. Trigger on a variety of HDTV video standard signals, as well as custom (non-standard) bilevel and trilevel video signals with 3 to 4,000 lines. - Page 118 Trigger Setup 3. Push Type. Type Source Trigger On Address Direction Mode Write Auto Address B1 (I2C) & Holdoff 4. Turn Multipurpose a to scroll through the trigger type side menu until you select Bus. 5. Push Source Bus and use the Source Bus side menu to select the bus that you want to trigger on.
- Page 119 Trigger Setup Push Number of Bytes and enter the number of bytes with Multipurpose a. Push Addressing Mode on the side menu and select 7-bit or 10–bit. Push Data on the side menu. Enter the data parameters of interest with the Multipurpose a and Multipurpose b knobs. For more information on the I C address formats, refer to item 2 under Setting Up Bus Parameters.
- Page 120 Trigger Setup If you have made a Trigger On selection of Error, push Error Type on the lower menu and enter the parameters of interest on the side menu. FlexRay Bus Trigger You can trigger on Start of Frame, Type of Frame, Identifier, Cycle Count, Header Fields, Data, Id & Data, End of Frame or Error.
- Page 121 Trigger Setup With USB, CAN, CAN FD, or FlexRay, obtain a rolling window match by setting the Byte Offset in the Data menu to Don't care. Specific byte matching (non-rolling window matching for a specific position in the packet) for I C, SPI, USB, CAN, CAN FD, LIN, and FlexRay.
-
Page 122: Checking Trigger Settings
Trigger Setup Checking Trigger Settings To quickly determine the settings of some key trigger parameters, check the Trigger readout at the bottom of the display. The readouts differ for edge and the advanced triggers. 1. Trigger source = channel 1. Edge trigger readout 2. - Page 123 Trigger Setup Select the method for sequencing the B Time (a) 8 ns trigger after the A by pushing a side menu button. B Events Set to Minimum 5. Set the other Sequence Trigger parameters in the related side and lower menus. B Trigger After Delay Time The A trigger arms the instrument.
-
Page 124: Starting And Stopping An Acquisition
Trigger Setup Starting and Stopping an Acquisition After you have defined the acquisition and trigger parameters, start the acquisition with Run/Stop or Single. Push Run/Stop to start acquisitions. The oscilloscope acquires repeatedly until you push the button again to stop the acquisition. -
Page 125: Display Waveform Or Trace Data
Display Waveform or Trace Data Display Waveform or Trace Data This section contains concepts and procedures for displaying the acquired waveform or trace. Adding and Removing a Waveform 1. To add or remove a waveform from the display, push the corresponding front panel channel button or the D15-D0 button. - Page 126 Display Waveform or Trace Data 3. Push Dots Only On Off on the side menu. Waveform Display Dots on will display the waveform record points as dots on the screen. Dots off connects the dots with vectors. Dots Only 4. Push Persistence to Off to display the Persis- tence display persistence.
-
Page 127: Setting The Graticule Style
Display Waveform or Trace Data Setting the Graticule Style 1. To set the graticule style, push Utility. 2. Push Utility Page. Utility Page 3. Turn Multipurpose a and select Display. Display 4. Push Graticule on the lower menu. Utility Backlight Graticule Screen Trigger... - Page 128 Display Waveform or Trace Data 5. Select the desired style on the side menu. The Frame graticule provides a clean screen on which you can most easily read automatic measurement results and other screen text. The Full graticule can help you make cursor measurements on hard copies.
-
Page 129: Setting Waveform Intensity
Display Waveform or Trace Data 5. Select the intensity level on the side menu. Backlight Choices are: High, Medium, and Low. Backlight Intensity High 6. Enabling Auto-Dim will turn down the Auto-Dim screen lighting after a set time. Using it may help prolong the LCD life. -
Page 130: Scaling And Positioning A Waveform
Display Waveform or Trace Data Scaling and Positioning a Waveform Use the horizontal controls to adjust the time base, adjust the trigger point, and to examine waveform details more closely. You can also use the Wave Inspector Pan and Zoom controls to adjust the display of waveforms. (See page 149, Using Wave Inspector to Manage Long Record Length Waveforms.) If you push the Horizontal Position knob and Delay is set to On, the horizontal position is set to 0 seconds. -
Page 131: Setting Input Parameters
Display Waveform or Trace Data Quick Tips Preview. If you change the Position or Scale controls when the acquisition is stopped or when it is waiting for the next trigger, the oscilloscope rescales and repositions the relevant waveforms in response to the new control settings. It simulates what you will see when you next push the RUN button. - Page 132 Display Waveform or Trace Data 5. Push Bandwidth, and select the desired bandwidth on the side menu. The set choices are: Full, 250 MHz, and 20 MHz. Additional choices may appear, depending on the probe that you use. Select Full to set the bandwidth to the full oscilloscope bandwidth.
- Page 133 This is especially important when using a current probe in conjunction with a voltage probe. For best results, use a deskew fixture, such as the Tektronix 067-1686-xx. MDO3000 Series Oscilloscopes User Manual...
- Page 134 Display Waveform or Trace Data If you do not have a deskew fixture, you can use the controls in the Deskew menu to set the oscilloscope's deskew parameters to recommended values, based on the nominal propagation delay of each probe. The oscilloscope automatically loads the nominal propagation delay values of TekVPI and TekProbe II (requires use of a TPA-BNC...
-
Page 135: Positioning And Labeling Bus Signals
Display Waveform or Trace Data Positioning and Labeling Bus Signals Positioning bus signals. Push the appropriate front panel bus button and turn the Multipurpose a knob to adjust the vertical position of the selected bus. (See page 67, Setting Up a Serial or Parallel Bus.) 1. - Page 136 Display Waveform or Trace Data 2. Push D15–D0 on the lower menu. D15 – D0 Thresholds Edit Labels Monitor MagniVu Height On/Off |Off |Off | M L 3. Push Select on the side menu. Select (a) D0 (b) 1.04 div Display On| Off Turn on...
-
Page 137: Viewing Digital Channels
Display Waveform or Trace Data 8. To group some or all of the digital channels together, move the channels right next to each other. All the channels that are next to each other automatically form a group. You can see the groups by pushing Select on the side menu and turning the Multipurpose a knob. -
Page 138: Viewing The Trigger Frequency
Display Waveform or Trace Data 2. Push Utility Page. Utility Page 3. Turn the Multipurpose a knob and select Display Display. 4. Push Screen Annotation on the resulting Utility Backlight Graticule Screen Trigger Page Annotation Frequency High Full lower menu. Readout Display 5. -
Page 139: Displaying The Frequency Domain Menu
Display Waveform or Trace Data 2. Push Utility Page. Utility Page 3. Turn Multipurpose a and select Display. Display 4. Push Trigger Frequency Readout from the Utility Backlight Graticule Screen Trigger Page Annotation Frequency High Full resulting lower menu. Readout Display 5. - Page 140 Display Waveform or Trace Data Trace Types The frequency domain window supports four spectrum traces. You may turn each of these traces on and off independently. You can display all or some of them simultaneously. 1. Push Spectrum Traces from the RF Menu to bring up the related side menu.
- Page 141 Display Waveform or Trace Data The figure to the right shows the frequency domain window’s trace indicator. 1. An RF trace indicator is placed at the Reference Level. 2. A capital M appears if the maximum trace is turned on. 3.
- Page 142 Display Waveform or Trace Data 5. Average: Averages all points in each interval. 6. –Peak: Uses the lowest amplitude point in each interval. Spectrogram Display The spectrogram display is particularly useful for monitoring slowly-changing RF phenomena. The x-axis represents frequency, just like the typical spectrum display. The y-axis represents time. Color indicates amplitude. Spectrogram slices are generated by taking each spectrum and flipping it on its edge so that it is one pixel row tall, and then assigning colors to each pixel based on the amplitude at that frequency with the cold colors of blue and green representing low amplitude, and the hotter colors of yellow and red indicating higher amplitude.
-
Page 143: Analyze Waveform Or Trace Data
Analyze Waveform or Trace Data Analyze Waveform or Trace Data After having properly set up the acquisition, triggering, and display of your desired waveform or trace, you can analyze the results. Select from features such as cursors, automatic measurements, statistics, waveform histograms, math, and FFT. Using Markers in the Frequency Domain 1. - Page 144 Analyze Waveform or Trace Data Automatic Peak Markers Automatic peak markers are on by default and assist with quickly identifying the frequency and amplitude of peaks in the spectrum. 1. The Reference Marker is placed on the highest amplitude peak. It is marked with a red R in a triangle.
- Page 145 Analyze Waveform or Trace Data Each automatic marker has a readout associated with it. These can be absolute or delta readouts. An absolute marker readout shows the actual frequency and amplitude of the associated marker. A delta marker readout shows the frequency and amplitude differences from the Reference Marker.
-
Page 146: Taking Automatic Measurements In The Time Domain
Analyze Waveform or Trace Data Taking Automatic Measurements in the Time Domain To take an automatic measurement in the time domain: 1. If the instrument is in the frequency domain, push channel 1. 2. Push Measure. 3. Push Add Measurement. Add Mea- Remove Indicators... -
Page 147: Selecting Automatic Measurements In The Time Domain
Analyze Waveform or Trace Data Selecting Automatic Measurements in the Time Domain The following tables list each automatic measurement by category: time or amplitude. (See page 124, Taking Automatic Measurements in the Time Domain.) Time measurements Measurement Description Frequency The first cycle in a waveform or gated region. Frequency is the reciprocal of the period; it is measured in hertz (Hz) where one Hz is one cycle per second. - Page 148 Analyze Waveform or Trace Data Amplitude measurements Measurement Description Peak-to-peak The absolute difference between the maximum and minimum amplitude in the entire waveform or gated region. Amplitude The high value less the low value measured over the entire waveform or gated region. The most positive peak voltage.
- Page 149 Analyze Waveform or Trace Data Amplitude measurements (cont.) Measurement Description Mean The arithmetic mean over the entire waveform or gated region. Cycle Mean The arithmetic mean over the first cycle in the waveform or the first cycle in the gated region.
-
Page 150: Customizing An Automatic Measurement In The Time Domain
Analyze Waveform or Trace Data Histogram measurements Measurement Description Waveform Displays the number of waveforms that contributed to the histogram. Count Hits in Box Displays the number of samples within the histogram box or on its boundaries. Peak Hits Displays the number of samples in the bin that contains the most hits. Median Displays the middle histogram data value, where half of all histogram data points are less than this value and half are greater than this value. - Page 151 Analyze Waveform or Trace Data 2. Push More as many times as needed to Add Mea- Remove Indicators Waveform surement Measure- select Gating from the resulting pop-up His- More ment tograms menu. 3. Position the gates using the side menu Gating options.
- Page 152 Analyze Waveform or Trace Data 3. Push the side menu options. These include Measure- ment Sta- whether to turn statistics on or off and how tistics many samples to use for mean and standard On| Off deviation calculations. Mean & Std Dev Samples Reset...
- Page 153 Analyze Waveform or Trace Data 5. Push OK Snapshot All Measurements. Snapshot All Mea- surements 6. View results. Snapshot on 1 Period : 312.2μs Freq : 3.203 kHz +Width : 103.7μs –Width : 208.5μs Burst W : 936.5μs Fall 1.144μs Rise : 1.452μs ±Over...
-
Page 154: Taking Automatic Measurements In The Frequency Domain
Analyze Waveform or Trace Data 3. Set the levels using the side menu. Reference Levels Set Levels |Units Use High and Low reference to calculate High Ref (a) 90.0 % rise and fall times. Use Mid reference primarily for Mid Ref 50.0 % measurements between edges such 50.0 %... -
Page 155: Taking Digital Voltmeter Measurements
Analyze Waveform or Trace Data 4. Choose the measurement of interest from Select Measure- the side menu. ment None Channel power: The total power within the Channel Power bandwidth, defined by the Channel Width. Adjacent channel power ratio: The power in the Adjacent Channel main channel and the ratio of channel power to... -
Page 156: Taking Manual Measurements With Cursors
Analyze Waveform or Trace Data 4. From the side menu, select the desired Digital Voltmeter Mode, Source and Display Style. Mode Source Autorange Unavail- able when Triggering on DVM Source Display Style Full Minimized Reset Statistics View the finished results. Taking Manual Measurements with Cursors Cursors are on-screen markers that you position in the waveform display to take manual measurements on acquired data. - Page 157 Analyze Waveform or Trace Data In this example, two vertical cursors appear on the selected waveform. As you turn Multipurpose a, you move one cursor to the right or left. As you turn knob Multipurpose b, you move the other cursor. 2.
- Page 158 Analyze Waveform or Trace Data 7. Push Select. This makes the vertical cursors active and the horizontal cursors inactive. Now, as you turn the multipurpose knobs, the vertical cursors will move. Push Select to make the horizontal cursors active again. 8.
- Page 159 Analyze Waveform or Trace Data 15. Push Cursors again. This turns off the cursors. The screen no longer displays the cursors and the cursor readout. Using Cursor Readouts Cursor readouts supply textual and numeric information relating to the current cursor positions. The oscilloscope always shows the readouts when the cursors are turned on.
-
Page 160: Setting Up A Histogram
Analyze Waveform or Trace Data The vertical cursor lines on the display measure horizontal parameters, typically time. The square and circle shapes in the readout map to the multipurpose knobs when both vertical and horizontal cursors are present. Using XY Cursors When the XY Display mode is on, the cursor readouts will appear to the right of the lower graticule (XY). - Page 161 Analyze Waveform or Trace Data 4. Push the top button on the side menu to select the waveform axis for which you want Vertical Horizontal to show the histogram values: Vertical or Horizontal. 5. Push Source on the side menu and turn Source (a) 1 Multipurpose a to select the channel for...
- Page 162 Analyze Waveform or Trace Data 2. Push Source on the side menu and turn Source Multipurpose a to select H for histogram (a) H measurements. 3. Push Measurement Type on the side Measure- ment menu and turn Multipurpose b to select a Type histogram measurement.
-
Page 163: Using Math Waveforms
Analyze Waveform or Trace Data 5. Push Reset Statistics on the side menu. Reset Statistics You can view the histogram at the top (for horizontal histograms) or the left edge (for vertical histograms) of the graticule. Quick Tips Use horizontal histograms to measure signal jitter. Use vertical histograms to measure signal noise. -
Page 164: Using Fft
Analyze Waveform or Trace Data 2. Push Dual Wfm Math. Dual Wfm Advanced Spectrum (M) Label Math Math Math 3. On the side menu, set the sources to either channel 1, 2, 3, 4, or reference waveforms R1, 2, 3, or 4. Choose the +, –, x, or ÷ operators. - Page 165 Analyze Waveform or Trace Data 2. Push FFT. Dual Wfm Advanced Spectrum (M) Label Math Math Math 3. Push FFT Source on the side menu, if Source needed, and turn Multipurpose a to select the source to use. Choices are: channels 1, 2, (3, and 4 on four-channel models), reference waveforms R1, R2, (R3, and R4 on four-channel models).
- Page 166 Analyze Waveform or Trace Data 7. The FFT will appear on the display. Quick Tips Use short record lengths for faster instrument response. Use long record lengths to lower the noise relative to the signal and increase the frequency resolution. If desired, use the zoom feature along with the horizontal Position and Scale controls to magnify and position the FFT waveform.
-
Page 167: Using Advanced Math
Analyze Waveform or Trace Data Description Window Hanning The frequency resolution when using the Hanning (a.k.a. Hann) window is good, the spectral leakage is low and amplitude accuracy is fair. Use the Hanning window for measuring sine, periodic, and narrow band random noise. This window works well on transients or bursts where the signal levels before and after the event are significantly different. -
Page 168: Using Spectrum Math
Analyze Waveform or Trace Data 4. Push Edit Expression and use the multipurpose knobs and the resulting lower menu buttons to create an expression. When done, push OK Accept. For example, to use Edit Expression to take the integral of a square wave: 1. -
Page 169: Using Reference Waveforms And Traces
Analyze Waveform or Trace Data Spec-trurn Math 3. Push 1st Source on the side menu and use 1st Source (a) RF:N the multipurpose knobs to adjust the vertical settings of the reference waveform or trace. 4. Choose + or – as the operator. Operator —... - Page 170 Analyze Waveform or Trace Data 3. Push Vertical on the side menu and use Vertical 0.00 div the multipurpose knobs to adjust the vertical 100 mV/div settings of the reference waveform or trace. 4. Push Horizontal on the side menu and Horizontal 0.00 s use the multipurpose knobs to adjust...
-
Page 171: Using Wave Inspector To Manage Long Record Length Waveforms
Analyze Waveform or Trace Data Using Wave Inspector to Manage Long Record Length Waveforms The Wave Inspector controls (zoom/pan, play/pause, marks, search) help you to efficiently work with long record length waveforms. To magnify a waveform horizontally, turn the Zoom knob. To scroll through a zoomed waveform, turn the Pan knob. - Page 172 Analyze Waveform or Trace Data 3. Examine the zoomed view of the waveform that appears on the larger, lower portion of the display. The upper portion of the display will show the position and size of the zoomed portion in the waveform, within the context of the overall record.
- Page 173 Analyze Waveform or Trace Data 3. Change the play direction by reversing the direction that you are turning the pan knob. 4. During play, up to a point, the more you turn the ring, the faster the waveform accelerates. If you rotate the ring as far as it can go, the play speed does not change, but the zoom box quickly moves in that direction.
- Page 174 Analyze Waveform or Trace Data 3. Investigate your waveform by moving from search mark to search mark. Use the next ( →) or previous (←) arrow button to jump from one marked location to another, without adjusting any other controls. 4.
- Page 175 Analyze Waveform or Trace Data 4. On the screen, hollow triangles show the location of automatic marks and solid triangles show the custom (user-defined) locations. These appear on both normal and zoomed waveform views. 5. You can quickly investigate your waveform by moving from search mark to search mark with the next ( →) and previous (←) arrow buttons.
-
Page 176: Auto-Magnify
Analyze Waveform or Trace Data Search Description Rise/Fall Time Search for rising and/or falling edges that are >, <, =, or ≠ a user specified time. Parallel: Search for a binary or hex value. C: Search for Start, Repeated Start, Stop, Missing Ack, Address, Data, or Address and Data. -
Page 177: Limit And Mask Testing
Analyze Waveform or Trace Data 1. The entire acquisition is indicated by the horizontal bar in the upper display. 2. The portion of the acquisition shown in the time domain graticule is shown within the part of the upper display defined by the brackets. - Page 178 Analyze Waveform or Trace Data 4. Push the front panel Test button. 5. Push Application on the lower menu. Turn Multipurpose a to select Limit/Mask Test from the menu. 6. Push Select Mask on the lower menu and, from the resulting side menu, select Limit Test.
- Page 179 Analyze Waveform or Trace Data :REM "Initialize the custom mask" :MASK:CUSTom INIT :REM "Mask Setup Information" :MASK:USER:LABEL "Custom Mask of STS-1" :MASK:USER:AMPLITUDE 1.0000 :MASK:USER:VSCALE 200.0000E-3 :MASK:USER:VPOS -2.5000 :MASK:USER:VOFFSET 0.0E+0 :MASK:USER:HSCALE 4.0000E-9 :MASK:USER:HTRIGPOS 318.1000E-3 :MASK:USER:WIDTH 29.5500E-9 :MASK:USER:RECORDLENGTH 1000 :MASK:USER:TRIGTOSAMP 7.2750E-9 :REM "Mask Points are Defined in Volts and Seconds" :REM "Points in a segment must be defined in counter clockwise order"...
- Page 180 Analyze Waveform or Trace Data Setting Description Select Action on Failure Set how the oscilloscope responds to test failure. You can set multiple actions. These are: Stop acquisition Save waveform to file Save screen image to file Print screen image Aux out pulse Set a remote interface service request (SRQ) Select Action on Test Completion...
-
Page 181: Making Video Tests
Analyze Waveform or Trace Data 2. Push Show Results on the lower menu and use the resulting side menu to select whether to show basic or more detailed results. You can also reset the results. Quick Tips Use Average acquisition mode to create a smoother, cleaner limit test mask. If you want to re-use the mask later, save it to a file by selecting Set Up Mask from the lower menu and Save Mask to File from the resulting side menu. -
Page 182: Making Automated Power Measurements
Analyze Waveform or Trace Data Choose among: - Display on/off - Standard: NTSC or PAL - Contrast/update rate - Odd/Even/Interlaced - Source channel - Location on the screen to display the results See a test pattern from a video generator See an actual video picture See a video of a video of a video ... - Page 183 Analyze Waveform or Trace Data 3. Push Analysis. Applica- Analysis tion None 4. Use the side menu buttons to select the desired analysis function. Choose among: - Power quality - Switching loss - Harmonics - Ripple - Modulation - Safe operating area - Deskew See the MDO3PWR, DPO3PWR and DPO4PWR Power Analysis Modules User...
-
Page 184: Save And Recall Information
Save and Recall Information Save and Recall Information The oscilloscope provides permanent storage for setups, waveforms, and screen images. Use the internal storage of the oscilloscope to save setup files and reference waveform data. Use external storage, such as USB drives or network drives, to save setups, waveforms, and screen images. Use the external storage to carry data to remote computers for further analysis and for archiving. - Page 185 Save and Recall Information MIN for a minimum hold trace TIQ for a baseband I & Q file Analog, digital, and RF waveforms and traces and those waveforms and traces derived from them (such as math NOTE. and references) can be saved to an ISF file. When saving all channels in ISF format, a group of files will be saved. Each will have the same value for XXXX, but the YYY values will be set to the different channels that were turned on when the Save All Waveforms operation was performed.
-
Page 186: Saving A Screen Image
Save and Recall Information 6. Push Edit File Name. Edit the file name the same way you edit labels for channels. (See page 55, Labeling Channels and Buses.) 7. Push the Menu Off button to cancel the save operation, or push OK Save on the side menu to complete the operation. -
Page 187: Saving And Recalling Waveform And Trace Data
.csv files, not reference memories. The oscilloscope cannot recall digital waveforms. NOTE. The oscilloscope can save, but not recall, RF acquisitions as .TIQ files. You can use .TIQ files with Tektronix SignalVu Vector Signal Analysis software. MDO3000 Series Oscilloscopes User Manual... - Page 188 When saving RF trace data, you can select to save it as either the standard display data or as baseband I and Q data (.TIQ files). Use the I and Q data with Tektronix SignalVu Vector Signal Analysis software. 4. Turn the Multipurpose b knob and select the location to save the waveform or trace data to or to recall it from.
- Page 189 Save and Recall Information 5. Push File Details to save to a USB or File Details network drive. This brings up the file manager screen. Use it to navigate to the desired drive and folder, and optionally to specify the file name. Skip this step to use the default name and location.
-
Page 190: Saving And Recalling Setups
Save and Recall Information 2. Push R1, R2, RI or R4. (R1) |(On) (R2) |(Off) (R3) |(Off) (R4) |(Off) If you push the side menu Ref Details, you can read whether the reference holds analog waveform or RF trace information. Removing a reference waveform from the display. - Page 191 Save and Recall Information 3. From the resulting side menu, select the Save Setup location to save the setup to or to recall it from. To File To save setup information to one of the ten internal setup memories in the oscilloscope, Edit Labels push the appropriate side menu button.
-
Page 192: Saving With One Button Push
Save and Recall Information 5. Save the file. Save to Selected File Quick Tips Recalling the Default Setup. Push Default Setup on the front panel to initialize the oscilloscope to a known setup. (See page 57, Using the Default Setup.) Saving with One Button Push After you have defined the save/recall parameters with the Save/Recall Menu button and menu, you can save files with a single push of the Save button. -
Page 193: Managing Drives, Directories, And Files
Save and Recall Information Managing Drives, Directories, and Files You can manage drives, directories, and files from the oscilloscope user interface. 1. Push Save/Recall Menu. 2. Push File Utilities. Save Save Save Recall Recall Assign File Screen Waveform Setup Waveform Setup Utilities Save... -
Page 194: Printing A Hard Copy
Connect a non-PictBridge printer to a USB port on the rear or front panel of the oscilloscope. Alternatively, connect a PictBridge printer to the USB device port on the rear panel, or hook up a networked printer through the Ethernet port. NOTE. Refer to the www.tektronix.com/printer_setup Web page for a list of compatible printers. MDO3000 Series Oscilloscopes User Manual... - Page 195 Save and Recall Information Set Up Print Parameters To set up the oscilloscope to print hard copies: 1. Push Utility. 2. Push Utility Page. Utility Page 3. Turn Multipurpose a and select Print Print Setup Setup. 4. Push Select Printer if you are changing the Utility Select Orientation...
- Page 196 Save and Recall Information 6. Choose Ink Saver On or Off. The On selection will print out a copy with a clear (white) background. Ink Saver on Ink Saver off Printing to a PictBridge Printer To set up the oscilloscope to print to a PictBridge printer: 1.
- Page 197 Save and Recall Information Device Port Connect to Computer 5. Push Connect to PictBridge Printer. Connect to PictBridge Printer Disabled (Off bus) Printing Over Ethernet To set up the oscilloscope to print over Ethernet: 1. Connect an Ethernet cable to the rear-panel Ethernet port.
- Page 198 Save and Recall Information 5. Push Select Printer. Utility Select Orientation Ink Saver PictBridge Page Printer Printer Landscape Settings Print (N/A) Setup 6. Push Add Network Printer. Network Printer Add E-mail printer Rename Printer Delete Network Printer 7. Turn Multipurpose a to scroll through the list of letters, numbers, and other characters to find the first character in the printer name that you want to enter.
- Page 199 Save and Recall Information 10. Push the down arrow key to move the Printer character cursor down a row to the Server Name field. 11. Turn the Multipurpose a knob and push Select or Enter Character as often as needed to enter the name. 12.
- Page 200 Save and Recall Information 3. Push Utility Page. Utility Page 4. Turn Multipurpose a and select Print Print Setup Setup. 5. Push Select Printer. Utility Select Orientation Ink Saver PictBridge Page Printer Printer Landscape Settings Print (N/A) Setup 6. Push Add E-Mail Printer. Select Printer Network...
- Page 201 Save and Recall Information 7. Turn Multipurpose a to scroll through the list of letters, numbers, and other characters to find the first character in the name that you want to enter. If you are using a USB keyboard, use the arrow keys to position the insertion point and type in the printer name.
-
Page 202: Using Oscilloscope Security Features
Save and Recall Information 14. When done, push OK Accept. Printing with One Button Push Once you have connected a printer to your oscilloscope and set up print parameters, you can print current screen images with a single push of a button: Push the printer icon button in the lower left corner of the front panel. - Page 203 Save and Recall Information 4. Push TekSecure Erase Memory. Utility TekSecure Page Erase Security Memory 5. Push OK Erase Setup and Ref Memory Erase on the side menu. Setup This erases data in the oscilloscope’s & Ref Memory reference waveform and setup memory locations.
- Page 204 Save and Recall Information 6. Power off the oscilloscope, and then power it back on to complete the process. To use TekSecure, with the MDO3SEC application module installed: 1. Push Utility. 2. Push Utility Page. Utility Page 3. Turn the Multipurpose a knob and select Security Security.
- Page 205 Save and Recall Information 4. Push TekSecure Erase Memory. Utility TekSecure Security Firmware I/O Ports Page Upgrades Password Erase Enabled Security Enabled Memory 5. Push OK Erase Setup and Ref Memory on Erase the side menu. As before, this erases data Setup in the oscilloscope’s reference waveform &...
- Page 206 Save and Recall Information 9. Power off the oscilloscope, and then power it back on to complete the process. MDO3000 Series Oscilloscopes User Manual...
-
Page 207: Use The Arbitrary Function Generator
You can modify your arbitrary waveform via an on-screen editor and then replicate it out of the generator. For more involved waveform manipulation, you can use Tektronix’ ArbExpress PC-based waveform creation and editing software. It is available for free download from www.tektronix.com/software. Use version 3.1 or later with the MDO3000. - Page 208 Use the Arbitrary Function Generator How to change the waveform type 1. Push the AFG button to bring up the AFG lower menu. Waveform Wave– Frequency 100.00kHz Period 10.000μs Output form Settings Sine Amplitude 500.00m- High 250.00mV Settings Offset –250.00 0.0000 V 2.
- Page 209 For cases with many points to edit, consider using Tektronix ArbExpress software, which is available for free download from www.tektronix.com/software. Also, use the Waveform Edit menu to create new arbitrary waveforms in the instrument.
- Page 210 Use the Arbitrary Function Generator If needed, push AFG > Waveform Edit to bring Edit Create Load Freq. 100.00kHz Period Save Ampl. 10.000 μs Existing Waveform 500.00m- up the waveform edit lower menu. Waveform Offset High 250.00mV 0.000 V 5. Push Edit Existing to change, add, or delete Low –250.
- Page 211 Use the Arbitrary Function Generator 7. Push the lower-menu button labeled Load Waveform. Turn Multipurpose a to choose which of your waveforms to display. Also, you can use the side menu to load a saved waveform from a file. When you have chosen the desired waveform, push OK Load from the side menu.
- Page 212 Use the Arbitrary Function Generator Quick Tips You can save arbitrary waveforms in .CSV format. A .CSV file consists of sets of waveform point pairs (voltage, point number). You can load arbitrary waveforms from a variety of active time domain waveform sources: Channel 1 - 4, Ref 1 - 4, MATH, digital channels D0 - D15.
-
Page 213: Use The Application Modules
Some modules are described in the following list. Additional modules may be available. Contact your Tektronix representative or visit our Web site at www.tektronix.com for more information. Also, refer to Contacting Tektronix at the beginning of the manual. - Page 214 Use the Application Modules The MDO3PWR Power Analysis Module enables quick and accurate analysis of power quality, switching loss, harmonics, safe operating area (SOA), modulation, ripple, and slew rate (dI/dt, dV/dt). The MDO3USB USB 2.0 Serial Triggering and Analysis Module enables triggering on packet-level content for low-speed, and full-speed USB serial buses.
-
Page 215: Appendix A: Warranted Specifications
Appendix A: Warranted Specifications Appendix A: Warranted Specifications The Analog Bandwidth when the instrument is DC-50 coupled and the Bandwidth Selection if “Full”. √ Analog bandwidth, 50 Ω The limits stated below are for ambient temperature of ≤30 °C and the bandwidth selection set to FULL. Reduce the upper bandwidth frequency by 1% for each °C above 30 °C. - Page 216 Appendix A: Warranted Specifications ±[0.005 × | offset – position | + DC Balance] √ Offset accuracy NOTE. Both the position and constant offset term must be converted to volts by multiplying by the appropriate volts/div term. ±10 ppm over any ≥ 1 ms time interval √...
- Page 217 Appendix A: Warranted Specifications The formula to calculate delta-time measurement accuracy (DTA) for a given instrument setting and input √ Delta Time signal is given below (assumes insignificant signal content above Nyquist) Measurement Accuracy = Slew Rate (1 Edge) around the 1 point in the measurement = Slew Rate (2 Edge) around the 2...
- Page 218 Appendix A: Warranted Specifications Table 1: RF Channel Characteristics (cont.) Characteristic Description harmonic distortion: >100 MHz, < –55 dBc √ Spurious Response (SFDR) 2nd harmonic distortion: > 100 MHz, < –60 dBc (typical) With auto settings on and signals 10 dB below reference level harmonic distortion:9 kHz to 100 MHz, <...
- Page 219 Appendix A: Warranted Specifications Table 2: Arbitrary Function Generator Characteristic Description 130 ppm (frequency ≤10 kHz); 50 ppm (frequency > 10 kHz) √ Sine and Ramp Frequency Accuracy 130 ppm (frequency ≤ 10 kHz); 50 ppm (frequency > 10 kHz) √...
-
Page 220: Appendix B: Tpp0250, Tpp0500B And Tpp1000: 250 Mhz, 500 Mhz And 1 Ghz 10X Passive Probes Information
Operating Information The TPP0250, TPP0500B and TPP1000 10X Passive Probes are compact passive probes with 10X attenuation that are designed for use with Tektronix MDO3000 Series oscilloscopes. The probes have no user- or Tektronix-serviceable parts. Connecting the Probe to the Oscilloscope Connect the probe as shown in the illustrations below. - Page 221 To limit aberrations on high frequency signals caused by ground path inductance, bend the spring to reach nearby ground connections (<0.75 in, long; <0.25 in, short). Reorder Tektronix part numbers: 016-2028-xx (long, 2 ea.) 016-2034-xx (short, 2 ea.) MDO3000 Series Oscilloscopes User Manual...
-
Page 222: Optional Accessories
Color bands Use these bands to identify the oscilloscope channel at the probe head. Reorder Tektronix part number 016-0633-xx (5 pairs) Optional Accessories The accessories shown below are available for the probes and are rated ≤30 V unless indicated otherwise. -
Page 223: Replacing The Probe Tip
Appendix B: TPP0250, TPP0500B and TPP1000: 250 MHz, 500 MHz and 1 GHz 10X Passive Probes Information Replacing the Probe Tip Order Tektronix part number 206-0610-xx for rigid tip replacement, or order part number 206-0611–xx for pogo pin replacement. Specifications Table 5: Electrical and mechanical specifications... - Page 224 Appendix B: TPP0250, TPP0500B and TPP1000: 250 MHz, 500 MHz and 1 GHz 10X Passive Probes Information Refer to the reference lead derating curve above when making floating measurements. Table 6: Environmental specifications Characteristics Description Temperature Operating –15 °C to +65 °C (+5 °F to +149 °F) Nonoperating –62 °C to +85 °C (–80 °F to +185 °F) Humidity...
-
Page 225: Safety Summary
Equipment Recycling. This product complies with the European Union’s requirements according to Directive 2002/96/EC on waste electrical and electronic equipment (WEEE). For more information about recycling options, check the Support/Service section of the Tektronix Web site (www.tektronix.com). Safety Summary Review the following safety precautions to avoid injury and prevent damage to this product or any products connected to it. - Page 226 Appendix B: TPP0250, TPP0500B and TPP1000: 250 MHz, 500 MHz and 1 GHz 10X Passive Probes Information CAUTION. Caution statements identify conditions or practices that could result in damage to this product or other property. Symbols on the Product. These symbols may appear on the product: MDO3000 Series Oscilloscopes User Manual...
-
Page 227: Appendix C: P6316 General-Purpose Logic Probe Information
Appendix C: P6316 General-Purpose Logic Probe Information Product Description The P6316 general-purpose logic probe connects the Tektronix MDO3000 Series of mixed-signal oscilloscopes to digital buses and signals on your target system. The probe breaks out 16 data channels over two 2x8-pin headers (GROUP 1 and GROUP 2). -
Page 228: Connecting The Probe To Your Circuit
Appendix C: P6316 General-Purpose Logic Probe Information Connecting the Probe to Your Circuit Attach the probe to the circuit using the appropriate connectors and adapters. Select the best method for your needs, and then proceed to Setting up the Probe. To set and view the digital channel parameters, do the following: Push the D15–D0 button. -
Page 229: Typical Application
Appendix C: P6316 General-Purpose Logic Probe Information Typical Application 1. Use the P6316 probe to view digital signals on a system bus. 2. Use an analog probe, such as the TPP0250, TPP0500B or TPP1000 passive probe, to view analog waveform information. Probe lead sets: Probe Group 1... -
Page 230: Accessories
2 kits of 5 each 020-2897-XX — 1 each 071-2345-XX Instructions (English, Japanese, & Simplified Chinese languages) Instructions are included with the probe, but not in the accessory kit. The instructions can be downloaded at www.tektronix.com/manuals. MDO3000 Series Oscilloscopes User Manual... -
Page 231: Specifications
Equipment Recycling. This product complies with the European Union’s requirements according to Directive 2002/96/EC on waste electrical and electronic equipment (WEEE). For more information about recycling options, check the Support/Service section of the Tektronix Web site (www.tektronix.com). Safety Summary To avoid potential hazards, use this probe only as specified. -
Page 232: Safety Terms And Symbols In This Manual
Appendix C: P6316 General-Purpose Logic Probe Information Do not Operate Without Covers. Do not touch exposed connections and components when power is present. Avoid Exposed Circuitry. Do not touch exposed connections and components when power is present. Do Not Operate With Suspected Failures. If you suspect there is damage to this product, have it inspected by qualified service personnel. -
Page 233: Appendix D: Openssl License
Appendix D: OpenSSL License Appendix D: OpenSSL License License Issues The OpenSSL toolkit stays under a dual license, i.e. both the conditions of the OpenSSL License and the original SSLeay license apply to the toolkit. See below for the actual license texts. Actually both licenses are BSD-style Open Source licenses. - Page 234 Appendix D: OpenSSL License * NOT LIMITED TO, PROCUREMENT OF SUBSTITUTE GOODS OR SERVICES; * LOSS OF USE, DATA, OR PROFITS; OR BUSINESS INTERRUPTION) * HOWEVER CAUSED AND ON ANY THEORY OF LIABILITY, WHETHER IN CONTRACT, * STRICT LIABILITY, OR TORT (INCLUDING NEGLIGENCE OR OTHERWISE) * ARISING IN ANY WAY OUT OF THE USE OF THIS SOFTWARE, EVEN IF ADVISED * OF THE POSSIBILITY OF SUCH DAMAGE.
- Page 235 Appendix D: OpenSSL License * 4. If you include any Windows specific code (or a derivative thereof) from * the apps directory (application code) you must include an acknowledgement: * "This product includes software written by Tim Hudson (tjh@cryptsoft.com)" * THIS SOFTWARE IS PROVIDED BY ERIC YOUNG ``AS IS'' AND * ANY EXPRESS OR IMPLIED WARRANTIES, INCLUDING, BUT NOT LIMITED TO, THE * IMPLIED WARRANTIES OF MERCHANTABILITY AND FITNESS FOR A PARTICULAR PURPOSE * ARE DISCLAIMED.
- Page 236 Appendix D: OpenSSL License MDO3000 Series Oscilloscopes User Manual...
-
Page 237: Index
Index Index Symbols and Numbers ARINC429, xvi, 3, 40, 67, 68, 71, AFG, 39 95, 154, 191 Ampl, 41, 85 50 Ω protection, 112 bus trigger, 96 Arbitrary function generator, 36 Audio Autoset, 11, 38, 43, 54, 58 bus trigger, 98 B/W, 41 Auto Level, 86 B1, B2, 40, 67, 68, 95... - Page 238 Index byte matching, 99 Cursors, 134 e*Scope, 29 button, 41, 134 Edge trigger, defined, 93 linking, 135 Edges measurements, 134 Fuzzy, 115 Calibration, 21, 22 menu, 134 White, 115 Calibration certificate, 1 XY, 138 Envelope acquisition mode, 62 CAN, 40, 67, 95 Cycle Area measurement, 127 Erase setup and ref memory, 180 bus trigger, 97...
- Page 239 Index Frequency domain display, 48 HCTEK4321 transit hard case, 4 select automatic Frequency domain markers, 121 Height, MDO3000, 5 measurements, 125 automatic, 122 Hi Res acquisition mode, 62 setup a waveform manual, 123 High measurement, 126 histogram, 138 Frequency Domain menu, 22 High-low indicators, 47 setup analog channels, 54 Frequency measurement, 125...
- Page 240 Index Intensity Median measurement, 128 button, 42 Memory, erasure of, 180 M button, 40, 141, 142 Intensity button, 107 Menu, 36 MagniVu, 83 Invert, 109 Bus, 40, 68 MagniVu readout, 47 IRE graticule, 106 buttons, 38 Main trigger, 100 ISF format, 167 Cursors, 134 Mark, 151 Default Setup, 44...
- Page 241 Index Position Probes bus, 113 BNC, 8 Occupied bandwidth digital channels, 113 connecting, 7 measurement, 133 Horizontal, 90, 91, 108, 144 ground lead, 14 Offset and position, 112 logic, 8 Vertical, 108 Offset vertical, 110 Position and offset, 112 P6316, 205 OpenChoice Desktop, 1, 26, 29 Positive Duty Cycle TEK-USB-488 Adapter, 3...
- Page 242 Index Removing waveform, 103 Security icon, 46 Rename a drive, directory, or Security lock, 8 Table file, 171 Select button, 41 Search mark, 152 Resolution bandwidth, 86 Selecting a keyboard key layout Table, Event, 70 RF button, 22, 41, 48, 117 style, 35 TDM, 40, 67, 95 RF input connector, 36, 52...
- Page 243 Index event, defined, 89 Trigger types, defined, 93 Video trigger, defined, 95 FlexRay bus, 98 Triggering on Buses, 95 View forcing, 89 digital channels, 115 Frequency readout, 116 waveform record, 46 holdoff, 90 VISA, 26 UART, 40, 67 level, 91 Voltage, Source Undo level button, 43...
Need help?
Do you have a question about the MDO3104 and is the answer not in the manual?
Questions and answers