Table of Contents
Advertisement
Quick Links
8.713.1023 Enclosure for 8.713.1003 Instructions for Use
With series 13 and later, the 713 pH Meter is equipped with the new 5.713.0021 program.
The following pages list the most important modifications and extensions in comparison with
the old program version 5.713.0011 described in the 8.713.1003 Instructions for Use.
Modifications / Extensions
The format for the display and the entry of the date has been changed. The year can now be
entered with four digits.
Display:
∗∗∗∗∗
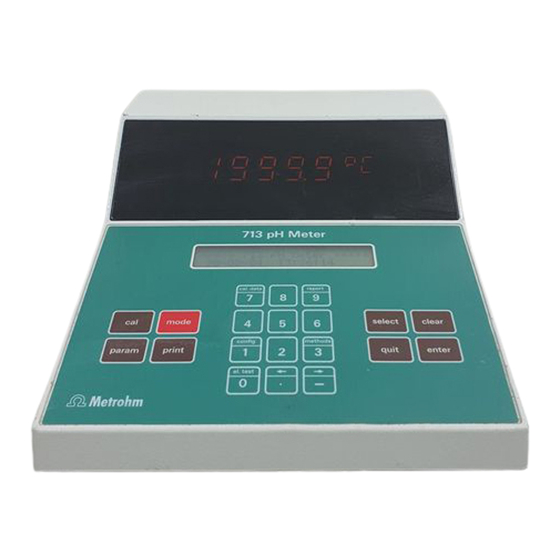
713 pH Meter
1998-05-04
>calibration parameters
param
cal.interval
pH Meter 713
∗∗∗∗∗
10:37:00
Entry of a calibration interval
OFF h
This inquiry appears only in the "pH" mode.
This new parameter allows the entry of a time
interval. When this time interval has expired the
warning "
LCD-display.
Input range:
The calibration interval is stored together with the
other calibration data for the electrode and the
electrode-id. The warning can be acknowledged by
pressing <quit>. When the electrode is re-
calibrated, the timer is set to zero. If no new calibra-
tion is performed, the instrument checks every
10 minutes whether the calibration interval has
expired, and again a warning appears in the display.
The verification of the calibration interval is always
carried out when the instrument is switched on or
when the mode is changed.
When further measurements are performed, although
the calibration interval has expired, together with
every measuring point report the warning
"
calibration interval expired
METROHM AG
METROHM AG
CH-9101 Herisau (Switzerland)
CH-9101 Herisau (Switzerland)
cal.interval expired
1...999 h, OFF
– 1 –
" appears in the
" is printed.
Advertisement
Table of Contents

Related Manuals for Metrohm 713


Summary of Contents for Metrohm 713
- Page 1 Meter 713 8.713.1023 Enclosure for 8.713.1003 Instructions for Use With series 13 and later, the 713 pH Meter is equipped with the new 5.713.0021 program. The following pages list the most important modifications and extensions in comparison with the old program version 5.713.0011 described in the 8.713.1003 Instructions for Use.
- Page 2 Enclosure for 713 Instructions for Use Lower limit for slope >calibration parameters param low lim.slope 0.97 This inquiry appears only in the "pH" mode. This new parameter allows the entry of a lower limit value for the slope. If a smaller slope is found in the calibration, the calibration can be discarded.
- Page 3 >plot parameters A plot function is now available for all those applica- tions of the 713 pH Meter that feature continuos measurement. The plot parameters depend on the mode selected. They are shown here for pH mode. You find additional plot parameter settings for the <config>...
- Page 4 Enclosure for 713 Instructions for Use Buffer selection The two Metrohm buffers pH = 1 and pH = 13 are no longer available (cf. Table on page 7 of the 8.713.1003 Instructions for Use). Error messages in the report The following two error messages can appear in the calibration report: Manual stop of the calibration.
- Page 5 Enclosure for 713 Instructions for Use Changed sequence of the parameter inquiry config The parameters are requested in the following sequence: config >printer print header: calibration report: character set: >print meas.value order unchanged >auxiliaries order unchanged >RS232 settings order unchanged Changes in the printer menu Under "...
- Page 6 Enclosure for 713 Instructions for Use New criterion for measured value printout: plot config >print meas.value print crit: immediate Measured value printout each time the immediate <print> key is pressed. Timed measured value printout in time selectable time intervals. Measured value printout, after the drift drift condition has been met.
-
Page 7: Technical Specifications
Enclosure for 713 Instructions for Use ∗∗∗∗∗ ∗∗∗∗∗ Switch 713 pH Meter Setup of plot parameters >graphics Grid lines for plot config graphics grid: No grid lines are drawn in when graphics are plotted. Dotted grid lines are drawn in when graphics are plotted.
Need help?
Do you have a question about the 713 and is the answer not in the manual?
Questions and answers