Tektronix MTM400A Quick Start User Manual
Mpeg transport stream monitor
Hide thumbs
Also See for MTM400A:
- Technical reference (192 pages) ,
- Manual (138 pages) ,
- Quick start user manual (102 pages)

Related Manuals for Tektronix MTM400A


Summary of Contents for Tektronix MTM400A
- Page 1 MTM400A MPEG Transport Stream Monitor Quick Start User Manual www.tektronix.com 071-2492-00...
-
Page 2: Contacting Tektronix
Copyright © Tektronix. All rights reserved. Licensed software products are owned by Tektronix or its subsidiaries or suppliers, and are protected by national copyright laws and international treaty provisions. Tektronix products are covered by U.S. and foreign patents, issued and pending. Information in this publication supercedes that in all previously published material. - Page 3 Warranty 2 Tektronix warrants that this product will be free from defects in materials and workmanship for a period of one (1) year from the date of shipment. If any such product proves defective during this warranty period, Tektronix, at its option, either will repair the defective product without charge for parts and labor, or will provide a replacement in exchange for the defective product.
- Page 4 Warranty 9(b) Tektronix warrants that the media on which this software product is furnished and the encoding of the programs on the media will be free from defects in materials and workmanship for a period of three (3) months from the date of shipment. If any such medium or encoding proves defective during the warranty period, Tektronix will provide a replacement in exchange for the defective medium.
- Page 5 Program may be used, or each concurrent user authorized under a floating-user license. Title to the Program and all copies thereof, but not the media on which the Program or copies may reside, shall be and remain with Tektronix or others for whom Tektronix has obtained a respective licensing right.
- Page 6 TERM. The license granted herein is effective upon acceptance by Customer, and shall remain in effect until terminated as provided herein. The license may be terminated by Customer at any time upon written notice to Tektronix. The license may be terminated by Tektronix or any third party from whom Tektronix may have obtained a respective licensing right if Customer fails to comply with any term or condition and such failure is not remedied within thirty (30) days after notice hereof from Tektronix or such third party.
-
Page 7: Table Of Contents
............Index MTM400A Quick Start User Manual... - Page 8 ..............Figure 19: Connecting to the MTM400A monitor .
-
Page 9: General Safety Summary
Do Not Operate in Wet/Damp Conditions. Do Note Operate in an Explosive Atmosphere. Keep Product Surfaces Clean and Dry. Provide Proper Ventilation. Refer to the manual’s installation instructions for details on installing the product so that it has proper ventilation. MTM400A Quick Start User Manual... - Page 10 WARNING indicates an injury hazard not immediately accessible as you read the marking. CAUTION indicates a hazard to property including the product. The following symbol(s) may appear on the product: CAUTION Protective Ground (Earth) Terminal Refer to Manual MTM400A Quick Start User Manual...
-
Page 11: Environmental Considerations
The symbol shown to the left indicates that this product complies with the European Union’s requirements according to Directive 2002/96/EC on waste electrical and electronic equipment (WEEE). For information about recycling options, check the Sup- port/Service section of the Tektronix Web site (www.tektro- nix.com). Perchlorate Materials. -
Page 12: Preface
This manual describes the MTM400A MPEG Transport Stream Monitor, which provides a complete solution for transmission monitoring of MPEG transport streams over RF, IP and ASI interfaces. The MTM400A monitor uses a single transport stream processor platform packaged in a 1 RU rackmount chassis to provide monitoring of a transport stream at data rates up to 155 Mbps. -
Page 13: Applications
IP to RF (requires two MTM400A Units) IP to ASI Documentation Table i lists the product documention for the MTM400A monitor and shows the location(s) where you can find the documents: printed manual, MTM400A documentation CD-ROM, or the Tektronix Web site. Table i: Product documentation... -
Page 14: Software Upgrades
3.0. Instructions are included in the MTM400A Release Notes document. The Sun Java RTE (run time environment) Version 1.6.0_03 must be installed on your PC for the MTM400A monitor RUI v3.0 to operate successfully. If Java is not present on the PC, an opportunity to download it is offered when the RUI is first opened. -
Page 15: Installation
Option Key. NOTE. Some of the installation instructions require you to use the MTM400A monitor RUI. If you are unfamiliar with the RUI, refer to the following sections in this manual before installing the instrument:... -
Page 16: Operating Considerations
Power Cords. The MTM400A monitor is shipped with one of the following power cord options. Power cords for use in North America are UL listed and CSA certified. Cords for use in areas other than North America are approved by at least one authority acceptable in the country to which the product is shipped. -
Page 17: Hardware Installation
40 ºC. The MTM400A monitor is designed to be mounted in a standard 19-inch equipment rack; a rack-mounting kit is shipped as a standard accessory with each instrument. The chassis components of the rack slides are shipped from the factory attached to the instrument as shown in Figure 1. -
Page 18: Figure 1: Chassis-Mounted Rack Slide Components
2. After you install the rack-mounting hardware, pull the slide-out tracks out to the fully extended position. 3. Insert the rack slides on the MTM400A monitor chassis into the extended slide-out tracks. WARNING. To prevent the instrument from falling and causing personal injury and damage to the instrument, support the instrument until it is secured in the equipment rack. -
Page 19: Figure 2: Rack Mounted Sections
Installation Figure 2: Rack mounted sections Figure 3: Installing or removing the rack slides MTM400A Quick Start User Manual... - Page 20 (10- - 32 x 0.500) supplied in the kit (see bottom of Figure 4). Secure the ground strap to the equipment-rack frame at an open unused hole in the frame as close to the MTM400A monitor as possible. Torque the screw to 10 in-lbs to so that the terminal provides good ground contact.
-
Page 21: Figure 4: Installing The Ground Strap
Installation Removing the handle retaining screw Attaching the ground strap to the instrument Attaching the ground strap to the equipment rack (MTM400 monitor shown) Figure 4: Installing the ground strap MTM400A Quick Start User Manual... - Page 22 4. Once the instrument is in place within the rack, tighten the knurled retaining screw to secure the instrument in the equipment rack. Removing the MTM400A Monitor from the Equipment Rack. Refer to Figure 3 on page 5 and perform the following steps to remove the instrument from the equipment rack.
-
Page 23: Figure 5: Sfp Module And Optical Port Plug
Installing an SFP Module. Perform the following steps to install an SFP module into the GigE interface card: CAUTION. To avoid damage to the SFP module, remove power from the MTM400A monitor before removing or inserting an SFP module. 1. Disconnect the power cord from the instrument. -
Page 24: Connecting To The Instrument
MTM400A monitor: 1. After you install the MTM400A monitor in an instrument rack, connect the power cord that was provided with the instrument to the power connector on the rear panel. Connect the power cord plug to a properly grounded electrical outlet. -
Page 25: Table 3: Standard External Connectors
(Digital input/output) 26-pin, D-type connector for five alarm relays, three TTL outputs, and a recording trigger input. The relays and the TTL outputs are triggered by test failures. The triggers are set using the RUI. ASI/SMPTE Input/Output are software selectable MTM400A Quick Start User Manual... -
Page 26: Figure 9: Optional Interface Card External Connectors
RF input Type F connector GigE SFP 1000 Small Pluggable Format module RJ-45 10/100/1000 RJ-45; 10/100/1000BASE-T IEEE 802.3 ASI/SMPTE310M input BNC connector ASI/SMPTE310M output Only one optional interface card can be installed at a time. MTM400A Quick Start User Manual... -
Page 27: Figure 10: Monitoring Asi And Rf Signals - Qam (Annex B2), 8Psk/Qpsk, 8Vsb, And Cofdm Interfaces
ASI In connector on the Transport Stream Processor card (see Figure 11). 3. Configure the instrument to use the installed interface card. Refer to Configuring an RF Card on page 39. Figure 11: Monitoring ASI and GigE signals - GigE interface MTM400A Quick Start User Manual... -
Page 28: Powering The Instrument On And Off
Powering the Instrument On and Off The MTM400A monitor does not have an external power switch. To power on the instrument, connect the power cord that was provided with the instrument to the power connector on the rear panel. Connect the power cord plug to a properly grounded electrical outlet. -
Page 29: Mac Address
New MTM400A monitors are shipped with the IP address set to 0.0.0.0; this is because the IP address that will be used by a customer is unknown. In this situation, the steps described below must be followed in order to associate the proper IP address with the MAC address (see Setting Up the Network on page 18). - Page 30 Resetting the IP Address using the User Interface. Perform the following steps after you power up the MTM400A monitor and connect to a network which recognizes the current IP address of the monitor. The procedure to start the RUI is described starting on page 32.
-
Page 31: Figure 13: Transport Stream Processor Reset Switches
Installation Resetting the IP Address by Clearing the Non-Volatile RAM. If the IP address of an MTM400A monitor is unknown, you can reset the existing IP address to the factory default value (0.0.0.0) by resetting the battery-backed, non-volatile RAM on the Transport Stream Processor card. -
Page 32: Setting Up The Network
Setting Up the Network Setting up an MTM400A monitor for use on a network requires MS DOS on a client PC, both the instrument and the PC to be powered up and attached to the same Ethernet network. They should also be attached to the same subnet, if present. -
Page 33: Rui Requirements
Network Latency It has been noted that where access to a remote MTM400A monitor uses a number of internet/intranet links of varying speeds, the initial RUI download may be initiated successfully, but then the process ceases. The network speed is outside of the control of Tektronix, but it may be possible to alter some of the local network settings to alleviate the problem. -
Page 34: Installing Japanese Font Extensions On Your Pc
The MTM400A monitor RUI is capable of displaying these private character extensions when the operating system on the PC is correctly configured. If the operating system on your PC has not been configured to display private character extensions, perform the following steps: 1. -
Page 35: Figure 15: Font Configuration Dialog Box
7. Open the Font Configuration page (see Figure 15) by selecting Configuration > Preferences > Font from the toolbar. 8. If necessary, set the Font Name for Log Entries and Stream Content to <<default>>. The MTM400A monitor RUI will now display private characters correctly by obtaining them from the font supplied in the eudc.tte file. -
Page 36: Video Thumbnail Support
RUI. If thumbnail support is not installed, a message is displayed when an attempt to view thumbnails is made. The thumbnail support software for the MTM400A monitor is based on modified open source material. The modified code is included in the executable file, and can be copied to the client PC and inspected if required. -
Page 37: Licensing
Licensing Options and upgrades to the MTM400A monitor are enabled using an Option Key. The Option Key is an encrypted code that unlocks and enables software and hardware functions that are installed on the instrument. Each Option Key is unique and can only be used with the specific MTM400A monitor to which is was assigned. - Page 38 8. In the Connect to MTM Device dialog box, select Administrator as the login type, enter the password, and then click Connect. 9. Read the Tektronix MTM400A End User License Agreement and click I Accept. 10. The MTM400A RUI will now appear. MTM400A Quick Start User Manual...
-
Page 39: Operation
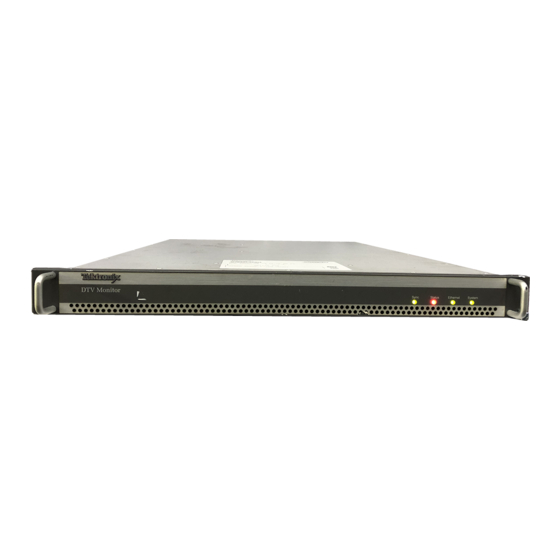
Getting Acquainted with your Instrument Front Panel Indicators Since the MTM400A monitor is designed to be operated remotely, the local interface is limited to four front-panel LEDs (see Figure 17), which indicate the instrument status. Table 6 describes the function of the four LEDs. -
Page 40: Figure 18: Rui Display Elements
MTM400A monitor each time the instrument is accessed. The procedure to start the RUI is described starting on page 32. Figure 18 shows the main elements of the RUI display. The display elements are described in more detail in the MTM400A MPEG Transport Stream Monitor Technical Reference. -
Page 41: Rui Displays
Each of the FlexVut views is selected from views that are available under the Analysis tab. Refer to Setting up the FlexVut Display on page 34 for information about selecting views for the FlexVut display. MTM400A Quick Start User Manual... - Page 42 ISDB-T and ISDB-S streams. Also displayed in the Tests view are the results of tests related to the MTM400A monitor hardware. One example is the temperature of the system card. MTM400A Quick Start User Manual...
- Page 43 PID. Select a specific PID to display a summary of all the associated tests. Select a specific test to display the Event Log and Parameters for only that test. MTM400A Quick Start User Manual...
- Page 44 S Graphical representation of specific RF card measurements S RF card readings and control settings The graphical views display a selection of graphs of instantaneous measurements and measurement trends. Also available are an Event Log and a Parameter view. MTM400A Quick Start User Manual...
-
Page 45: Webmsm Monitoring Software
MTM400A monitors. If you have a system consisting of several MTM400A monitors, you can expand your monitoring capabilities by using the Tektronix WebMSM Monitoring System Manager. The WebMSM software is effectively an installed version of the RUI. The WebMSM software provides additional functionality by allowing you to create hierarchical network views of your systems using the WebMSM Configuration Editor, and monitor and control multiple devices. -
Page 46: Procedures
Using the RUI, you can monitor real-time transport streams from your networked personal computer (PC). The RUI software is downloaded from the MTM400A monitor to the PC each time the instrument is accessed. The RUI can be run on any PC that meets the minimum specifications (see Table 5 on page 19) and has networked access to the MTM400A monitor. - Page 47 MTM400A Technical Reference manual. 5. Select Connect to accept the details. Select Cancel to close the dialog box and exit the start process. 6. Read the End User License Agreement and click I Accept. MTM400A Quick Start User Manual...
-
Page 48: Setting Up The Flexvut Display
X in the top right corner of each panel. This is not necessary, but it may help you visualize the following procedure more easily as each panel is populated. Note that each of the four FlexVut panels are numbered. MTM400A Quick Start User Manual... - Page 49 FlexVut panel. 2. In the Test Summary view, use the FlexVut panel select button to repli- cate the view in panel 1. 3. The FlexVut display now contains the Test Summary view in panel 1. MTM400A Quick Start User Manual...
- Page 50 4. Select Analysis tab and Programs tab. 5. In the Thumbnails view, use the FlexVut panel select button to repli- cate the view in panel 2. 6. The FlexVut display now contains the Thumbnail view in panel 2. MTM400A Quick Start User Manual...
- Page 51 7. Select Analysis tab and Tests tab. 8. In the Test Failures view, use the FlexVut panel select button to repli- cate the view in panel 3. 9. The FlexVut display now contains the Test Failures view in panel 3. MTM400A Quick Start User Manual...
- Page 52 In the Tests Summary view (FlexVut panel 1), which tests have failed. In the Test Failures view (FlexVut panel 3), which tests have failed most recently. In the Thumbnails view (FlexVut panel 2), which elementary streams are currently carrying video content. MTM400A Quick Start User Manual...
-
Page 53: Configuring An Rf Card
Interfaces dialog box. 4. Allow the display to stabilize; this can take up to 30 seconds. An indication that the display has stabilized is that the correct interface name is displayed in the Status bar. MTM400A Quick Start User Manual... - Page 54 7. In the Configuration Value field change the name from Configuration to Test Preset. 8. Change the rest of the settings. For this example, you can use the values listed in the the table on page 39. MTM400A Quick Start User Manual...
- Page 55 (or any of the other presets). The selected and active preset name, Test Preset, is bolded. 11. Click OK to close the Interface dialog box. Verify that monitoring is continuing satisfactorily. MTM400A Quick Start User Manual...
-
Page 56: Saving And Using Configuration Files
MTM400A MPEG Transport Stream Monitor Test Parameter and Configuration File Technical Reference for more information. In the MTM400A monitor, configuration settings files are held in storage slots; eight storage slots are available for each stream. Storage slots can be filled by either storing the current configuration or by uploading a configuration file from the client PC. To implement the setting held in a storage slot, the configuration file must be activated. - Page 57 The name displayed in the Current and Slot fields is contained in the file header and does not necessarily correspond with the file name. Downloaded configuration files can be modified using a text editor or an XML editing program. MTM400A Quick Start User Manual...
- Page 58 Slot 7. 9. Click Upload. 10. In the Open dialog box, locate the con- figuration file to be uploaded and click Open. The file has been uploaded to the highlighted slot, that is, Slot 7. MTM400A Quick Start User Manual...
- Page 59 Slot 7. 12. Click Activate. Note that the name in the highlighted slot, Slot 7, has been copied to the Current slot. The MTM400A monitor will be reconfigured in accord with the activated configuration file. MTM400A Quick Start User Manual...
-
Page 60: Capturing A Recording
Test failures - you can specify which test failure will trigger recording In this procedure, you will set up the MTM400A monitor to make a recording of the stream around the failure of a test, for example, the TR101 290, Priority 1, Continuity test. - Page 61 8. Click Arm to arm the recording func- tion. From this point, the pretrigger buffer is kept constantly full in readiness for true recording to start when a trigger action (test failure) occurs. MTM400A Quick Start User Manual...
- Page 62 Recording will occur when the trigger event occurs. You can close the Configuration dialog box. The toolbar recording icons will indicate the recording status. 9. When the trigger event occurs, the re- cording will be made. MTM400A Quick Start User Manual...
- Page 63 Configuration dialog box. 11. Select Stream > Recording Settings to open the Recording Settings panel. The Trigger State is now Recording Complete. 12. Click Download to save the recording to your PC (or the network). MTM400A Quick Start User Manual...
- Page 64 No further recordings can be made until this is done. 14. Click Clear to clear the recording buff- er. The Trigger State will return to Idle and the Progress bar will be cleared. MTM400A Quick Start User Manual...
-
Page 65: Application Examples
The selection and placement techniques are similar to those described in Setting up the FlexVut Display starting on page 34. This procedure assumes that a COFDM RF interface card is installed in the MTM400A monitor. The Analysis Interface tab will not be displayed if an interface card is not installed. - Page 66 4. In the Graphs view, use the FlexVut panel select button to replicate the view in panel 2. 5. Select the FlexVut tab to display FlexVut. Expand FlexVut panels 1 and 2 vertically to provide a full display. MTM400A Quick Start User Manual...
- Page 67 To summarize, in this view you can see the following: In the Interface Readings view (FlexVut panel 1), interface error values and error states. In the Interface Graphs view (FlexVut panel 3), the RF constellation and signal-to-noise trends. MTM400A Quick Start User Manual...
-
Page 68: Rf Off-Air Performance Monitoring
FlexVut to monitor this scenario. Procedure 1. Select the Analysis tab and the Interface tab. 2. In the Interface view, select the Read- ings view and use the FlexVut panel select button to replicate the view in panel 1. MTM400A Quick Start User Manual... - Page 69 RF constellation (all data carriers). 5. Repeat the action twice more, select- ing the Input Power Trend and Signal-to-Noise Ratio Trend graphs. 6. Use the FlexVut panel select button to replicate the graphs view in panel 2. MTM400A Quick Start User Manual...
- Page 70 7. In the Interface view, select the IF Error Collection view and use the FlexVut panel select button to repli- cate the view in panel 3. 8. Select the FlexVut tab to display the assembled views. MTM400A Quick Start User Manual...
- Page 71 9. You can expand panel 2 vertically by selecting the panel expand button. 10. To see a possible deterioration in the selected trend graphs, you can alter the sampling period (x-axis). For this scenario, select a sampling period of one day. MTM400A Quick Start User Manual...
- Page 72 24 hours; note the change in the X-axis values. 12. To examine the graphs more closely, click the tear-off icon. You can resize the tear-off window to make viewing the graphs easier. MTM400A Quick Start User Manual...
- Page 73 14. Open the Analysis > Tests view and examine the Event Log for the Priority 1 test 1.4 Continuity. For the period that input power was low, you might see a corresponding increase in the continuity count caused by out-of-order packets. MTM400A Quick Start User Manual...
-
Page 74: Product Options And Upgrades Options
Product Options and Upgrades Product Options and Upgrades Options Table 10 lists the software and hardware options that you can order with the MTM400A monitor. Included are the part numbers of any accessories shipped with the options. Table 10: Options and optional accessories... -
Page 75: Field Upgrade Kits
Optical gigabit Ethernet/fibre channel 1550 nm SFP SFF, 1.25/1.0625 Gbaud, 3.3 V, safety controlled; for GigE interface (Tektronix part number 131-7958-xx) Field Upgrade Kits Field upgrade kits are hardware and software upgrades that you can install after you purchase the MTM400A monitor. Table 11: Field upgrade kits Option... -
Page 76: Upgrading The Firmware Version
Device dialog box accessed from the Connect button in the MTM400A monitor RUI toolbar. 1. Download the latest version of the MTM400A monitor firmware from the Tektronix Web site and save the file to a PC that is connected to the same network as the MTM400A monitor. -
Page 77: Figure 20: Upload Device Firmware Dialog Box
4. In the Connect to MTM Device dialog box, select the Administrator Login Type from the drop-down list, and then enter the password. The default password is “tek” for Administrator. NOTE. You must log in to the MTM400A monitor using the Administrator login type. The User login type does not have sufficient permissions to upgrade the instrument firmware. -
Page 78: Figure 21: Firmware Upload Complete Message
9. On the PC, launch the Microsoft Internet Explorer Web browser. 10. In the Web browser address bar (see Figure 19 on page 62), enter the network name or IP address of the MTM400A monitor that you upgraded. After you press the Enter key, a Java applet is downloaded from the the MTM400A monitor and launched. -
Page 79: Figure 22: Flexvut Display
Product Options and Upgrades Figure 22: FlexVut display Figure 23: Device Information view MTM400A Quick Start User Manual... -
Page 80: Index
Options, software and hardware, 60 Tests view, 28 Field upgrade kits, 61 Firmware upgrade, 62 Packets view, 30 FlexVu display, overview, 27 PIDs view, 29 Front panel indicators, 25 Upgrade field kits, 61 firmware version, 62 MTM400A Quick Start User Manual...
Need help?
Do you have a question about the MTM400A and is the answer not in the manual?
Questions and answers