
Related Manuals for YOKOGAWA AQ1200A


Summary of Contents for YOKOGAWA AQ1200A
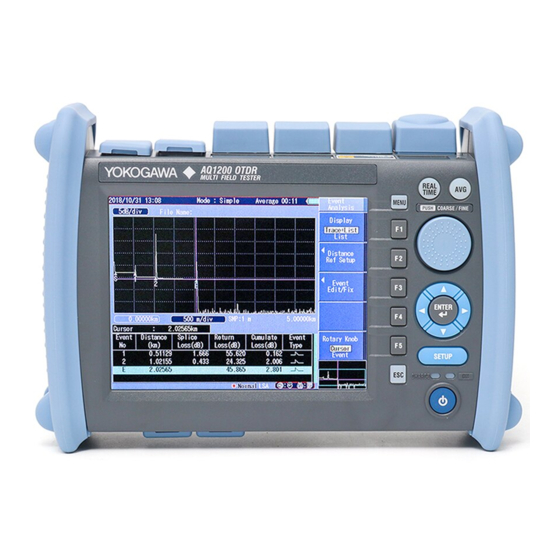
- Page 1 User’s Manual AQ1200A/AQ1200B/AQ1200C/ AQ1200E/AQ1205A/AQ1205E/ AQ1205F OTDR Multi Field Tester IM AQ1200-01EN 8th Edition...
- Page 2 IM AQ1200-92Z1 A document for China. AQ1205A/AQ1205E/AQ1205F OTDR User’s Manual The “-EN” in the manual number is the language code. Contact information of Yokogawa offices worldwide is provided on the following sheet. Document No. Description PIM 113-01Z2 List of worldwide contacts Notes • The contents of this manual are subject to change without prior notice as a result of continuing...
-
Page 3: Conventions Used In This Manual
Conventions Used in This Manual Notes The notes and cautions in this manual are categorized using the following symbols. Improper handling or use can lead to injury to the user or damage to the instrument. This symbol appears on the instrument to indicate that the user must refer to the user’s manual for special instructions. -
Page 4: Table Of Contents
Contents Conventions Used in This Manual ....................ii Chapter 1 Features Overview .......................... 1-1 Optical Pulse Measurement ..................... 1-3 Waveform Display ......................1-5 Waveform and Event Analysis ..................1-7 Light Source and Optical Power Meters (Options) ............1-12 Loss Test (Option) ......................1-14 Multi-Core Loss Test (Option) .................. - Page 5 Contents Initializing the Waveform Display Scale ................5-6 Setting the Waveform Information Display ............... 5-7 Chapter 6 Waveform Analysis How to Operate the Cursor and Markers ................. 6-1 Measuring Distances ......................6-8 Moving the Distance Measurement Reference Point ............6-9 Measuring the Splice Loss .....................
- Page 6 Contents Chapter 15 IP Testing (Option) 15.1 Performing an IP Test ..................... 15-1 Chapter 16 Multi-Core Fiber Measurement 16.1 Creating a New Project ....................16-1 16.2 Loading a Project ......................16-8 16.3 Measuring Multi-Core Fibers ..................16-9 Chapter 17 Event Mapper 17.1 Displaying Optical Fiber Events as Icons ............... 17-1 Chapter 18 File Operation and Printing 18.1 Connecting a USB Storage Medium to the USB Port ............
-
Page 7: Chapter 1 Features
Chapter 1 Features Overview This instrument is an OTDR (Optical Time Domain Reflectometer) with the features listed below. It is used in the optical fiber and line installation and maintenance servicing of access networks, which link telephone exchanges and service providers with subscribers, and user networks, which enable communication within a corporation or building. - Page 8 You can use a fiber inspection probe to photograph a fiber end face and display its state on the screen. * For information about compatible fiber inspection probes, contact your nearest YOKOGAWA dealer. IP Testing (/LAN option) Simple connection testing that uses PING...
-
Page 9: Measurement Mode
Optical Pulse Measurement The AQ1200x/AQ1205x applies an incident optical pulse to the connected optical fiber and measures the power level of the reflected light from the different sections of the optical fiber such as its splices, bent sections, and the open end of the fiber. The AQ1200x/AQ1205x uses the measured power level to determine the distance to the different points (splices, breaks, etc.) of the optical fiber and the loss and other phenomena that occur at those points. - Page 10 1.2 Optical Pulse Measurement Real-time Measurement In real-time measurement, you can change measurement conditions such as the wavelength, distance range, and pulse width while waveform changes are being measured in real time. * The measurement conditions that you can change vary depending on the measurement mode. For details about the measurement conditions, see the explanation of the measurement modes in chapter 3.
-
Page 11: Waveform Display
Waveform Display You can display the measured result as a waveform on the screen. You can zoom the displayed waveform and move the position that is displayed. How to View Optical Pulse Waveforms The optical pulse applied to the optical fiber is reflected at different points of the optical fiber such as its connections, bent sections, and the open end of the fiber. - Page 12 1.3 Waveform Display Splice Loss Because spliced sections of optical fibers have a great number of changes in the material’s density and inconsistencies in the fiber’s composition, loss due to Rayleigh scattering becomes large, and splice loss occurs in these sections. Reflection at the Connection Point of Connectors Using a connector to connect two optical fibers is different from splicing them together in that a small gap remains between the two fibers.
- Page 13 Waveform and Event Analysis Waveform Analysis You can use the cursor and markers to measure values such as the distance, splice loss, return loss, or reflection level between two points. Measuring Distance The AQ1200x/AQ1205x measures the time that it takes for an incident optical pulse to be reflected and return to the device.
- Page 14 1.4 Waveform and Event Analysis Dead Zone An area where the influence of a large event such as a connector’s connection point makes it impossible to recognize other events that exist in that area is a dead zone. There are the following two types of dead zones.
- Page 15 1.4 Waveform and Event Analysis 4 Point Markers The AQ1200x/AQ1205x uses the following four points to perform the measurement: the measurement start point , the splice loss start point , the splice loss end point Y2, and the measurement end point .
- Page 16 1.4 Waveform and Event Analysis Multi Trace Analysis You can load up to four traces that have been measured on the AQ1200x/AQ1205x and display them simultaneously for comparison. You can adjust the vertical display position of each loaded trace. 2 Way Trace Analysis Trace events that have been measured from optical fiber cable end A to end B and those measured from end B to end A can be combined.
- Page 17 1.4 Waveform and Event Analysis Event Analysis You can search for events in the optical pulse measurement waveform and measure the splice loss and the return loss. Event Editing You can insert and delete events on the event screen. When you edit an event marker, the splice loss and the return loss can be recalculated.
-
Page 18: Light Source And Optical Power Meters (Options)
/SLT, /HLT, or /PPM option. The features listed for the visible light source are available on models with the /VLS option. Loss-Measurement Light Source The following measurement light wavelengths can be generated. Model Measurement Light Wavelength AQ1200A SM 1310 nm, SM 1550 nm AQ1200B SM 1625 nm AQ1200C SM 1650 nm... - Page 19 1.5 Light Source and Optical Power Meters (Options) You can select the modulation frequency of the incident rays from a list of presets. You can also select CW (continuous). You can make the displayed measured value the reference and display subsequent measured values as relative values.
-
Page 20: Loss Test (Option)
Loss Test (Option) You can easily measure optical fiber and optical line degradation. This feature is available on models with the /SLT or /HLT option. Auto Loss Test (Using one AQ1200x/AQ1205x as the light source and another as the optical power meter) Using the AQ1200x/AQ1205x as a light source and optical power meter, you can easily measure optical fiber and line degradation. -
Page 21: Multi-Core Loss Test (Option)
Multi-Core Loss Test (Option) You can efficiently measure multi-core optical fiber and optical line degradation. This feature is available on models with the /SLT or /HLT option. Master and Slave Connect two AQ1200x/AQ1205xs and specify the optical power meter as the master and the light source as the slave. -
Page 22: Fault Locator
Fault Locator This feature enables you to search for breaks (faults) in an optical fiber or line. If there are no faults in the middle of a fiber, the fiber end face is detected as a fault. You can specify the wavelength and the loss level that is used to determine if a fault is a fiber end face or not when the AQ1200x/AQ1205x searches for faults. -
Page 23: Checking Fiber End Faces
Checking Fiber End Faces You can use a fiber inspection probe to take a photograph that shows the state of a fiber end face. You can display this photograph on the AQ1200x/AQ1205x screen and save it. * For information about compatible fiber inspection probes, contact your nearest d dealer. Index 1-17 IM AQ1200-01EN... -
Page 24: Ip Test (Option)
1.10 IP Test (Option) You can check whether or not the network layer of an Ethernet LAN line is established. Before performing an IP test, make sure that the optical fiber or line is connected physically. IP testing is available on models with the /LAN option. Ping Test To ping an address (perform a simple IP test), specify the address and configure the Tx frame settings listed below. -
Page 25: Multi-Core Fiber Measurement
1.11 Multi-Core Fiber Measurement Multi-core fiber measurement takes time and effort. This feature makes it possible to efficiently measure multi-core fibers through a dedicated menu. Projects Items that you need to specify in order to make multi-core measurements such as measurement conditions, analysis conditions, and core information are managed in projects. -
Page 26: Event Mapper
1.12 Event Mapper You can display measured result events as icons on the screen. Detailed event analysis results are displayed along with the displayed icons. In addition, if fault events (see section 3.6) are specified, icons are displayed in different colors depending on the results of pass/fail judgments. Each event is displayed as an icon. You can also switch to the waveform display using soft keys. Near-end reflection Reflection caused... -
Page 27: Other Features
1.13 Other Features The AQ1200x/AQ1205x also has the following features. • Data saving and loading • Language selection • Beep on/off • Startup menu selection • USB function selection (storage/communication) • Screen color selection • Current date and time configuration (see the operation guide, IM AQ1200-02EN) • Power save settings • Network settings (on models with the /LAN option) • Setup information initialization (to the factory default values) • AQ1200x/AQ1205x information display (model, serial no., suffix code, version, etc.) • Self test execution • Firmware version updating Index 1-21 IM AQ1200-01EN... -
Page 28: Top Screen
Chapter 2 Common Operations Top Screen When you turn the AQ1200x/AQ1205x on and it starts, the top screen appears. First select a feature from this top screen, and then configure the feature or carry out the measurement that corresponds to the feature you have selected. - Page 29 2.1 Top Screen Top Menu • You can also use the soft keys (F1 to F5) on the right side of the top menu to select a feature and display its setup or measurement operation menu. • The feature that you have used the rotary knob and ENTER to select is displayed in the top position (soft key F1) of the top menu. • If you use the rotary knob and ENTER to select a feature that is already displayed in the top menu, the feature will move to the top position of the top menu. If you press a soft key (F1 to F5), the feature that you have selected will also be moved to the top position.
- Page 30 2.1 Top Screen • OTDR Top Menu (during averaged measurement) When not During averaged After averaged measuring measurement measurement Waveform Analysis Marker Waveform Analysis Command Command Command If the Suffix Code Is -HE • The OTDR top menu will contain measurement condition setting commands. The F4 soft key will show the average duration command. The F5 soft key will show a command for switching to waveform analysis commands.
- Page 31 2.1 Top Screen • During averaged measurement, marker and measurement condition commands (cannot be used during measurement) appear. • When averaged measurement finishes, the menu will display waveform analysis commands. • OTDR Top Menu (during averaged measurement) When not During averaged After averaged measuring measurement measurement Detail mode During measurement, the operation can not be perform. Displays/clears Average duration snapshot waveforms command (see section 3.5) Switches to...
-
Page 32: Key, Rotary Knob, And Arrow Key Operations
Key, Rotary Knob, and Arrow Key Operations Key Operations Key operations are explained below using an example. Here we will examine the steps you would take to select the section analysis menu from the top screen. Use the rotary knob and ENTER to select OTDR. Or, press the OTDR soft key on the top menu. - Page 33 2.2 Key, Rotary Knob, and Arrow Key Operations This manual explains procedures in accordance with the following guidelines. • The following types of procedures are simplified. - Repetitive operations. - Detailed operations for proceeding to the desired setup menu or dialog box and information about the accompanying screen changes. • Step numbers are used in soft key explanations when there are many operations and when operations must be performed in different menus.
- Page 34 2.2 Key, Rotary Knob, and Arrow Key Operations Rotary Knob and Arrow Key Operations We will use the dialog box that appears when you press the OPM Setup soft key as an example to explain the rotary knob and arrow key operations. Press the OPN Setup soft key.
-
Page 35: Shortcut Keys
Shortcut Keys The AQ1200x/AQ1205x’s OTDR feature has a shortcut key feature. You can use the rotary knob and the SETUP key as shortcut keys. You can assign actions to each shortcut key. Using the rotary knob and ENTER, select OTDR. Press SETUP, the System Setup soft key, and then the OTDR soft key to display the following screen. - Page 36 2.3 Shortcut Keys Meaning of the Status Indicators Status Indicator Meaning None No action assigned Displays the file menu Displays the print menu Displays the scale menu Displays the visible light source menu Starts saving Starts printing Switches the resolution between coarse and fine for the cursor movement that you control Coarse / Fine by turning the rotary knob...
-
Page 37: Entering Strings
Entering Strings After you have selected a setup item and pressed ENTER, a character input dialog box will appear if it is necessary. This section explains the operations that you can perform after the dialog box appears. Entering Strings Using the rotary knob and ENTER, enter a string. The string that you entered appears in the edit screen. - Page 38 2.4 Entering Strings Entering Strings from the History Using the rotary knob and ENTER, select to display the input history screen. Using the rotary knob and ENTER, choose the string that you want to enter. The string appears in the edit screen. Note Entered strings are saved to the input history when you confirm them.
-
Page 39: Chapter 3 Optical Pulse Measurement And Analysis Conditions
Chapter 3 Optical Pulse Measurement and Analysis Conditions Selecting the Measurement Mode Procedure Measurement Screen Using the rotary knob and ENTER, select OTDR. Press SETUP and then the Meas Setup soft key to display the following screen. Set the measurement mode (Simple, Detail, Multi WL, PON). The Multi WL option is not available on the AQ1200B and AQ1200C. - Page 40 3.1 Selecting the Measurement Mode PON Mode In PON mode, you can set the measurement route details such as the number of splitter splits and measurement direction. In addition, an image of the specified route is displayed. Set the number of splitter stages (1, 2). Set the route (OLT ->...
-
Page 41: Simple (Full Auto) Mode
Selecting the Wavelength <Simple (Full Auto) Mode> Procedure Measurement Screen Using the rotary knob and ENTER, select OTDR. Press SETUP and then the Meas Setup soft key. Using the rotary knob and ENTER, set Mode to Simple to display the following screen. Set Mode to “Simple.” Set the wavelength . -
Page 42: Automatically Saving Measured Data
Automatically Saving Measured Data <Simple (Full Auto) Mode> Procedure Measurement Screen Using the rotary knob and ENTER, select OTDR. Press SETUP and then the Meas Setup soft key. Using the rotary knob and ENTER, set Mode to Simple to display the following screen. Set Mode to “Simple.”... -
Page 43: Selecting The Approximation Method (Marker)
Selecting the Approximation Method (Marker) <Simple (Full Auto) Mode> Procedure Analysis Setup Screen Using the rotary knob and ENTER, select OTDR. Press SETUP and then the Analysis Setup soft key. Using the rotary knob and ENTER, set Mode to Simple to display the following screen. Set Mode to “Simple.”... -
Page 44: Detail Mode And Multi Wl Mode
Setting Measurement Conditions <Detail Mode and Multi WL Mode> Procedure Measurement Screen Using the rotary knob and ENTER, select OTDR. Press SETUP and then the Meas Setup soft key. Using the rotary knob and ENTER, set Mode to Detail or Multi WL to display the following screen. - Page 45 SM 1650 nm Optical port 3 On the AQ1200A, AQ1200B, AQ1200C, and AQ1205A, the light for a single mode (SM) optical fiber is emitted from optical port 2. On the AQ1200E, AQ1205E, and AQ1205F, light with a 1310 nm or 1550 nm wavelength is transmitted from optical port 2, and light with a 1625 nm or 1650 nm wavelength is transmitted from optical port 3.
-
Page 46: Pulse Width
3.5 Setting Measurement Conditions Distance Range Specify a distance range that matches the cable length. The distance range that you can select varies depending on the wavelength. Specify a distance range value that is greater than the length of the optical fiber that you will measure. If you specify a shorter value, the Instrument will not be able to perform measurements properly. - Page 47 3.5 Setting Measurement Conditions Sample Interval The maximum number of sample data points is 128000. The shortest sample interval is determined by the distance range. Normal: The Instrument uses the optimum sample interval for the measurement method to perform measurements. Hi-Resolution: The Instrument uses the shortest sample interval to perform measurements.
- Page 48 3.5 Setting Measurement Conditions Average Count and Average Duration You can select the following values. Duration: 5sec, 10sec, 20sec, 30sec, 1min, 3min, 5min, 10min, 20min, 30min Sec is seconds, and min is minutes. Times: 2^10 (1024 times), 2^11 (2048 times), 2^12 (4096 times), 2^13 (8192 times), 2^14 (16384 times), 2^15 (32768 times), 2^16 (65536 times), 2^17 (131072 times), 2^18 (262144 times), 2^19 (524288 times), 2^20 (1048576 times) 2^10 is 2 to the power of 10 (1024 times).
- Page 49 3.5 Setting Measurement Conditions Fiber-in-Use Alarm Some models in the AQ1200x/AQ1205x use the same wavelength that is used in real communication to make measurements. If communication light is present in the optical fiber that you want to measure, the communication will be affected. When this communication light is present, we say that the fiber is in use.
-
Page 50: Setting Analysis Conditions
Setting Analysis Conditions <Detail Mode and Multi WL Mode> Procedure Analysis Setup Screen Using the rotary knob and ENTER, select OTDR. Press SETUP and then the Analysis Setup soft key. Using the rotary knob and ENTER, set Mode to Detail or Multi WL to display the following screen. - Page 51 3.6 Setting Analysis Conditions Explanation Index of Refraction The Instrument uses indices of refraction in the calculations that it performs to measure distance. If you do not set the correct index of refraction, the distance measurement will be incorrect. The Instrument has the following preset indices of refraction that correspond to each wavelength. 1310 nm: 1.46000 1550 nm: 1.46000 1625 nm: 1.46000...
- Page 52 3.6 Setting Analysis Conditions The Instrument uses the difference between the levels of the two specified points to calculate the loss. The level of fluctuation and reproducibility in the calculated value may vary greatly. If reflection and splice loss events are present in the section being calculated, the TPA provides a value that has a smaller degree of error than the LSA.
- Page 53 3.6 Setting Analysis Conditions Fault Events Display Events that are greater than or equal to the specified threshold (or reflections that are less than or equal to the specified threshold) are displayed as fault events. Off: Events that have exceeded their threshold values are not displayed with an asterisk attached to them.
- Page 54 3.6 Setting Analysis Conditions Macro Bending (Bending Loss) When an optical pulse measurement is performed in Multi WL measurement mode, you can compare the difference between the splice losses at wavelengths of 1310 nm and 1550 nm and display on the screen bending loss events that are caused by bends in the fiber.
- Page 55 Normal: Pulse light is generated at the maximum power. Low: Pulse light is generated at low power. You cannot set the pulse light output level on the AQ1200A or AQ1205A. Index 3-17 IM AQ1200-01EN...
-
Page 56: Giving Notifications When Installations Are Complete
Giving Notifications When Installations Are Complete Procedure Using the rotary knob and ENTER, select OTDR. Press SETUP, the System Setup soft key, and then the OTDR soft key to display the following screen. Configure the work completion notification. Press ENTER to display the Work completion notice setting dialog box. - Page 57 3.8 Giving Notifications When Installations Are Complete Message Display Off: Messages are not displayed. On: Completion messages are displayed on the screen. Alarm Off: The Instrument does not sound an alarm. On: The Instrument sounds an alarm. Confirmation When the Instrument checks the work completion, a message confirming whether you have set the cursor to a position that is a little after the installation point is displayed.
-
Page 58: Selecting The Calculation Method For Total Loss And Total Return Loss
Selecting the Calculation Method for Total Loss and Total Return Loss Procedure Using the rotary knob and ENTER, select OTDR. Press SETUP, the System Setup soft key, and then the OTDR soft key to display the following screen. Set the calculation method for total loss (Cumulate loss, Loss between S and E). - Page 59 3.9 Selecting the Calculation Method for Total Loss and Total Return Loss Calculation Method for Total Return Loss Select whether to include the return loss value at the end of fiber (E) in the total return loss. Include END: The value is included in the total return loss. Exclude END: The value is not included in the total return loss.
-
Page 60: Selecting The Label Display Method
3.10 Selecting the Label Display Method Procedure Using the rotary knob and ENTER, select OTDR. Press SETUP, the System Setup soft key, and then the OTDR soft key to display the following screen. Set the label display method (Comment(File), Label). Explanation Label Display Method • Comment(File) - Page 61 3.10 Selecting the Label Display Method Shows the label at the bottom of the screen (only when Label Setup is set to Label) Index 3-23 IM AQ1200-01EN...
-
Page 62: Chapter 4 Measuring Optical Pulses
Chapter 4 Measuring Optical Pulses Performing Real-time Measurement In real-time measurement, you can view waveform changes in real time. You can change the conditions while measurement is being performed. WARNING • During measurement, do not remove the optical fiber cable, because light is emitted from the light source port. Visual impairment may occur if the light enters the eye. • Close the covers of any light source ports that do not have optical fiber cables connected to them. On models with two or more light source ports, visual impairment may occur if light that is mistakenly emitted from the wrong port enters the eye. - Page 63 4.1 Performing Real-time Measurement Setting the Work Completion Point Move the cursor to a position that is a little after the installation point. Press the Completion Check soft key to select ON. • When Confirmation is set to “Check only once” or “Check everytime” A message appears asking whether you have moved the cursor to the work completion point. Click OK. Measurement starts.
- Page 64 4.1 Performing Real-time Measurement Installation Completion Notification Move the cursor to a position a little after the installation point before you perform real-time measurement. If the fiber end detection position is the same as the cursor position when you perform real-time measurement, the Instrument displays a message on the screen or sounds an alarm.
-
Page 65: Performing Averaged Measurements
Performing Averaged Measurements In averaged measurements, the data that is acquired from each pulse is averaged and displayed. By performing averaged measurements, you can improve the signal-to-noise (S/N) ratio. This is effective when you want to detect faint events that are buried in noise. WARNING • During measurement, do not remove the optical fiber cable, because light is emitted from the light source port. Visual impairment may occur if the light enters the eye. - Page 66 4.2 Performing Averaged Measurements When the average measurement completes in accordance with the specified conditions, the measurement stops automatically. The OTDR menu appears. To stop the average measurement in progress, press AVE. Switching the Current Trace (in Multi WL mode) Press the Current Trace soft key to switch the current trace.
- Page 67 4.2 Performing Averaged Measurements Current Trace You can only analyze the current trace using markers and cursors. In Multi WL measurement mode, the Current Soft key is enabled when measurement of multiple wavelengths are completed. Press the Current Trace soft key to select the waveform that you want to analyze.
-
Page 68: Displaying Snapshot Waveforms
Displaying Snapshot Waveforms You can measure waveforms while retaining the previous waveform on the screen (a snapshot). The Instrument displays the measured waveform and the snapshot waveform at the same time. Procedure Snapshot Screen Using the rotary knob and ENTER, select OTDR. Display the waveform on the screen, and then press the Snapshot soft key. -
Page 69: Waveform Display Screen
Chapter 5 Waveform Display Waveform Display Screen Procedure Display Screen Using the rotary knob and ENTER, select OTDR to display the following screen. Date and time See the operation guide, IM AQ1200-02EN. Value per division on the vertical axis Progress during averaged measurements (AVG) Waveform display area The progress bar behind the characters indicates how Measurement mode... -
Page 70: Zooming The Waveform Display Scale
Zooming the Waveform Display Scale Procedure Switching between Zooming and Moving the Displayed Waveform Using the rotary knob and ENTER, select OTDR. Press SETUP and then the Scale soft key to display the following screen. Enables zooming Press this soft key to enable the arrow keys to zoom the display in and out. - Page 71 5.2 Zooming the Waveform Display Scale Explanation Zooming In and Out You can press the arrow keys to zoom the displayed waveform in or out. When the cursor is displayed, the waveform is zoomed at the cursor position. When the cursor is not displayed, the waveform is zoomed at the left edge of the display. Down arrow key: Zoom in on the waveform in the vertical direction.
- Page 72 5.2 Zooming the Waveform Display Scale Auto Zoom The auto zoom feature contains the following two types of zoomed displays. • Zoom the waveform at the cursor position The cursor on the waveform display screen is shown in the center of the zoomed display. • Zoom the waveform at event positions When the Instrument has detected events during event analysis, the selected event is zoomed and displayed.
-
Page 73: Moving The Waveform Display Position
Moving the Waveform Display Position Procedure Switching between Zooming and Moving the Displayed Waveform Using the rotary knob and ENTER, select OTDR. Press SETUP and then the Scale soft key to display the following screen. Enables zooming (See section 5.2.) Enables moving in the vertical and horizontal directions Press this soft key to enable the arrow... -
Page 74: Initializing The Waveform Display Scale
Initializing the Waveform Display Scale Procedure Initializing the Display Scale Using the rotary knob and ENTER, select OTDR. Press SETUP and then the Scale soft key to display the following screen. Enables zooming (See section 5.2.) Enables moving in the vertical and horizontal directions (See section 5.3.) Set the amount the cursor moves... -
Page 75: Setting The Waveform Information Display
Setting the Waveform Information Display Procedure Waveform Display Information Setup Screen Using the rotary knob and ENTER, select OTDR. Press SETUP, the System Setup soft key, and then the OTDR soft key to display the following screen. System setup screen Configure the shortcut key. - Page 76 Marker Line Note Line is often used outside of Japan. Marker is often used within Japan. It is used on existing YOKOGAWA models. Displaying the Cursor dB Values You can display not only the distance at the cursor position, but also the dB value.
- Page 77 5.5 Setting the Waveform Information Display Ghost Cursors Ghost cursors are used to check for secondary reflections. A secondary reflection is a reflection that is detected in a location where no event actually occurs. Off: Ghost cursors are not displayed. On: Ghost cursors are displayed.
- Page 78 5.5 Setting the Waveform Information Display Approximated Lines In the 4 Point or 5 Point marker modes, you can display the approximated lines that are used to calculate splice loss or return loss. Off: Approximated lines are not displayed. On: Approximated lines are displayed. Approximated lines Marker Information You can display the distance from the measurement reference point to each marker on the waveform...
- Page 79 5.5 Setting the Waveform Information Display Selecting the Cursor Type You can select the cursor type from the following: Cross(+) Uses a crosshair to indicate a position on the waveform. Line( ¦ ) Uses a line to indicate a position on the waveform. Line display Crosshair display Event List...
-
Page 80: How To Operate The Cursor And Markers
Chapter 6 Waveform Analysis How to Operate the Cursor and Markers You can use markers to measure values such as the distance, splice loss, or return loss between two points. This section will explain how to operate the cursor and markers. For information on the splice loss and return loss measurements, see sections 6.2 and later. - Page 81 6.1 How to Operate the Cursor and Markers Displaying Markers (Marker mode: Marker) Using the rotary knob and ENTER, select OTDR. Press the Marker soft key to display the following screen. Analysis Marker When the suffix code is -HE, press the soft key and then the soft key.
- Page 82 6.1 How to Operate the Cursor and Markers 4 Point Markers Press the 4 Point Markers soft key shown on the previous page to display the following screen. Marker Marker Marker Y2 Marker Set marker Set marker to the cursor position. Set marker Set marker to the cursor position.
- Page 83 6.1 How to Operate the Cursor and Markers Deleting Markers or the Cursor Press the Auxiliary Function soft key shown on page 6-2 to display the following screen. Delete the markers. Delete the cursor. Note For details on the marker modes, see section 5.5. Displaying Markers (Marker mode: Line) Using the rotary knob and ENTER, select OTDR.
- Page 84 6.1 How to Operate the Cursor and Markers 2 Point Markers Press the 2 Point Markers soft key shown on the previous page to display the following screen. Marker n Marker E Set the cursor. Turn the rotary knob to display and then move the cursor.
- Page 85 6.1 How to Operate the Cursor and Markers Explanation 2 Point Markers The Instrument measures the distance and the loss between two points. If reflection is detected between the two points, the return loss is also measured. (n in Line mode.) 20 dB (example) (E in Line mode.) 20 km (example)
- Page 86 6.1 How to Operate the Cursor and Markers 5 Point Markers This mode is only enabled when the Marker Mode is set to Line. The Instrument uses the following five points to perform the measurement: the near-end point (n), a point (N) that is used to calculate the near-end side’s approximated line, a point (E) where splice loss is detected, a point (F) that is used to calculate the far-end side’s approximated line, and the far-end point (f).
-
Page 87: Measuring Distances
Measuring Distances By placing the cursor on the acquired waveform, you can measure the distance to events such as reflections and splice losses. Procedure Using the Cursor to Measure the Distance Follow the procedure below to measure the distance between the distance reference and the cursor. Using the rotary knob and ENTER, select OTDR to display the following screen. -
Page 88: Moving The Distance Measurement Reference Point
Moving the Distance Measurement Reference Point Procedure Moving the Distance Reference Using the rotary knob and ENTER, select OTDR. Press the Marker soft key and then the Distance Ref Setup soft key to display the following screen. Analysis Marker When the suffix code is -HE, press the soft key, the soft key, and then the... -
Page 89: Measuring The Splice Loss
Measuring the Splice Loss Procedure When Marker Mode Is Set to Marker Using the rotary knob and ENTER, select OTDR. Press the Marker soft key and then the 4 Point Markers soft key to display the following screen. When the suffix code is -HE, press the Analysis soft key, the Marker... -
Page 90: Measuring The Return Loss
Measuring the Return Loss Procedure When Marker Mode Is Set to Marker Using the rotary knob and ENTER, select OTDR. Press the Marker soft key and then the 2 Point Markers soft key to display the following screen. When the suffix code is -HE, press the Analysis soft key, the Marker... - Page 91 6.5 Measuring the Return Loss Explanation Return Loss • If “<” is displayed next to the return loss value, the measured waveform is saturated. If the waveform is saturated, the actual reflection value is larger than the value shown. To prevent a waveform from being saturated, you can: • Select a large attenuation value, and perform the measurement again.
-
Page 92: Displaying Multiple Traces
Displaying Multiple Traces Procedure Multi Trace Analysis Screen Use the rotary knob and ENTER to select OTDR. Press the Advanced Analysis soft key and then the MultiTrace soft key. The MultiTrace menu appears. When the suffix code is -HE, press the Analysis soft key, the Advanced Analysis... -
Page 93: Combining Two Traces
Combining Two Traces Procedure 2-WayTrace Screen Use the rotary knob and ENTER to select OTDR. Press the Advanced Analysis soft key and then the 2-WayTrace soft key. The following screen appears. When the suffix code is -HE, press the Analysis soft key, the Advanced Analysis soft key and then... - Page 94 6.7 Combining Two Traces Event Screen of 2 Way Trace Analysis The horizontal axes of the combined traces are aligned so that the end point of the top trace (end A → end B) match the 0 m position (distance reference) of the bottom trace (end A ← end B). Distance reference (0 m position) of the bottom trace Top trace (end A → end B) Bottom trace ▲ (end A ← end B) ▲ ▲ ▲ End point of the top trace As shown in the above figure, markers are added only to the trace in which events are found.
-
Page 95: Displaying Differential Traces
Displaying Differential Traces Procedure Differential Trace Screen Use the rotary knob and ENTER to select OTDR. Press the Advanced Analysis soft key and then the Diff. Trace soft key. The following screen appears. When the suffix code is -HE, press the Analysis soft key, the Advanced Analysis... - Page 96 6.8 Displaying Differential Traces Differential Trace Analysis The differential trace is the result of subtracting the values of the current trace from those of the other trace. Marker Features You can place cursors and markers on the differential trace. You can display the distance at each cursor position as well as the following values between markers.
-
Page 97: Analyzing Sections
Analyzing Sections Follow the procedure below to measure the return loss and the total loss for the specified section. Procedure Section Analysis Screen Using the rotary knob and ENTER, select OTDR. Press the Advanced Analysis soft key, and then the Section Analysis soft key to display the following screen. - Page 98 6.9 Analyzing Sections Explanation Section Analysis In sections 6.2 to 6.5, each item was measured with the distance reference as the reference point, but in section analysis, each item is measured with the location that is specified as the start point within the specified section as the reference point.
-
Page 99: Chapter 7 Event Analysis
Chapter 7 Event Analysis Displaying the Event Screen Procedure Event Screen Screen display items: Trace+List Using the rotary knob and ENTER, select OTDR. Press the Event Analysis soft key to display the following screen. When the suffix code is -HE, press the Analysis soft key and then the Event Analysis... - Page 100 7.1 Displaying the Event Screen 2 Point Markers This feature is not available on models with -HE suffix codes. Using the rotary knob and ENTER, select OTDR. Press the Event Analysis soft key and then the 2 Point Markers soft key to display the following screen.
- Page 101 7.1 Displaying the Event Screen Section Group Index (Section IOR) The index of refraction between events is displayed. Analysis Values • Total RL The integrated value of the return losses of each event. • Total distance The distance between the measurement reference point and the END point. • Total Loss Displayed in the following manner depending on the total loss calculation method.
-
Page 102: Editing Events
Editing Events There may be cases where, because the backscattering light level is too small at a reflection point in an optical fiber, the reflection cannot be detected as an event, or there may be cases where noise is detected as an event. In such cases, you can adjust the events by editing them as follows: • Inserts events • Deletes events... - Page 103 7.2 Editing Waveforms Deleting an Event Press the Rotary Knob soft key to select Event. Use the rotary knob to select the event that you want to delete. Press the Del. Event soft key. The selected event’s color changes. The event is deleted virtually. When the event is deleted, the subsequent event numbers are each decreased by one.
- Page 104 7.2 Editing Waveforms When Marker Mode Is Set to Line Selects an event marker (C, n, N, E, F, f) Press this soft key to select the event marker that you want to move. Set the rotary knob function to Cursor. Press the Select soft key to select the event marker that you want to move.
- Page 105 7.2 Editing Waveforms How the events that are detected at positions other than the master event positions are displayed varies depending on the Event Fix Mode as follows: When Event Fix Mode Is Set to Mode1 Events detected at positions other than the master event positions are displayed in the event list. Events other than fixed events are also detected.
-
Page 106: Editing The Event List
Editing the Event List Procedure Editing Events Use the rotary knob and ENTER to select OTDR. Press the Event Analysis soft key and then the Display soft key to select List. Analysis Event Analysis When the suffix code is -HE, press the soft key, the soft key and then Display... - Page 107 Chapter 8 Light Source (Option) Producing Measurement Light WARNING • While the Instrument is producing light, do not remove the optical fiber cable, because light is emitted from the light source port. Visual impairment may occur if the light enters the eye. • Close the covers of any light source ports that do not have optical fiber cables connected to them. On models with two or more light source ports, visual impairment may occur if light that is mistakenly emitted from the wrong port enters the eye. French AVERTISSEMENT • Lorsque l’AQ1200x/AQ1205x génère de la lumière, la lumière est émise à travers les...
-
Page 108: Chapter 8 Light Source (Option)
AQ1205F SM 1310 nm, SM 1550 nm, SM 1650 nm On the AQ1200A, AQ1200B, AQ1200C, and AQ1205A, the light for a single mode (SM) optical fiber is emitted from optical port 2. On the AQ1200E, AQ1205E, and AQ1205F, light with a 1310 nm or 1550 nm wavelength is transmitted from optical port 2, and light with a 1625 nm or 1650 nm wavelength is transmitted from optical port 3. - Page 109 8.1 Producing Measurement Light Modulation Mode You can set the frequency of the light to one of the following options. CW (continuous light), 270 Hz, 1 kHz, 2 kHz Index IM AQ1200-01EN...
-
Page 110: Turning On The Visible Light
Turning On the Visible Light WARNING • While the Instrument is producing light, light is emitted from the light source port. Do not look directly at this light. Visual impairment may occur if the light enters the eye. • Close the covers of any light source ports that do not have optical fiber cables connected to them. On models with two or more light source ports, visual impairment may occur if light that is mistakenly emitted from the wrong port enters the eye. French AVERTISSEMENT • Lorsque l’AQ1200x/AQ1205x génère de la lumière, la lumière est émise à travers les ports de source lumineuse. - Page 111 8.2 Turning On the Visible Light Turning the Light Source On and Off Press the LS VLS ON/OFF soft key to display the following menu. Turns the light on Turns the light off The visible light turns on. The light turns off. The A mark appears on the light mark disappears.
- Page 112 8.2 Turning On the Visible Light Visible Light Source Screen Using the rotary knob and ENTER, select Visible Light Source to display the following screen. Laser on indication Light mark Turns the light on The visible light turns on. A mark appears on the instrument display to indicate that the light is on.
-
Page 113: Chapter 9 Optical Power Meter (Option)
Chapter 9 Optical Power Meter (Option) Making Preparations for Measurements Remove the optical fiber cables from the Instrument and close the optical connector covers, or make sure that the power meter is not receiving any light, and then start the optical power meter zero set procedure. -
Page 114: Setting Optical Power Measurement Conditions And Holding The Display
Setting Optical Power Measurement Conditions and Holding the Display Procedure Power Meter Screen Using the rotary knob and ENTER, select LS_OPM (the power meter light source) to display the following screen. (Model with /SPM option) Bar graph display of the measured value Measured value Sets the reference to the currently displayed measured value Holds the measured value display... - Page 115 9.2 Setting Optical Power Measurement Conditions and Holding the Display Explanation This feature is available on models with the /SLT, /HLT, /PPM or /SPM option. Wavelength The light receiving element of the optical power measurement section has a wavelength sensitivity characteristic. The Instrument measures optical power more accurately by adjusting the sensitivity according to the specified wavelength.
- Page 116 9.2 Setting Optical Power Measurement Conditions and Holding the Display Turning the Maximum and Minimum Value Menu On and Off In the Power Meter screen, you can display a menu that shows the maximum (Max) and minimum (Min) measured values. The menu is displayed.
- Page 117 Logging Measured Values and Saving Logged Results Procedure Logging Screen Screen display items: Power Meter Using the rotary knob and ENTER, select LS_OPM (the power meter light source). Press the Logging soft key to select Power Meter. The following screen appears. Set Display to “Power Meter.”...
-
Page 118: Logging Measured Values And Saving Logged Results
9.3 Logging Measured Values and Saving Logged Results Display: Logging > Display Press the Auxiliary Function soft key to show the display’s setup screen. Auto zoom Automatically zooms in on the graph at the cursor position. Zoom initialization Resets the scale so that the graph displays the entire optical power range. - Page 119 9.3 Logging Measured Values and Saving Logged Results Detailed Setup Screen Press the SETUP soft key and then the Data Save Logging soft key to display the following screen. Set the measurement interval (500ms, 1s, 2s, 5s, 10s). Set the logging count (10 to 36000). The time to perform logging measurements over is calculated automatically from the measurement interval and the logging count and displayed.
- Page 120 9.3 Logging Measured Values and Saving Logged Results Logging Count You can set the number of values to log within the following range. 10 to 36000 Drive to Save To You can set the destination drive to one of the following options. Internal memory, USB memory File Name You can specify file names by combining comments and numbers.
- Page 121 9.3 Logging Measured Values and Saving Logged Results Vertical zoom factor: ×5 Cursor position Press the down arrow key to zoom the graph display vertically. Vertical zoom factor: ×50 Cursor position Press the left arrow key to zoom the graph display horizontally. Cursor position Horizontal zoom factor: ×10 Overview Display...
-
Page 122: Selecting And Saving Core And Tape Numbers
Selecting and Saving Core and Tape Numbers Procedure Data Save Screen Using the rotary knob and ENTER, select LS_OPM (the power meter light source). Press the Save Data soft key to display the following screen. On the detailed setup screen on the next page, you can set the starting core number, tape number type, and number of fibers. - Page 123 9.4 Selecting and Saving Core and Tape Numbers Delete Data Screen No. 1, 2, and 3 Core no. Deletes the data at no. 1 Deletes the data at no. 2 Use the rotary knob and the arrow keys to select a core number. Deletes the data at no.
- Page 124 9.4 Selecting and Saving Core and Tape Numbers Example When the Starting Core Number Is Set to “5,” the Tape Number Type Is Set to “a-h(8),” and the Number of Tapes Is Set to “10” Core List List The list begins with the starting core number 5. The list begins with the starting core number 5. Each core number is divided into eight tape Each core number is divided into eight tape numbers from a to h.
-
Page 125: Chapter 10 Pon Power Meter (Option)
Chapter 10 PON Power Meter (Option) 10.1 Making Preparations for Measurements Remove the optical fiber cables from the Instrument and close the optical connector covers, or make sure that the power meter is not receiving any light, and then start the PON power meter zero set procedure. -
Page 126: Setting Pon System Optical Power Measurement Conditions And Holding The Display
10.2 Setting PON System Optical Power Measurement Conditions and Holding the Display Procedure Power Meter Screen Using the rotary knob and ENTER, select PON_OPM (PON power meter) to display the following screen. When the Signal Direction Is ONU -> OLT Bar graph display of the measured value Measured value... - Page 127 10.2 Setting PON System Optical Power Measurement Conditions and Holding the Display Detailed Setup Screen Press SETUP and then the OPM SETUP soft key to display the following screen. Set the average count (1, 10, 50, 100). Set the offset (–9.900 to 9.900 dB). Set it for each PON system wavelength.
- Page 128 10.2 Setting PON System Optical Power Measurement Conditions and Holding the Display Threshold Value For each wavelength, you can set upper and lower threshold values and determine whether or not the measured values fall within them. • The range for the upper and lower threshold values is –80 to 40 dBm. You must set the values so that the upper threshold value is greater than the lower threshold value. • When a measured value is within the upper and lower thresholds, its bar graph is green. “PASS”...
-
Page 129: Selecting And Saving Core And Tape Numbers
10.3 Selecting and Saving Core and Tape Numbers Procedure Data Save Screen Using the rotary knob and ENTER, select PON_OPM (PON power meter). Press SAVE DATA to display the following screen. On the detailed setup screen on the next page, you can set the starting core number, the tape number type, and the number of fibers. - Page 130 10.3 Selecting and Saving Core and Tape Numbers Delete Data Screen Core no. No. 1, 2, and 3 If you delete data, the Save Data menu is displayed. Deletes the data of all the selected cores Deletes all the core data Use the rotary knob and the arrow keys to select a core number.
- Page 131 10.3 Selecting and Saving Core and Tape Numbers Example When the Starting Core Number Is Set to “5,” the Tape Number Type Is Set to “a-h(8),” and the Number of Tapes Is Set to “10” Core List List The list begins with the starting core number 5. The list begins with the starting core number 5. Each core number is divided into eight tape Each core number is divided into eight tape numbers from a to h.
-
Page 132: Making Preparations And Adjustments For Loss Testing
Chapter 11 Loss Testing (Option) 11.1 Making Preparations and Adjustments for Loss Testing Procedure Performing Zero Set Remove the optical fiber cables from the Instrument and close the optical connector covers, or make sure that the power meter is not receiving any light, and then start the optical power meter zero set procedure. - Page 133 Use a model (sold separately) that has a light source whose wavelength is compatible (such as the AQ1200A, or AQ1100 series). Zero Set Perform zero set whenever necessary, such as after you have turned on the power or when the ambient temperature changes. Performing zero set adjusts the internal deviation of the optical power...
-
Page 134: Performing An Auto Loss Test
11.2 Performing an Auto Loss Test Procedure Configuring the Optical Power Meter Power Meter Screen Using the rotary knob and ENTER, select Auto Loss Test. Press the Function Select soft key and then the Power Meter soft key to display the following screen. - Page 135 11.2 Performing an Auto Loss Test Configuring the Light Source and Executing an Auto Loss Test Light Source Screen Using the rotary knob and ENTER, select Auto Loss Test. Press the Function Select soft key and then the Light Source soft key to display the following screen.
- Page 136 11.2 Performing an Auto Loss Test Connect one end of the optical fiber or line that you need to perform loss testing on to the optical power measurement port of the power meter, and connect the other end to the light source port of the light source.
- Page 137 11.2 Performing an Auto Loss Test Delete Data Screen No. 1, 2, and 3 Core no. Deletes the data of all the selected cores Deletes all the core data Use the rotary knob and the arrow If you delete data, the Save keys to select a core number.
- Page 138 AQ1205F SM 1310 nm, SM 1550 nm, SM 1650 nm On the AQ1200A, AQ1200B, AQ1200C, and AQ1205A, the light for a single mode (SM) optical fiber is emitted from optical port 2. On the AQ1200E, AQ1205E, and AQ1205F, light with a 1310 nm or 1550 nm wavelength is transmitted from optical port 2, and light with a 1625 nm or 1650 nm wavelength is transmitted from optical port 3.
-
Page 139: Performing A Loop-Back Loss Test
11.3 Performing a Loop-Back Loss Test Procedure Configuring the Optical Power Meter and Light Source Power Meter and Light Source Screens Using the rotary knob and ENTER, select Auto Loss Test. Press the Function Select soft key and then the Loop Back soft key to display the following screen. - Page 140 11.3 Performing a Loop-Back Loss Test Executing a Loop-Back Loss Test WARNING • While the Instrument is producing light, do not remove the optical fiber cable, because light is emitted from the light source port. Visual impairment may occur if the light enters the eye. • Close the covers of any light source ports that do not have optical fiber cables connected to them. On models with two or more light source ports, visual impairment may occur if light that is mistakenly emitted from the wrong port enters the eye. French AVERTISSEMENT • Lorsque l’AQ1200x/AQ1205x génère de la lumière, la lumière est émise à travers les...
- Page 141 11.3 Performing a Loop-Back Loss Test Saving Data Data Save Screen In the Power Meter screen of the optical power meter, press the Save Data soft key to display the following screen. Follow the procedure in section 11.2 to save the data. Saving Data to a File Press SETUP and the File soft key.
-
Page 142: Chapter 12 Multi-Core Loss Testing (Option)
Chapter 12 Multi-Core Loss Testing (Option) 12.1 Creating New Projects Procedure New Project Screen Using the rotary knob and ENTER, select Multi-Core Loss Test. Press the Master/Slave soft key to select Master. Press the New Project soft key to display the following screen. Complete Press this soft key after you have configured the project, wavelength, and offset settings. - Page 143 AQ1205F SM 1310 nm, SM 1550 nm, SM 1650 nm On the AQ1200A, AQ1200B, AQ1200C, and AQ1205A, the light for a single mode (SM) optical fiber is emitted from optical port 2. On the AQ1200E, AQ1205E, and AQ1205F, light with a 1310 nm or 1550 nm wavelength is transmitted from optical port 2, and light with a 1625 nm or 1650 nm wavelength is transmitted from optical port 3.
-
Page 144: Sharing Projects
12.2 Sharing Projects Project information can be shared between the master and slave in the following three ways. • Sending projects • Loading project files • Restarting interrupted loss tests Procedure Sending a Project WARNING • While the Instrument is producing light, do not remove the optical fiber cable, because light is emitted from the light source port. Visual impairment may occur if the light enters the eye. • Close the covers of any light source ports that do not have optical fiber cables connected to them. On models with two or more light source ports, visual impairment may occur if light that is mistakenly emitted from the wrong port enters the eye. French AVERTISSEMENT • Lorsque l’AQ1200x/AQ1205x génère de la lumière, la lumière est émise à travers les... - Page 145 12.2 Sharing Projects Slave Master 1. Using the rotary knob and ENTER, select Multi-Core 4. Using the rotary knob and ENTER, select Multi-Core Loss Test. Loss Test. Press the Master/Slave soft key to select Slave. The Press the Master/Slave soft key to select Master. following menu appears.
- Page 146 12.2 Sharing Projects Restarting an Interrupted Loss Test When the loss test for a shared project is interrupted, you can restart it where it left off, retaining the results of the test so far. The operation for restarting the test is the same for both the master and the slave. Using the rotary knob and ENTER, select Multi-Core Loss Test. Press the Previous Project soft key to display the following screen.
-
Page 147: Performing A Multi-Core Loss Test
12.3 Performing a Multi-Core Loss Test Connect one end of the communication fiber that you specified to the master’s light source port (optical port 2), and connect the other end to the slave’s optical power measurement port (optical port 1). Then perform the multi-core loss test. - Page 148 12.3 Performing a Multi-Core Loss Test Master Connect the optical fiber under loss test to the optical power measurement port. Use the rotary knob and the arrow keys to select the core number of the connected fiber. Press the Loss Test START soft key. The optical signal used to transmit the core number is sent to the slave.
- Page 149 12.3 Performing a Multi-Core Loss Test Displayed List Check mark indicating that the core’s loss test has been completed Skipped core numbers are dimmed. The core number that is undergoing loss testing is highlighted. Core no. Loss Test Results Use the rotary knob and the arrow keys to select a core number.
-
Page 150: Optical Power Adjustment
12.4 Optical Power Adjustment Procedure WARNING • While the Instrument is producing light, do not remove the optical fiber cable, because light is emitted from the light source port. Visual impairment may occur if the light enters the eye. • Close the covers of any light source ports that do not have optical fiber cables connected to them. On models with two or more light source ports, visual impairment may occur if light that is mistakenly emitted from the wrong port enters the eye. French AVERTISSEMENT • Lorsque l’AQ1200x/AQ1205x génère de la lumière, la lumière est émise à travers les... - Page 151 12.4 Optical Power Adjustment Explanation Adjust the optical power of the light source as necessary. When you execute optical power adjustment, the Instrument automatically identifies the optical power level and adjusts itself accordingly. Perform optical power adjustment on the light source (slave). • Optical power adjustment begins when you press the Execute soft key. When it ends normally, the Instrument returns to the previous screen. During adjustment, “Execute” changes to “Abort.” All soft keys other than the Abort soft key are unavailable. • Press the Abort soft key to stop optical power adjustment. “Abort” will change to “Execute.” The adjustment value will return to the value that it was at before adjustment was executed. • Connect a short optical fiber of a few meters or less in length. Make sure that the fiber is free from dirt, scratches, bends, and other potential causes of optical degradation. • The initial adjustment value is the factory default setting. 12-10 IM AQ1200-01EN...
-
Page 152: Chapter 13 Fault Locator
Chapter 13 Fault Locator 13.1 Locating Breaks (Faults) in Optical Fibers The Instrument is equipped with a feature that you can use to locate and display faults in optical fibers. This feature works by performing an OTDR averaged measurement and then automatically performing an OTDR event analysis. - Page 153 13.1 Locating Breaks (Faults) in Optical Fibers Fault Locator Screen Select the soft key that corresponds to the route in which to search for breaks, and press ENTER. The following screen appears. Fault location Set the wavelength . The available options vary depending on the model.
- Page 154 13.1 Locating Breaks (Faults) in Optical Fibers French AVERTISSEMENT • Lorsque l’AQ1200x/AQ1205x génère de la lumière, la lumière est émise à travers les ports de source lumineuse. Ne pas débrancher les câbles de fibre optique connectés. Des lésions oculaires peuvent être causées si le faisceau lumineux pénètre l’œil. • Masquer les orifices de source lumineuse sur lesquels aucun câble à fibres optiques n'est branché. Sur les modèles d'au moins deux orifices de source lumineuse, une déficience visuelle peut se produire si la lumière émise par erreur du mauvais orifice pénètre dans l'œil.
-
Page 155: Chapter 14 Checking Fiber End Faces
If you connect the USB fiber inspection probe while the Instrument is on, the Instrument will automatically recognize the probe. For cautions regarding connecting the probe, see Note in section 18.1. For information about compatible fiber inspection probes, contact your nearest YOKOGAWA dealer. Index 14-1... -
Page 156: Chapter 15 Ip Testing (Option)
Chapter 15 IP Testing (Option) 15.1 Performing an IP Test Procedure Ping Test Setup Screen Using the rotary knob and ENTER, select IP Test to display the following screen. Set the address to ping. Set the frame length (32 to 1526 bytes) Set the Tx Mode (Continue, Frames, Time) •... - Page 157 15.1 Performing an IP Test Pinging Pinging is executed according to the Tx mode that you set. • When it ends normally, the Instrument returns to the previous screen. During pinging, “PING Start” changes to “PING Stop.” All soft keys other than the PING Stop soft key are unavailable. • To stop pinging, press the PING Stop soft key. “PING Stop” will change to “PING Start.” Ping Test Results The ping test results are listed below.
-
Page 158: Chapter 16 Multi-Core Fiber Measurement
Chapter 16 Multi-Core Fiber Measurement 16.1 Creating a New Project Procedure Main View Screen Using the rotary knob and ENTER, select Multi-Core Fiber Meas. The following screen appears. The last measurement project appears. If you are using this feature for the first time after purchase or if the settings have been initialized, “NewProject” will appear. “NewProject” is an empty project. - Page 159 16.1 Creating a New Project Entering Measurement Core Information Project Setup Screen Press SETUP and then the Project Setup soft key. The following screen appears. Change the project name. A character input dialog box will open (see “Creating a New Project”...
- Page 160 16.1 Creating a New Project Setting Analysis Conditions Analysis Setup (Multi Wavelength) Screen Press the Analysis Setup soft key. The following screen appears. Follow the procedure in section 3.6, “Setting Analysis Conditions.” Note Depending on the analysis conditions that you change, event detection of all fibers may be executed again. For details, see “Changing Analysis Conditions”...
- Page 161 16.1 Creating a New Project Explanation Projects Projects are group of items for measuring multi-core fibers. Projects include the measurement fiber’s number of cores, measurement conditions, analysis conditions, save destination of measured results, etc. When you select the multi-core measurement feature, the last measurement project appears on the main view screen. To measure using a project different from the previous project, set the project in one of the following ways. • Create a new project • Load an existing project file containing project information from the internal memory or a USB memory device (see section 16.2). Main View Screen The project information is displayed in a list. For details on the main view screen, see section 16.3. • Check marks that appear in core number cells and the pass/fail judgment result display make it easy to distinguish cores that have been measured and saved from cores that have not been measured.
- Page 162 16.1 Creating a New Project Number of Fibers or Tapes Set the number of fibers or tapes in the following range. Tape No Number of Fibers or Tapes 10 to 100 fibers (10 cores) 8 to 96 fibers (8 cores) a-b (2) 10 to 50 tapes 1 to 50 tapes...
- Page 163 16.1 Creating a New Project Multi-Core Fiber Measurement The following optical pulse measurements are possible. For details, see section 16.3. • Real-time measurement • Averaged measurement Changing Measurement and Analysis Conditions After a project setup is complete and multi-core fiber measurement is started, if measured data is already saved, changing the following measurement conditions will cause a confirmation screen for deleting the measured data to appear.
-
Page 164: Saving Screen Images
16.1 Creating a New Project Saving Project Information When you change measurement core information, measurement conditions, or analysis conditions, the project file (.MPJ extension) is overwritten. Saving Screen Images Screen images are saved to the file MultiFiberProjetInfo.BMP in the root directory of the internal memory. If the file already exists, it will be overwritten. Index 16-7 IM AQ1200-01EN... -
Page 165: Loading A Project
16.2 Loading a Project CAUTION Do not remove USB memory or turn off the power when the USB memory access indicator is blinking or when data is being saved or loaded from internal memory. Doing so may damage the storage medium (USB memory or internal memory) or corrupt its data. French ATTENTION N'enlevez pas un dispositif de mémoire USB et ne coupez pas l'alimentation électrique... - Page 166 16.3 Measuring Multi-Core Fibers Using screens and menus specific to multi-core fiber measurement, you can efficiently and completely measure multi-core fibers. WARNING • During measurement, do not remove the optical fiber cable, because light is emitted from the light source port. Visual impairment may occur if the light enters the eye. • Close the covers of any light source ports that do not have optical fiber cables connected to them. On models with two or more light source ports, visual impairment may occur if light that is mistakenly emitted from the wrong port enters the eye.
- Page 167 16.3 Measuring Multi-Core Fibers Procedure Main View Screen Using the rotary knob and ENTER, select Multi-Core Fiber Meas. The following screen appears. The last measurement project appears. If you are using this feature for the first time after purchase or if the settings have been initialized, “NewProject” will appear. “NewProject” is an empty project.
-
Page 168: Measuring Multi-Core Fibers
16.3 Measuring Multi-Core Fibers Real-time Measurement Press REAL TIME. Measurement of “Wavelength 1” begins. The screen shows the measured waveform, and the Confirm Trace menu appears. During measurement, a mark appears at the top of the display to indicate that the laser light is on. Set markers (see section 6.1). - Page 169 16.3 Measuring Multi-Core Fibers Averaged Measurement Press AVE. Averaged measurement begins. The screen shows the measured waveform, and the Confirm Trace menu appears. During measurement, a mark appears at the top of the display to indicate that the laser light is on. Set markers (see section 6.1).
- Page 170 16.3 Measuring Multi-Core Fibers • If Event Search is set to Auto, after measurement is complete, the event screen and event analysis menu appear. Confirming and Analyzing Traces Using the arrow keys or the rotary knob, move the cursor to a core number cell with a check mark or a pass/fail judgment result indication on the main view screen. The preview area at the bottom of the screen displays the measurement conditions, measurement date, and the measurement result waveform of the selected core number.
- Page 171 16.3 Measuring Multi-Core Fibers Press the Confirm Trace soft key. The waveform of the core number that is specified by the cursor appears. For the procedure, see section 6.1. For the procedure, see section 7.1. For the procedure, see section 6.6. Set the wavelength.
- Page 172 16.3 Measuring Multi-Core Fibers • When Fault Event Is On When measured data is saved, the corresponding core number in the list will display the pass/fail judgment result. If the measured value is less than or equal to the fault event threshold (greater than equal in the case of reflection), the result is pass.
- Page 173 16.3 Measuring Multi-Core Fibers Note Decompressing MPZ Files On the File menu of the AQ7932 OTDR Emulation Software (version 4.30 or later), click Batch Conversion and then MPZ. Select the source file (MPZ file) and the conversion destination. An MPJ file and SOR files will be extracted.
-
Page 174: Chapter 17 Event Mapper
Chapter 17 Event Mapper 17.1 Displaying Optical Fiber Events as Icons The Instrument is equipped with a feature that detects various events along the optical fiber route and displays them as icons. This feature works by performing an OTDR averaged measurement and then automatically performing an OTDR event analysis. - Page 175 17.1 Displaying Optical Fiber Events as Icons Setting Analysis Conditions Press SETUP and then the Analysis Setup soft key. Using the rotary knob and ENTER, set Mode to Detail or Multi WL. The following screen appears. Follow the procedure in section 3.6, “Setting Analysis Conditions.” Executing Measurements WARNING • During measurement, do not remove the optical fiber cable, because light is emitted from...
- Page 176 17.1 Displaying Optical Fiber Events as Icons Distance between events The event positions displayed on the screen is enclosed in a frame. Distance from the start point to the end point Set the displayed items to “Map.” Confirm the waveform. You can confirm the waveform of the selected event.
- Page 177 17.1 Displaying Optical Fiber Events as Icons Waveform Confirmation Screen You can view waveforms to perform detailed event analysis and edit events. Press the Confirm Trace soft key. The following screen appears. The cursor appears on the selected event on the waveform. For details on the screen, see section 7.1.
- Page 178 17.1 Displaying Optical Fiber Events as Icons • Setting the Measurement Mode and Pulse Width Press SETUP and then the Meas Setup soft key. The following screen appears. Using the rotary knob and ENTER, set the mode to FTTA. Using the rotary knob and ENTER, set the pulse width to multi pulse width. Setting the Measurement Mode (Simple, Detail, Multi WL, FTTA) The Multi WL option is not available on...
- Page 179 17.1 Displaying Optical Fiber Events as Icons Explanation Event Icon The following events are displayed as icons. The background color of icons is normally green. If the fault event display is turned on, the icon background color of fault events will be orange. For details about fault events, see section 3.6.
- Page 180 17.1 Displaying Optical Fiber Events as Icons Multi pulse width measurement This function uses multiple pulse widths to measure the same route. The following pulse widths are used. Short pulse width: The near-end side events are measured. The value is set automatically by the instrument according to the distance range (e.g., 10 ns).
- Page 181 Chapter 18 File Operation and Printing 18.1 Connecting a USB Storage Medium to the USB Port CAUTION Do not remove USB memory or turn off the power when the USB memory access indicator is blinking or when data is being saved or loaded from internal memory. Doing so may damage the storage medium (USB memory or internal memory) or corrupt its data.
-
Page 182: Saving And Loading Data
18.2 Saving and Loading Data CAUTION Do not remove USB memory or turn off the power when the USB memory access indicator is blinking or when data is being saved or loaded from internal memory. Doing so may damage the storage medium (USB memory or internal memory) or corrupt its data. French ATTENTION N'enlevez pas un dispositif de mémoire USB et ne coupez pas l'alimentation électrique... - Page 183 18.2 Saving and Loading Data When you have selected the multi-core loss test feature from the top screen or top menu Press SETUP and the File soft key. Or, press SETUP twice. The following screen appears. Folder path The number of folders and files in the selected folder Set the destination drive (internal memory, USB memory).
- Page 184 18.2 Saving and Loading Data Explanation Action Select “Save” or “Load.” The types of files that you can save are listed below. File Type Set the extension depending on the type of file that you want to save or load. Saving The types of files that you can save are listed below.
- Page 185 18.2 Saving and Loading Data • When you are using the multi-core fiber measurement feature .MPJ Project information file for multi-core measurement. For details, see section 16.1. • When you are using a feature other than the OTDR, fault-locator, or multi-core fiber measurement .CSV For details, see the table under the heading “When you are using a feature other than the .LTS OTDR, fault-locator, or multi-core fiber measurement” (previous page) under “Saving.” .CFG Drive to Save To You can set the destination drive to one of the following options.
- Page 186 18.2 Saving and Loading Data • When you are using the multi-core fiber measurement feature File Name Type of Measured Waveform Data (.SOR) On the project setup screen, select one of the following combination options (see section 16.1). • WL + No. • No. + WL • Project Name + WL + No. • No. + Project Name + WL • WL + Project Name + No. For details on the number (ID No.), see the previous table. File Name of Storage Files (.MPZ) Storage files are saved with the same name as the project name that has been assigned on the top view screen or project setup screen (see section 16.3).
- Page 187 18.2 Saving and Loading Data File List You can set items that are displayed in the file list. For details, see section 18.9. The total number of files and folders that can be displayed in the file list is 1000 (256 for the root directory).
-
Page 188: Deleting And Copying Files
18.3 Deleting and Copying Files CAUTION Do not remove USB memory or turn off the power when the USB memory access indicator is blinking or when data is being saved or loaded from internal memory. Doing so may damage the storage medium (USB memory or internal memory) or corrupt its data. French ATTENTION N'enlevez pas un dispositif de mémoire USB et ne coupez pas l'alimentation électrique... - Page 189 18.3 Deleting and Copying Files Explanation Action Select “Delete” or “Copy.” File Type The files of the type that you selected appear in the File List screen. • For details about file types, see “Explanation” in section 18.2. • To display all the files in the current folder, set the file type to “*.*”. Drive to Save To See “Explanation” in section 18.2. Selecting All Files All the files in the current folder will be deleted or copied.
-
Page 190: Changing File Names
18.4 Changing File Names CAUTION Do not remove USB memory or turn off the power when the USB memory access indicator is blinking or when data is being saved or loaded from internal memory. Doing so may damage the storage medium (USB memory or internal memory) or corrupt its data. French ATTENTION N'enlevez pas un dispositif de mémoire USB et ne coupez pas l'alimentation électrique... -
Page 191: Entering A File Name
18.4 Changing File Names Explanation Action Select “Rename.” File Type The files of the type that you selected appear in the File List screen. • For details about file types, see “Explanation” in section 18.2. • To display all the files in the current folder, set the file type to “*.*”. Drive to Save To See “Explanation” in section 18.2. Entering a File Name Enter a file name into the character input dialog box that appears. -
Page 192: Creating Folders
18.5 Creating Folders CAUTION Do not remove USB memory or turn off the power when the USB memory access indicator is blinking or when data is being saved or loaded from internal memory. Doing so may damage the storage medium (USB memory or internal memory) or corrupt its data. French ATTENTION N'enlevez pas un dispositif de mémoire USB et ne coupez pas l'alimentation électrique... - Page 193 18.5 Creating Folders Explanation Action Select “Make Folder.” Note If you create a folder deep within the folder hierarchy, you may not be able to delete or copy the folder. Drive to Save To See “Explanation” in section 18.2. Entering a Folder Name Enter a folder name into the character input dialog box that appears.
-
Page 194: Deleting And Copying Folders
18.6 Deleting and Copying Folders CAUTION Do not remove USB memory or turn off the power when the USB memory access indicator is blinking or when data is being saved or loaded from internal memory. Doing so may damage the storage medium (USB memory or internal memory) or corrupt its data. French ATTENTION N'enlevez pas un dispositif de mémoire USB et ne coupez pas l'alimentation électrique... - Page 195 18.6 Deleting and Copying Folders Explanation Action Select “DeleteFolder” or “Copy Folder.” Drive to Save To See “Explanation” in section 18.2. Deleting The selected folders are deleted. Setting the Copy Destination and Copying After selecting the folders to copy, set the destination folder and copy the selected folders to it. You cannot copy from the internal memory to the internal memory or from the USB memory to the USB memory.
-
Page 196: Initializing The Internal Memory
18.7 Initializing the Internal Memory CAUTION Do not remove USB memory or turn off the power when the USB memory access indicator is blinking or when data is being saved or loaded from internal memory. Doing so may damage the storage medium (USB memory or internal memory) or corrupt its data. French ATTENTION N'enlevez pas un dispositif de mémoire USB et ne coupez pas l'alimentation électrique... -
Page 197: Print Setup
Depending on the model and the selected feature, the operations for opening the file operation screen and the screens that appear vary. On models with the /SLT or /HLT option, you cannot print when multi-core loss testing is selected. Note • Do not connect incompatible printers. • For USB printers that have been tested for compatibility, contact your nearest YOKOGAWA dealer. Index 18-17 IM AQ1200-01EN... -
Page 198: Specifying The Items That Are Displayed In The File List
18.9 Specifying the Items That Are Displayed in the File List Procedure File List Setup Screen Press SETUP. Using the rotary knob and ENTER, select File List Setup to display the following screen. When Display is set to Default or File List Set Display to “Default”... -
Page 199: Chapter 19 Other Operations
Chapter 19 Other Operations 19.1 Configuring the Language, Beep, Start Menu, USB Function, and Screen Color Procedure System Setup Screen Press SETUP to display the following menu. Set the display language. The options that appear vary depending on the language specification. Turns the beep on and off Set the start menu (Top Menu, Last Function). -
Page 200: Configuring Power Save Settings
19.2 Configuring Power Save Settings Even when you set LCD Brightness to Off, if you press a panel key, the backlight turns on at the “Power save” brightness level. If you do not perform any operations for 5 seconds, the backlight turns off again. This feature is useful when you move the Instrument to a dark place after setting LCD Brightness to Off. -
Page 201: Resetting The Instrument To Its Factory Default Settings
19.3 Resetting the Instrument to Its Factory Default Settings Procedure Initialization Screen Press SETUP. Using the rotary knob and ENTER , select Factory Setting to display the following screen. Initializes the measurement settings All measurement settings are returned to their factory defaults. Initializes all settings All settings are returned to their factory defaults, and the internal memory is formatted. -
Page 202: Setting Operation Restrictions
19.4 Setting Operation Restrictions Procedure Operation Setup Restrictions Screen Press SETUP. Using the rotary knob and ENTER, select Operation Lock Setup to display the following screen. Displays the Operation Lock Setup screen (see step 4) Displays the Change Administrator PIN screen Changing the Administrator PIN Using the rotary knob and ENTER, select Change Administrator PIN to display the following screen. - Page 203 19.4 Setting Operation Restrictions Explanation You can restrict the following operations by requiring a PIN (password) to be entered before they can be performed. Operations That Can Be Restricted • The generation of light by the Instrument • When the OTDR feature is enabled and the REAL TIME or AVG key is pressed • When the optional light source feature is enabled(/SLT, /HLT, or /VLS) and the LS ON or VLS ON soft key is pressed.
-
Page 204: Assigning Menus Items That Are Displayed On The Top Menu
19.5 Assigning Menus Items That Are Displayed on the Top Menu You can configure the menu that appears in the top screen. Procedure Top Menu Screen Press SETUP. Using the rotary knob and ENTER, select Top Menu Func Setup to display the following screen. -
Page 205: Setting The Expiration Date
19.6 Setting the Expiration Date Procedure Expiration Date Setup Screen Press SETUP. Using the rotary knob and ENTER, select Expiration Date Setup. The following screen appears. Displaying the Date & Time Set Screen When you set the date and time, the number of remaining days until expiration is displayed. - Page 206 If you forget the release number, you will not be able to release the expiration date settings. The release number cannot be initialized. Be sure to manage the release number carefully. If you forget the release number, contact your nearest YOKOGAWA dealer. 19-8...
- Page 207 19.6 Setting the Expiration Date Explanation This feature displays a message at startup or locks the instrument when the specified expiration date arrives. You can display a message that urges you to calibrate the instrument or the like when the recommended calibration period elapses.
-
Page 208: Configuring Network Settings (Option)
19.7 Configuring Network Settings (Option) Procedure Network Setup Screen Press SETUP. Using the rotary knob and ENTER , select Network Setup to display the following screen. Enables or disables the network setup Set the user name and password. To set the user name and password, follow the procedure in section 2.4. Set the timeout value. - Page 209 19.7 Configuring Network Settings (Option) Timeout Value The connection to the network is automatically disconnected if there is no access to the Instrument for the specified time. Range: 1 to 3600 s or Infinite The Instrument will not time out if you set the timeout value to Infinite. If the Instrument is connected to a network and the connection between the Instrument and another device is broken abnormally due to an external cause, the Instrument will remain connected to the network until the power is turned off.
-
Page 210: Chapter 20 Troubleshooting, Maintenance, And Inspection
20.1 If a Problem Occurs Dealing with Unusual Circumstances • If a message appears on the screen, see the following pages for reference. • If servicing is necessary or the AQ1200x/AQ1205x does not operate properly even after you have attempted to deal with the problem according to the instructions in this section, contact your nearest YOKOGAWA dealer. Symptom Solution Reference Even when the power is If you are using an AC adapter, make sure that the plug is connected firmly to the outlet, —... -
Page 211: Error Messages
Cannot save onto the media. This media is for read-only. 602, 603 Can not recognize file system. - Internal memory:Contact Yokogawa’s representatives. - USB memory:Try the other media or format again with FAT. Storage media has been disconnected while the media is being accessed. - Page 212 FAT. Cannot save onto the media. This media is for read-only. 617 to 619 Can not recognize file system. - Internal memory:Contact Yokogawa’s representatives. - USB memory:Try the other media or format again with FAT.
- Page 213 No paper (USB printer) USB printer cannot be found. Perform the power cycle. The printer is out of order, and needs to be repaired. Please contact Yokogawa’s representatives. Event list cannot be printed because event analysis is not performed. Cannot execute it while printing.
- Page 214 20.2 Error Messages Code Message Errors in the battery or in the charging circuit. The instrument may be damaged if it is kept using in this condition. The instrument will be powered off in 10 sec. Please remove the battery and use AC adapter. Battery temperature is too high.
-
Page 215: Viewing The Product Information
20.3 Viewing the Product Information Procedure Product Information Screen Press SETUP and then the Product Info. soft key to display the following screen. Saves a screen image Explanation The following information about the Instrument is displayed. Model Name, Serial Number, Suffix Code, Mac Address, Version Information, etc. Executing Screen Image Save When you execute Screen Image Save, an image of the screen is saved to SystemInfo.BMP in the root directory of the internal memory. - Page 216 If the results of the self test are normal, “Test succeeded” appears. If an error occurs, “Test Error occurred” appears. When an Error Occurs during a Self Test If an error occurs, contact your nearest YOKOGAWA dealer. Index 20-7 IM AQ1200-01EN...
-
Page 217: Updating The Firmware
20.5 Updating the Firmware Procedure Version Up Screen Press SETUP and then the Version Up soft key to display the following screen. Select the drive that contains the firmware update file (internal memory, USB memory). Using the rotary knob and ENTER, select the firmware update file. -
Page 218: Backing Up Necessary Files To A Pc And Initializing The Internal Memory
20.6 Backing Up Necessary Files to a PC and Initializing the Internal Memory (Firmware version 1.12 and later) If an improper file operation indicated below takes place, the Instrument may not be able to start correctly, and a message that prompts you to initialize the internal memory may appear. Improper File Operations • Saving files to folders other than the AQ1200x/AQ1205x’s DATA folder • Manipulating (creating, deleting, or renaming) folders on the Instrument from a PC. -
Page 219: Performing A Mechanical Inspection And Checking Operations
Make sure that: • There is no external damage or deformation on the outside of the Instrument. • There are no switches, connectors, or other components that are loose. • All switches and moving parts can be operated smoothly. If there are any problems, contact your nearest YOKOGAWA dealer. Checking Operations Turn on the Instrument, perform the typical operations, and make sure that the Instrument performs normally. 20-10... -
Page 220: Replacing The Battery Pack
• Leakage from the battery pack can cause blindness if it comes into contact with your eyes. If you get leakage from the battery in your eyes, do not rub them; clean them thoroughly with clean water and then see a doctor immediately. • Do not use or charge battery packs with the Instrument that are not made by YOKOGAWA. • When you attach the battery pack to the Instrument, attach it properly. Prohibitions against Careless Use • Keep the battery pack away from infants so that they do not lick it, put it in their mouths, bite it, or do other dangerous things with it. - Page 221 20.8 Replacing the Battery Pack Storage Precautions • If you will not be using the battery pack for an extended period of time, remove it from the Instrument and store it in a dry place. • Avoid storing the battery pack for an extended period of time when it is fully charged (after it has just been charged) or when it has no power left (when the Instrument will not turn on). Storing the battery pack under these conditions will degrade its performance and reduce its longevity. It is better to store the battery pack when it is 40 to 50% charged. This is equivalent to the state the battery is in after you turn off the Instrument and charge an empty battery for an hour at room temperature.
- Page 222 Il est préférable de stocker le pack de piles lorsqu'il est chargé à 40 ou 50 %. Cela équivaut à l'état des piles une fois que le dispositif AQ1200x/AQ1205x a été éteint et qu'une pile vide est chargée pendant une 1 heures et demi à température ambiante. Mise au rebut • Lors de la mise au rebut des piles, suivre les règlementations adaptées de mise au rebut telles qu'elles sont spécifiées dans l'ordonnance correspondante locale. • Lors de la mise au rebut des piles dans la Communauté européenne, suivre la directive relative aux déchets d'équipements électriques et électroniques. Contact your nearest YOKOGAWA dealer under the following circumstances. • When the battery pack is broken or behaves strangely. • When the battery run time becomes short and the battery pack needs to be replaced (the battery pack is a consumable item). Index 20-13 IM AQ1200-01EN...
- Page 223 20.8 Replacing the Battery Pack Removing the Battery Pack Before you remove the battery, turn off the power and unplug the AC adapter from the Instrument. Unlock the battery cover on the Instrument rear panel. Insert a coin or screwdriver with a thickness that will not damage the lock slot into the lock slot, and release the lock.
- Page 224 Battery low Note • The Instrument will turn off automatically a few minutes after the warning message about the remaining battery power appears. • If the battery pack is hot, wait for it to return to room temperature before you charge it. • The battery run time depends on how you use the Instrument: whether or not you make the screen bright, use the printer, etc. • If battery charging does not start, the CHARGE lamp turns off. Check that the battery pack is properly installed. If the battery pack is properly installed but fails to be charged, contact your nearest Yokogawa dealer. Index 20-15 IM AQ1200-01EN...
-
Page 225: Replacing An Optical Adapter
20.9 Replacing an Optical Adapter WARNING When you replace an optical adapter, turn the Instrument power off so that you do not accidentally emit light from the light source port. If you replace an optical adapter (universal or connector adapter) while the power is on, you may accidentally get light in your eyes, damage them, and impair your vision. - Page 226 20.9 Replacing an Optical Adapter Attachment Make sure that the Instrument power is off. Open the optical port cover. Insert the optical adapter directly into the rear shell. Pull the optical adapter lock lever down and outwards to lock it. If the adapter is screwed in, turn the knob to the right to tighten it.
-
Page 227: Routine Maintenance
20.10 Routine Maintenance Cleaning the Outside of the AQ1200x/AQ1205x To clean the LCD and the outside of the Instrument, turn off the power; remove the power cord from the outlet; use a damp, well-wrung cloth to wipe the LCD and the outside of the Instrument; and then wipe them off with a dry cloth. - Page 228 20.10 Routine Maintenance Note • Clean the optical components using a smooth lens cleaner that will not leave lint or dust on the lenses. • You can clean the light source ports without removing the optical adapters by using a stick-shaped cleaning tool, but we recommend that you remove the optical adapters when you clean. Index 20-19 IM AQ1200-01EN...
-
Page 229: Storage Precautions
20.11 Storage Precautions Before You Store the AQ1200x/AQ1205x Clean the Instrument before you store it. For information about cleaning, see section 20.10. Storage Conditions Store the Instrument in a place that meets the following conditions. • Within the storage temperature and humidity ranges • Subject to very little change in temperature and humidity within a single day • Not subject to direct sunlight • Not dusty • Free from activated gas Note... -
Page 230: Recommended Replacement Parts
20.12 Recommended Replacement Parts For part replacement, contact your nearest YOKOGAWA dealer. Parts with Limited Service Lives Part Name Service Life Notes Battery pack Approx. 300 charges The service life varies depending on the environment in which the battery pack is used. -
Page 231: Calibration
20.13 Calibration Periodic calibration is an effective means of keeping the instrument performing correctly for a long time and of detecting malfunctions at an early stage. We recommend that you have the Instrument calibrated once a year. 20-22 IM AQ1200-01EN... -
Page 232: Appendix
Appendix Appendix 1 Data File Formats CSV File Formats The following examples show the saved data being displayed in a spreadsheet program. Optical Pulse Measurement (OTDR) Waveform Data Optical Pulse Measurement (OTDR) Event Data Index App-1 IM AQ1200-01EN... -
Page 233: Appendix 1 Data File Formats
Appendix 1 Data File Formats Optical Power Meter Logging Results Measured Data from the Optical Power Meter Loss Test Results App-2 IM AQ1200-01EN... -
Page 234: Index App
Appendix 1 Data File Formats Project Information (multi-core loss testing) Index App-3 IM AQ1200-01EN... - Page 235 Index Symbols copying ..............18-9, 18-15 Page core list ..................9-11 .BMP ..................18-4 core, starting number............9-12 .CFG ..................18-4 CSV file formats..............App-1 .CSV ..................18-4 cumulate loss................7-2 .JPG..................18-4 cursor, amount of movement ..........6-1 .LTS ..................18-4 cursor dB value............... 5-8 <...
- Page 236 Index fiber-in-use................1-4 marker ..................5-8 fiber-in-use alarm..............3-11 marker auto setup..............6-19 file formats ................App-1 marker information..............5-10 file list.................. 18-18 marker R ................. 6-9 file name ................18-5 markers, displaying............6-2, file names, changing............18-10 master................... 1-15 files, copying ................. 18-8 maximum and minimum value display........
-
Page 237: Recommended Replacement Parts
Index projects, sharing (multi-core loss testing) ......12-3 Page pulse light output level ............3-17 unit ..................9-3 pulse width............... 1-7, updating ................20-8 USB function................. 19-1 Page USB port (Type A)..............18-1 real-time measurement (OTDR) ........1-4, user name................19-10 real-time measuremet (multi-core fiber measurement) ..16-11 recommended replacement parts ........
Need help?
Do you have a question about the AQ1200A and is the answer not in the manual?
Questions and answers