Table of Contents
Advertisement
Quick Links
Advertisement
Table of Contents

Related Manuals for multicomp pro MP720013


Summary of Contents for multicomp pro MP720013
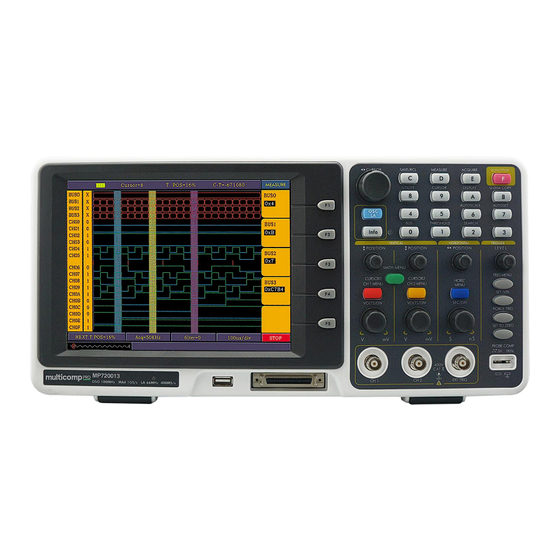
- Page 1 Digital Storage Oscilloscope Model MP720013...
-
Page 2: Table Of Contents
Table of Contents 1. General Safety Requirements ..................1 2. Safety Terms and Symbols ....................2 3. General Characteristics ....................4 4. Junior User Guidebook ....................5 4.1 Introduction to the Front Panel and the User's Interface ..........6 Front panel ............................... 6 Control(key and rotary control) area ...................... - Page 3 How to Implement the Auxiliary System Function Setting ..............53 How to Implement the Automatic Measurement ................... 54 How to Implement the Cursor Measurement ..................57 How to use Autoscale ..........................61 How to Use Executive Buttons....................... 62 5.2 Logic analyzer ........................68 How to set sampling system ........................
-
Page 4: General Safety Requirements
User Manual 1. General Safety Requirements Before any operations, please read the following safety precautions to avoid any possible bodily injury and prevent this product or any other products connected from damage. In order to avoid any contingent danger, this product is only used within the range specified. -
Page 5: Safety Terms And Symbols
User Manual 2. Safety Terms and Symbols Safety Terms Terms in this manual. The following terms may appear in this manual: Warning: Warning indicates the conditions or practices that could result in injury or loss of life. Caution: Caution indicates the conditions or practices that could result in damage to this product or other property. - Page 6 User Manual Warning The channels should adopt common basis during measuring. To prevent short circuits, the 2 probe ground must not be connected to 2 different non-isolated DC level. The diagram of the oscilloscope ground wire connection: Probe Oscilloscope Electrical Outlet Signal Input Power Cord Ground Clip...
-
Page 7: General Characteristics
3. General Characteristics Digital Storage Oscilloscope Model Bandwidth Sample Rate MP720013 100MHz 1GS/s half channel*, 500MS/s each channel Dual channel, 2M points on each channel for the Record length; Reading-out with the cursor; Twenty automatic measurement functions;... -
Page 8: Junior User Guidebook
User Manual 4. Basic User Guides This chapter deals with the following topics mainly: Digital Storage Oscilloscope Introduction to the front panel and the user's interface of the MSO series oscilloscope How to implement the general inspection How to implement the function inspection ... -
Page 9: Introduction To The Front Panel And The User's Interface
User Manual 4.1 Introduction to the Front Panel and the User's Interface When you get a new-type oscilloscope, you should get acquainted with its front panel at first and the MSO series mixed digital storage oscilloscope is no exception. This chapter makes a simple description of the operation and function of the front panel of the MSO series mixed oscilloscope, enabling you to be familiar with the use of the MSO series mixed oscilloscope in the shortest time. -
Page 10: Control(Key And Rotary Control) Area
User Manual Control(key and rotary control) area Fig. 4-2 Keys Overview 1. Menu option setting: F1~F5 2. Switch Switch includes two keys and one rotary control. Press "OSC/LA" to switch between DSO and LA. For DSO "cursor" rotary control and "info" key are idle. But the "cursor" rotary control takes effect in magnifying or minifying the waveform after FFT operation when the mode is FFT. - Page 11 User Manual For LA, "CH1 menu", "CH2 menu", "Wave math" keys and "CH2 Volts/Div" rotary control are idle. "CH1 Vertical", "CH2 Vertical" to adjust the M1, M2 position in Cursor menu when cursor display is on "CH1 Volts/Div". 5. Horizontal control area with 2 rotary control and 1 key. For DSO, "Horizontal position"...
-
Page 12: Digital Storage Oscilloscope
User Manual 4.2 Digital Storage Oscilloscope User interface introduction Fig. 4-3 Illustrative Drawing of Display Interfaces The Trigger State indicates the following information: Auto: The oscilloscope is under the Automatic mode and is collecting the waveform under the non-trigger state. Trig' d: The oscilloscope has already detected a trigger signal and is collecting the after-triggering information. - Page 13 User Manual This reading shows the time deviation between the horizontal trigger position and the window center line, which is regarded as 0 in the window center. It indicates the current function menu. It indicates the operation options for the current function menu, which changes with the function menus.
-
Page 14: How To Implement The General Inspection
User Manual waveform of the CH1 channel. If the pointer is not displayed, it shows that the channel is not opened. 22. The positions of two purple dotted line cursors measurements. 23. The reading shows the frequency of the two channels. It is a 6 digits cymometer. Its measurement range of frequency is 2Hz to full bandwidth. -
Page 15: How To Implement The Probe Compensation
User Manual 3. Press the "7(AUTOSET)" Button. The square wave of 1 KHz frequency and 5V peak-peak value will be displayed in several seconds (see Fig. 4-4). Fig.4-4 Auto set Check CH2 by repeating Step 2 and Step 3. How to Implement the Probe Compensation When connect the probe with any input channel for the first time, make this adjustment to match the probe with the input channel. -
Page 16: How To Set The Probe Attenuation Coefficient
User Manual Fig. 4-5 Displayed Wave Forms of the Probe Compensation Repeat the steps mentioned if necessary. Fig. 4-6 Adjust Probe How to Set the Probe Attenuation Coefficient The probe has several attenuation coefficients, which will influence the vertical scale factor of the oscilloscope. -
Page 17: How To Implement Auto-Calibration
User Manual Fig. 4-8 Finger Guard Warning: In order to avoid suffering from the electric shock, please keep your finger behind the safety guard ring of the probe body during the operation. In order to protect you from suffering from the electric shock during your using the probe, do not touch the metal part of the probe tip when the probe is connected to the power supply. - Page 18 User Manual Fig. 4-9 Vertical Control Zone Use the button "VERTICAL POSITION" rotary control to show the signal in the center of the waveform window. The "VERTICAL POSITION" rotary control functions the regulating of the vertical display position of the signal. Thus, when the "VERTICAL POSITION"...
-
Page 19: Introduction To The Horizontal System
User Manual Introduction to the Horizontal System Shown as Fig.4-10, there are a button and two rotary controls in the "HORIZONTAL CONTROLS". The following practices will gradually direct you to be familiar with the setting of horizontal time base. Fig. 4-10 Horizontal Control Zone Use the horizontal "SEC/DIV"... - Page 20 User Manual Fig.4-11 Trigger Control Zone Press the "TRIG MENU" button and call out the trigger menu. With the operations of the 5 menu selection buttons, the trigger setting can be changed. Use the "LEVEL" rotary control to change the trigger level setting. With the rotation of the "LEVEL"...
-
Page 21: Logic Analyzer
User Manual 4.3 Logic Analyzer LA input connection Insert the plug of OL-16 LA module 50P into the LA signal input on front panel and fix two screw. Then 16 channel clamp of OL-16 LA connect to target signal and ready for measurement User interface introduction Fig.4-12:User interface of logic analyzer... -
Page 22: How To Acquire Data
User Manual detected and wait for sample finished. "STOP" for sampling finished. 12、Value indicate current time base. 13、Info windows: different operation display different info. 14、Value display current filter modulus setting. 15、Value display current sample rate setting. 16、Two purple lines for cursor 1 and cursor 2 in cursor measurement. 17、Percentage value indicate trigger position for next sampling in storage area. -
Page 23: Display Systems
User Manual Display systems We need only three channels as what we measure is 3 signals. And other channel and bus can be off. In this way the display resolution in using channel will be increased. Display system mainly to set on/off for measure channel. We use CH00、CH01、 CH02 as measure channel correspond to signal enable, clock, data accordingly. -
Page 24: Trigger System
User Manual Fig.4-14 Fig. 4-15 Trigger system LA is same as DSO and need to make trigger to synchronize data. The trigger system mainly to set trigger sources, trigger mode and trigger position. We make CH00 as trigger source and trigger mode as falling edge, trigger position in 50%. -
Page 25: Threshold Voltage System
User Manual Fig. 4-16 Threshold voltage system Threshold voltage system is to set high/low of the trigger voltage. The system already fixed the setting for normal logic voltage as CMOS, LVMOS etc. And you can set any trigger voltage using custom setting. The signal voltage is 3.3V and we set threshold voltage as "LVCMO3.3/1.7V"... - Page 26 User Manual Fig.4-18 There is an importance compromise between recorded signal resolution and its continuance (relate to time). The sample memory depth of LA is fixed and once adding sample rate then resolution will get better accordingly. But it will decrease the continuance for acquire signal.
- Page 27 User Manual Fig. 4-19...
-
Page 28: Advanced User Guidebook
User Manual 5. Advanced User Guidebook Up till now, you have already been familiar with the initial operations of the functions of the function areas, buttons and rotary controls in the front panel of the MSO series oscilloscope. Based the introduction of the previous Chapter, the user should have an intimate knowledge of the determination of the change of the oscilloscope setting through observing the status bar. -
Page 29: Digital Storage Oscilloscope
User Manual How to set Utility It is recommended that you read this chapter carefully to get acquainted the various measurement functions and other operation methods of the MSO series oscilloscope. 5.1 Digital Storage Oscilloscope How to Set the Vertical System The VERTICAL CONTROLS includes three menu buttons such as CH1 MENU, CH2 MENU and MATH MENU, and four rotary controls such as VERTICA POSITION, VOLTS/DIV (one group for each of the two channels). - Page 30 User Manual from input signal. See Fig.5-2. Press F1 again to set "DC" mode, both AC and DC components get passed. See Fig.5-3. The wave forms are shown as Fig.5-2 and Fig.5-3. Fig. 5-2 AC Coupling Oscillogram Fig. 5-3 DC Coupling Oscillogram Setting the "Band Limit"...
- Page 31 User Manual Setting the Channel "ON/OFF" Taking the Channel 1 for example, the operation steps are shown as below: (1). Press the CH1 MENU button and call out the CH1 SETUP menu. (2). Press the F3 menu selection button and select the Channel as OFF, with Channel 1 switched off.
- Page 32 User Manual Fig. 5-5 Regulation of the Attenuation Ratio of the Probe A List of the Attenuation Coefficient of Probes and the Corresponding Menu Settings: Attenuation Coefficient of the Probe Corresponding Menu Setting 10:1 100:1 100X 1000:1 1000X Setting of Wave Form Inverted Wave form inverted: the displayed signal is turned 180 degrees against the phase of the earth potential.
-
Page 33: Implementation Of Mathematical Manipulation Function
User Manual Implementation of Mathematical Manipulation Function The Mathematical Manipulation function is used to show the results of the additive,multiplication, division and subtraction operations between Channel 1 and Channel 2, and the FFT operation of CH1 or CH2 . The corresponding FCL (Functional Capabilities List) of the Wave Form Calculation Setting Description... - Page 34 User Manual Function Menu Setting Instruction Turn on FFT function. Turn off FFT function. DO FFT on Channel l Source DO FFT on Channel 2 Rectangle Blackman Window Type of window for FFT. Hanning Hamming Display in dB Format Vrms Display in Vrms multiple *1 multiple *2...
- Page 35 User Manual to select the best window. Type Description Window This is the best type of window for resolving frequencies that are very close to the same value but worst for accurately measuring the amplitude of those frequencies. It is the best type for measuring the frequency spectrum of non-repetitive signals and measuring frequency components near DC.
- Page 36 User Manual Fig.5-9. Blackman window Fig.5-10 Hamming window Fig.5-11. Rectangle window...
- Page 37 User Manual Fig.5-12 Hanning window Quick Tips If desired, use the zoom feature to magnify the FFT waveform. Use the default dBV RMS scale to see a detailed view of multiple frequencies, even if they have very different amplitudes. Use the linear RMS scale to see an overall view of how all frequencies compare to each other.
-
Page 38: Application Of Vertical Position And Volts/Div Rotary Controls
User Manual Application of VERTICAL POSITION and VOLTS/DIV Rotary controls The .VERTIVAL POSITION rotary control is used to adjust the vertical positions of the wave forms of all Channels (including those resulted from the mathematical operation). The analytic resolution of this control rotary control changes with the vertical division. - Page 39 User Manual Function Menu Setting Description The setting of the horizontal main time Main Time Base base is used to display the wave form. A window area is defined by two Set Window cursors. The defined window area for display is Zone Window expanded to the full screen.
- Page 40 User Manual Fig. 5-16 Window Setting Fig. 5-17 Set Window disable under FFT mode Zone Window Press the F3 menu selection button and choose Zone Window. As a result, the window area defined by two cursors will be expanded to the full screen size (see Fig. 5-18). Fig.
-
Page 41: How To Set Trigger System
User Manual How to set trigger system When the oscilloscope begins to collect the data and display the wave form depends on a trigger. Once it is set correctly, the trigger can transfer the unstable display into a meaningful wave form. When beginning to collect data, the oscilloscope will collect adequate data to draw the wave form at the left side of the trigger point at first. - Page 42 User Manual Under the Edge Trigger mode, a trigger happens in the trigger threshold value of the input signal edge. When the Edge Trigger is selected, a trigger will occur in the rising or falling edge of the input signal. The Edge Trigger Menu is shown as Fig.5-19 Fig.
- Page 43 User Manual Fig. 5-20 Video trigger menu Video menu list MENU SETTING INSTRUCTION Channel 1 as the trigger source. Channel 2 as the trigger source. Source Use external source. EXT/5 1/5 of the External Trigger Source for increasing range of level. Mode Video Trigger the time base on the line of input video signal.
- Page 44 User Manual Fig. 5-21 Pulse Width Trigger menu Pulse Width Trigger menu list MENU SETTING INSTRUCTION Channel 1 as the trigger source. Source Channel 2 as the trigger source. Mode Pulse (+pulse width less than ) (+pulse width more than ) (+Pulse width equal to) when To select pulse width condition...
- Page 45 User Manual Fig. 5-22 The Slope Trigger Menu is shown as Fig. 5-22 Slope Trigger menu Slope Trigger menu list MENU SETTING INSTRUCTION Channel 1 as the trigger source. Source Channel 2 as the trigger source. Mode Slope Set slope condition When Settings 24ns~10s...
- Page 46 User Manual Alternate trigger(Trigger Type: Edge) Fig.5-23 Menu is shown as Fig.5-23 Alternate trigger(Trigger Type: Edge) Menu Alternate trigger(Trigger Type: Edge) list: Menu MENU SETTING INSTRUCTION Channel 1 as the trigger source. Source Channel 2 as the trigger source. Mode Edge Set vertical channel trigger type for edge trigger.
- Page 47 User Manual Fig.5-24 Alternate trigger(Trigger Type: video) Menu Alternate trigger(Trigger Type: video) list: Menu MENU SETTING INSTRUCTION Channel 1 as the trigger source. Channel 2 as the trigger source. Source Use external source. EXT/5 1/5 of the External Trigger Source for increasing range of level. Mode Video Trigger the time base on the line of input video signal.
- Page 48 User Manual Turn "TRIG LEVEL" rotary control to 24ns~10s settings set time Block the direct current component. Unblock all components. Block the high-frequency signal and only Coupling unblock the low-frequency component. Block the low-frequency signal and only unblock the high -frequency component. Set interval by using TRIG LEVEL Holdoff 100ns~10s...
- Page 49 User Manual Unblock all components. Block the high-frequency signal and only unblock the low-frequency component. Block the low-frequency signal and only unblock the high -frequency component. 100ns~ Set interval by using TRIG LEVEL control, value range Holdoff from 100ns~10s. Holdoff Reset hold time to default value (100ns).
-
Page 50: How To Operate The Function Menu
User Manual LF Reject: LF Reject coupling blocks DC component, and attenuates all signal with a frequency lower than 8 kHz. HF Reject: HF Reject coupling attenuates all signals with a frequency higher than 150 kHz. 4. Holdoff: A time interval before the oscilloscope responses to next trigger signal. During this Holdoff period, the trigger system becomes "blind"... -
Page 51: How To Set The Display System
User Manual Fig.5-28 Peak Detect mode Fig.5-29 Common ACQU Mode display, in which no burr can be detected. Fig.5-30 Average on with reduced noise on waveform How to Set the Display System Push down the DISPLAY button and the menu displayed in the screen is shown as Fig.5-31. - Page 52 User Manual Set Menu Press F1 next to Type to change from Vectors to Dots. Fig.5-32 and Fig.5-33 show waveform in different type. Fig.5-32 Display in the Vector Form Fig.5-33 Display in Dots form Persist When the Persist function is used, the persistence display effect of the picture tube oscilloscope can be simulated: the reserved original data is displayed in fade colour and the new data is in bright colour.
- Page 53 User Manual Fig.5-34 Infinite Persistence Display XY Format This format is only applicable to Channel 1 and Channel 2. After the XY display format is selected, Channel 1 is displayed in the horizontal axis and Channel 2 in the vertical axis; the oscilloscope is set in the un-triggered sample mode: the data are displayed as bright spots and the sampling rate is 1MS/s and can not be changed.
-
Page 54: How To Save And Recall A Wave Form
User Manual Fig.5-35 Display in XY Format At the mode of FFT, if switching YT to XY, "FFT MODE is unavailable" prompts as Fig.5-36 Fig.5-36 FFT mode XY Format Disable How to Save and Recall a Wave Form Press the SAVE/RCL button, you can save and call out the waveforms in the instrument. - Page 55 User Manual Save a waveform A sine wave form input CH1. Follow these steps to save waveform from CH1. Under WAVE SAVE MENU, press F1 next to Source to select CH1. Press F2 next to WAVE to assign Location A for this waveform. ...
-
Page 56: How To Implement The Auxiliary System Function Setting
User Manual How to Implement the Auxiliary System Function Setting Press the UNTILITY button and the menu is displayed in the screen as Fig.5-40. Function Menu Setting Description System Status Display the system function menu. Recall Factory Call out the factory settings. Do Self Cal Carry out the self-calibration procedure. -
Page 57: How To Implement The Automatic Measurement
User Manual Function Menu Setting Description Horizontal Show the horizontal parameter of the channel. Vertical Show the vertical parameter of the channel. Trigger Show the parameters of the trigger system. Misc Show the serial number and edition number. Fig.5-41 SYS STAT Menu After entering into the SYS STAT menu, choose the corresponding function, with the corresponding parameters shown in the screen. - Page 58 User Manual Overshoot, Preshoot, RiseTime, Fall Time, +Width, -Width, +Duty, -Duty, Delay A→B and Delay A→B . To use Measure, simply Press Measure button would activate MEASURE menu. Press F1 next to Source/Type to allow you to switch between Source and Type. Source is the signal from the channel which user to carry out a measurement, and Type is one of the 20 measurements user wants Oscilloscope to work out.
- Page 59 User Manual Average The arithmetic mean over the entire waveform. Vrms The true Root Mean Square voltage over the entire waveform. Time that the leading edge of the first pulse in the waveform takes to rise Rise Time from 10% to 90% of its amplitude. Time that the falling edge of the first pulse in the waveform takes to fall Fall Time from 90% to 10% of its amplitude.
-
Page 60: How To Implement The Cursor Measurement
User Manual Fig.5-44 Automatic Measurement How to Implement the Cursor Measurement Press the CURSOR button to display the cursor measurement function menu (CURS MEAS) in the screen. The Cursor Measurement for normal model: The cursor measurement includes Voltage Measurement and Time Measurement at normal model, shown as Fig.5-45. - Page 61 User Manual Reading of Cursor 1. Cursor 1 Time: read time from start position-the horizontal trigger point (0s). Voltage: read voltage from ground level (0 v). Read the position of Cursor 1 (the Time is read with Cursor 2 reference to the horizontal trigger position and the Voltage is to the ground point).
- Page 62 User Manual Fig.5-47 Wave Form of Cursor Measurement The Cursor Measurement for FFT model: Press the CURSOR button to display the cursor measurement function menu (CURS MEAS) in the screen, which includes Vamp Measurement and Freq Measurement at the mode of FFT, shown as Fig.5-48. Fig.5-48 CURS MEAS Menu The description of the cursor measurement menu is shown as the following table:...
- Page 63 User Manual When carrying out the cursor measurement, the position of Cursor 1 can be adjusted with the CURSOR1 (VERTICAL POSITION) rotary control of Channel 1, and that of Cursor 2 can be adjusted with the CURSOR2 (VERTICAL POSITION) rotary control of Channel 2.
-
Page 64: How To Use Autoscale
User Manual Fig.5-50 wave of Freq cursor measurement How to use Autoscale The function is applied to follow-up signals automatically even if the signals change at any time. Autoscale enables the instrument to set up trigger mode, voltage division and time scale automatically according to the type, amplitude and frequency of the signals. -
Page 65: How To Use Executive Buttons
User Manual : Multi cycles mode single cycle mode Fig.5-51 Note: Things you should be ware when turning on Autoscale. 1. The symbol is flickering on the top left corner of screen every half second. 2. The oscilloscope is setting Triggers automatically for the incoming signal based on its best approach. - Page 66 User Manual Horizontal Sale Adjust to the proper division Trigger Type Current Trigger Source Show the minimum number of channels. Trigger Coupling Current Trigger Slope Current Trigger Level Mid-point Setting Trigger Mode Auto Display Format RUN/STOP Enable or disable sampling on input signals. Notes: When there is no sampling at STOP state, user is still able to change vertical division or time base for waveform within a certain range.
- Page 67 User Manual Figure: Disk Management of computer 4. Right click 1 or 2 red mark area, choose Format. And system will pop up a warning message, click Yes. Figure: Format the USB disk warning 5. Set File System FAT32, Allocation unit size 4096. Check "Perform a quick format" to execute a quick format.
- Page 68 User Manual 6. Formatting process. Figure: Formatting the USB disk Check whether the USB disk is FAT32 with allocation unit size 4096 after formatting. Use Minitool Partition Wizard to format Download URL: http://www.partitionwizard.com/free-partition-manager.html Tip: There are many tools for the USB disk formatting on the market, just take Minitool Partition Wizard for example here.
- Page 69 User Manual Figure: Reload Disk 4. Right click 1 or 2 red mark area, choose Format. Figure: Choose format 5. Set File System FAT32, Cluster size 4096. Click OK. Figure: Format setting 6. Click Apply at the top left of the menu. Then click Yes on the pop-up warning to begin formatting.
- Page 70 User Manual Figure: Apply setting 7. Formatting process Figure: Format process Format the USB disk successfully Figure: Format successfully...
-
Page 71: Logic Analyzer
User Manual 5.2 Logic analyzer How to set sampling system Sampling system is to set sample rate, storage depth and filter. Different sampling setting will result in different measure results. In the same storage depth, the higher sample rate set, the shorter the continuance time for signal will be. If the sample rate set too low, narrower pulse signal may get lost. - Page 72 User Manual Listing of corresponding continuance time to different sample rate and storage depth: Sample Continuance Sample Continuance Storage depth Storage depth rate time rate time Low memory 160 ms 1GHz Low memory 16us 100kHz General 2.56 s Deep memory 40 s Low memory 320 ms...
-
Page 73: How To Set Trigger System
User Manual 3. Press "F2" till storage depth display as "Deep Memory". 4. Press "F3" till digital filter display as "None". Then sample system setting finished (refer to Fig.5-53 Fig.5-53: Sampling setting How to set trigger system Trigger system including "Trigger level" adjust rotary control, "Trigger menu", "SET 50%", "Set to Zero". - Page 74 User Manual Function Settings Instructions Signal choice CH00~CH0F CH00-CH0F can be set as trigger resource Rising Trigger on the rising edge. Slope Falling Trigger on the falling edge. Either Trigger either on rising edge or falling edge. For example: to measure a 3 lines SPI signal which includes enable, clock and data. The data get into effective when enable is low voltage.
- Page 75 User Manual :Bus trigger menu Fig.5-56 Bus trigger menu as below: Function Setting Instruction Source BUS0~BUS3 BUS0 to BUS3 can be set as trigger source 0x0000~0xffff Can be set discretionarily between 0x0000 and 0xffff (HEX) (HEX) Code 0~65535 or between 0 and 65535 (DEC)according to the bus and (DEC)...
- Page 76 User Manual :Bus trigger Fig.5-57 3. Pattern trigger: Set channel as signal source and make high/low voltage for channel as trigger condition combination to get trigger (refer to Fig.5-58 :Pattern trigger menu Fig.5-58 Pattern trigger menu as below: Function Setting Instruction CH00~CH0F Select the channel to set signal pattern.
- Page 77 User Manual Don't Care No trigger occurs. CH00~CH0F Trigger occur when signal on the low level High Trigger occurs when signal on the high level. To observe the 16 channel data need to know how data changed before and after when "BIT0-BIT3"...
- Page 78 User Manual :Sequential queue trigger Fig.5-60 Sequential queue trigger function as below: Function Setting Instruction Source BUS0~BUS3 Select the trigger source from BUS0~BUS3 0x0000~0xffff Can be set discretionarily between 0x0000 and 0xffff (HEX) (HEX) Code 0~65535 or between 0 and 65535 (DEC)according to the bus (DEC)...
- Page 79 User Manual Then sequential queue trigger setting finished (refer to ) and data ready for Fig.5-61 acquisition. :Sequential queue trigger Fig.5-61 5. Distributed queue trigger: make BUS as trigger source and dis-continuous setting data in BUS as trigger condition to generate trigger and also can set 8 data at the same time. Distributed queue trigger menu refer as Fig.5-62 :Distributed queue trigger menu...
- Page 80 User Manual (DEC) Add the code type to the queue Delete Delete the code type from the queue Setting operation are same as sequential trigger setting. :Distributed queue trigger Fig.5-63 6、Data width queue trigger: Make BUS as trigger source and continuous duration in BUS as trigger condition to generate trigger.
-
Page 81: How To Set Threshold
User Manual The duration width can be set from 10ns (1-2-5) to Duration 10ns~50s 10.00us (1-2-5) according to the sampling rate from high to low. >= Trigger occur on condition that the bus value is equal to the code type and the duration is more than or equal to the duration width. - Page 82 User Manual measurement. For example, if measure signal is LVCMOS1.8V and set threshold as "CMOS/ ( 2.5V)" then all the measurement data will become "0". Threshold setting menu refer to Fig.5-66 : Threshold setting menu Fig.5-66 Threshold menu function as below Function Setting Instruction...
-
Page 83: How To Set Display System
User Manual Threshold voltage setting finished (refer to Fig.5-67 Fig.5-67:Threshold custom setting How to set display system Display system is to set on/off for channel and BUS, also to adjust the contrast of panel display. Press "A(DISPLAY)" and panel display as Fig.5-68 :Display menu Fig.5-68... -
Page 84: How To Set Bus
User Manual BUS or Channel on display Bus or Channel off contrast Increase panel display contrast Increase contrast Decrease panel display contrast Decrease For example, display channel as CH00~CH03 and BUS as BUS0, other channels and BUS all off. Follow up below steps: 1、Press "A(DISPLAY)"... - Page 85 User Manual :Bus menu Fig.5-70 BUS setting menu as below: Function Setting Instruction BUS0~BUS3 Choose BUS for operating CH0F~CH00 Choose any channel among CH00~CH0F Channel 1X111111 BUS channel complex indication: 1 for include; X 11111111 for exclude CH0F~ Include The bus selected includes this channel CH00 Exclude The bus selected excludes this channel.
-
Page 86: How To Measure
User Manual :Bus setting Fig.5-71 How to measure Measurement can take auto measure for values of 4 BUS synchronously. Press "measure" and BUS value for current cursor position will display directly in measurement window. BUS0 include CH00~CH03,BUS1 include CH00~CH07,BUS2 include CH00~CH0B,BUS3 include CH00~CH0F. - Page 87 User Manual display setting, threshold setting and trigger setting. And it is possible to save 10 groups of settings. Waveform storage and setting storage menu display as Fig.5-73 .:Storage menu Fig.5-73 Storage menu instruction as below: Function Setting Instruction Memory Waveform Waveform for storage or recall Setups...
-
Page 88: How To Use Usb Flash Disk To Storage
User Manual 4:Waveform saving Fig.5-7 How to use USB flash disk to storage Use USB flash disk is to storage acquired data. Insert U disk into USB port, then press "B" key and you can save the waveform data into the U disk. There is two formats available for choice: Vector format and Bitmap which the corresponding name will be WAVE1.BIN、WAVE2.BIN、... - Page 89 User Manual 5:Search trigger position Fig.5-7 2. Search specified value in BUS Searching BUS menu as below: Function Setting Instruction BUS0~BUS3 Choose searching BUS 0x0000~0xffff Can be set discretionarily between 0x0000 and (HEX) 0xffff (HEX)or between 0 and 65535 (DEC) Code type 0~65535(DEC)...
- Page 90 User Manual .:Search Bus Fig.5-76 3. Searching target is pattern: pattern refers to the complex of different channel according to high/low voltage or irrelated condition. Pattern type searching menu as below Function Setting Instruction CH0F~CH00 Select the channel to set the signal pattern. CH SEL x0100000 16 channel pattern indication.
-
Page 91: How To Review Setting Info
User Manual .:Search Code type Fig.5-77 How to review setting info You can choose system information display to be "On" or "OFF" by press "INFO" key. System information includes all settings for acquired waveform and next acquisition. .:System info Fig.5-78 How to use cursor measurement You can measure manually the time difference between two either data in display or position difference in memory area by cursor measurement. - Page 92 User Manual :Cursor measurement menu Fig.5-79 Cursor measurement time menu as below: Function Setting Instruction Time The time difference between two cursors. Increment Frequency The frequency difference between two cursors. Cursor 1 Time The time display of cursor 1 corresponds to trigger position. Cursor 2 Time The time display of cursor 2 corresponds to trigger position.
- Page 93 User Manual :Cursor time measurement Fig.5-80 Cursor measure position menu as below: Function Display Instruction M1-M2 Position The position difference between two cursors in memory area. Cursor 1 Position The position of cursor 1 corresponds to trigger in memory area. Cursor 2 Position The position of cursor 2 corresponds to trigger in memory area.
-
Page 94: How To Set Utility
User Manual :Cursor position measurement Fig.5-81 How to set Utility Utility function includes recall factory, Language, Carry. Utility menu as below Function Setting Instruction Recall Default setting for LA factory Chinese Support multi-languages, choose you preferred Language English system language. …... -
Page 95: Demonstration
User Manual 6. Demonstration Notice: The following is to take MSO7102T model as an example. Example 1: Measurement of Simple Signals The purpose of this example is to measure the frequency and peak-to-peak value of a given signal. Step1 Go to CH1 menu and Probe menu to set attenuation coefficient as 10X, turn the switch on the Probe to 10X as well. -
Page 96: Example 2: Working Out The Gain Of The Amplifier In The Metering Circuit
User Manual Example 2: Working out the Gain of the Amplifier in the Metering Circuit The purpose of this example is to work out the Gain of an Amplifier in a Metering Circuit. First we use Oscilloscope to measure the amplitude of input signal and output signal from the circuit, then to work out the Gain by using given formulas. -
Page 97: Example 3: Capture The Single Signal
User Manual Fig.6-2 Wave Form of Gain Measurement Example 3: Capture the Single Signal The digital storage oscilloscope takes the lead in providing the convenience capturing of such non-periodic signals as pulse and burr, etc. If you intent to capture a single signal, you can not set the trigger level and the trigger edge unless you have particular priori knowledge of this signal. -
Page 98: Example 4: Analyze The Details Of A Signal
User Manual the signal in conformity with the trigger conditions. If a signal reaches to the set trigger level, one sampling will be made and then displayed in the screen. With this function, any random occurrence can be captured easily. Taking the burst burr of larger amplitude for example, set the trigger level to the value just greater than the normal signal level, and then presses the RUN/STOP button and waits. - Page 99 User Manual Fig.6-4 Signal with Noises Reduce the effect of noises from your signal When focusing on signal itself, the important thing is to reduce the noise level as lower as possible, this would enable user to have more details about the signal. The Average function offered by our Oscilloscope can help you to achieve this Here are the steps for how to enable Average function.
-
Page 100: Example 5: Examine The Phase Shift Between Two Related Signals
User Manual Example 5: Examine the Phase shift between two related signals X-Y mode is a very useful when examining the Phase shift of two related signals. This example takes you step by step to check out the phase change of the signal after it passes a specified circuit. -
Page 101: Example 6: Video Signal Trigger
User Manual Example 6: Video Signal Trigger Observe the video circuit of a television, apply the video trigger and obtain the stable video output signal display. Video Field Trigger For the trigger in the video field, carry out operations according to the following steps: Press the TRIG MENU button to display the trigger menu. - Page 102 User Manual 7. Troubleshooting 1. In the case of that the oscilloscope is still in the black-screen state without any display after the power is switch on, implement the following fault treatment procedure. Check whether the power connection is connected properly. ...
-
Page 103: Technical Specifications
User Manual 8. Technical Specifications Unless otherwise specified, the technical specifications applied are applicable to the probe with the attenuation switch setting 10X and the MSO series digital oscilloscope. Only if the oscilloscope fulfill the following two conditions at first, can these specification standards be reached. - Page 104 User Manual Sampling rate / relay ±100ppm time accuracy Single:±(1 interval time Interval(△T)accuracy +100ppm×reading+0.6ns); (DC~100MHz) Average>16:±(1 interval time +100ppm×reading+0.4ns) 8 bits resolution A/D converter (2 Channels simultaneously) Sensitivity 2mV/div~10V/div(at BNC) ±1V(2mV - 100mV), ±10V(200mV - Displacement 1V), ±100V(2V - 10V) Single bandwidth Full bandwidth Vertical system...
- Page 105 User Manual Bandwidth Full bandwidth Lissajou's Phase figure ±3 degrees difference Frequency ( typical) 1KHz square wave Communication USB2.0, USB for file storage; RS-232 or VGA port (optional) port ﹡Half channel is when only one input channel is available. Trigger: Internal ±6 div from the screen center Trigger level range...
-
Page 106: Logic Analyzer
User Manual Logic analyzer 20 S/s ~ 1GS/s Sampling rate Input channel sampling rate is 250MS/s, Max Storage 4M/Channel,16K( when only 500 MS/s,1GS/s) Measurement bandwidth 100MHz 660KΩ ±5%// 15±5pF Input impedance Threshold level -6V~6V Input signal range -30V~30V Trigger position setting Pre-trigger, mid-trigger, re-trigger Edge trigger, Bus trigger, Pattern trigger, Sequential Trigger Mode... -
Page 107: General Technical Specifications
User Manual General Technical Specifications Display Display Type 8" Coloured LCD (Liquid Crystal Display) Display Resolution 640 (Horizontal) × 480 (Vertical) Pixels Display Colours 65536 colours, TFT screen Output of the Probe Compensator Output Voltage About 5V, with the Peak-to-Peak value equal to or greater than 1MΩ... -
Page 108: Appendix
User Manual 9. Appendix Appendix A: Enclosure Standard Accessories: Passive probe: 2, 1.2 m, 1:1 (10:1) OL-16 LA measurement module CD: x 1 (PC link application software) RS232 data line or USB data line Power line: one, up to the standards of the country in which it is used. ... -
Page 109: Appendix C: Battery Using Guide
User Manual Appendix C: Battery Using Guide Charging the oscilloscope The lithium battery maybe not be fully charged on delivery. Please charge the battery for 12 hours to ensure enough power to supply the oscilloscope. The battery can supply power for 4 hours after being charged completely.
Need help?
Do you have a question about the MP720013 and is the answer not in the manual?
Questions and answers