Table of Contents
Advertisement
Advertisement
Table of Contents

Subscribe to Our Youtube Channel
Related Manuals for multicomp pro MP720012


Summary of Contents for multicomp pro MP720012
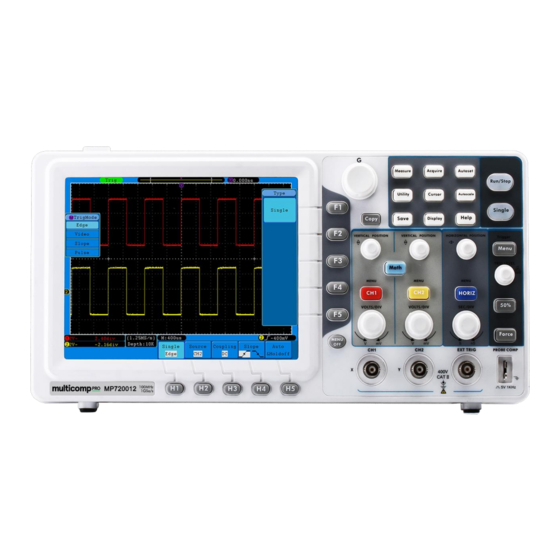
- Page 1 Smart Digital Storage Oscilloscope Model MP720012...
-
Page 2: Table Of Contents
Table of Contents 1. General Safety Requirements ..................1 2. Safety Terms and Symbols ....................2 3. General Characteristics ....................4 4. Junior User Guidebook ............Error! Bookmark not defined. Introduction to the Structure of the Oscilloscope ..............6 Front Panel ............................... 6 Right Side Panel ............................ - Page 3 How to Record/Playback Waveforms ....................58 How to Implement the Auxiliary System Function Setting ..............64 How to Measure Automatically......................69 How to Measure with Cursors ........................ 73 How to Use Autoscale ..........................78 How to Use Built-in Help ........................80 How to Use Executive Buttons.......................
-
Page 4: General Safety Requirements
User Manual 1. General Safety Requirements Before use, please read the following safety precautions to avoid any possible bodily injury and to prevent this product or any other connected products from damage. In order to avoid any contingent danger, ensure this product is only used within the range specified. -
Page 5: Safety Terms And Symbols
User Manual 2. Safety Terms and Symbols Safety Terms Terms in this manual. The following terms may appear in this manual: Warning: Warning indicates the conditions or practices that could result in injury or loss of life. Caution: Caution indicates the conditions or practices that could result in damage to this product or other property. - Page 6 User Manual Warning The channels should adopt common basis during measuring. To prevent short circuits, the 2 probe ground must not be connected to 2 different non-isolated DC level. The diagram of the oscilloscope ground wire connection: Probe Oscilloscope Electrical Outlet Signal Input Power Cord Ground Clip...
-
Page 7: General Characteristics
User Manual 3. General Characteristics Bandwidth: 30 MHz – 125 MHz; Sample rate: 500 MS/s - 1 GS/s; 1 M record length (10 M optional); 8 inch high def TFT display; Ultra-thin body; Pass / Fail function; ... - Page 8 User Manual 4. Basic User Guides This chapter deals with the following topics mainly: Introduction to the structure of the oscilloscope Introduction to the user interface How to implement the general inspection How to implement the function inspection ...
-
Page 9: Introduction To The Structure Of The Oscilloscope
User Manual Introduction to the Structure of the Oscilloscope When you get a new-type oscilloscope, you should get acquainted with its front panel at first and the digital storage oscilloscope is no exception. This chapter makes a simple description of the operation and function of the front panel of the oscilloscope, enabling you to be familiar with the use of the oscilloscope in the shortest time. -
Page 10: Right Side Panel
User Manual Right Side Panel Figure 4-2 Right side panel 1. USB Host port: It is used to transfer data when external USB equipment connects to the oscilloscope regarded as "host device". For example: use this port to save waveform file into USB flash disk. -
Page 11: Rear Panel
User Manual Rear Panel Figure 4-3 Rear Panel 1. Handle 2. Air vents 3. AC power input jack 4. Fuse 5. Feet (which can adjust the tilt angle of the oscilloscope) -
Page 12: Control (Key And Rotary Control) Area
User Manual Control (key and rotary control) Area Figure 4-4 Keys Overview 1. Menu option setting: H1 - H5 2. Menu option setting: F1 - F5 3. Menu off:turn off the menu ○ 4. M rotary control (Multipurpose rotary control): when a M symbol appears in the menu, it indicates you can turn the M rotary control to select the menu or set the value. -
Page 13: User Interface Introduction
User Manual User Interface Introduction Figure 4-5 Illustrative Drawing of Display Interfaces (SDS5032E(V) shown) Waveform Display Area. The state of trigger, including: Auto: Automatic mode and acquire waveform without triggering. Trig: Trigger detected and acquire waveform. Ready: Pre-triggered data captured and ready for a trigger. Scan: Capture and display the waveform continuously. - Page 14 User Manual 13. The frequency of the trigger signal of CH1. 14. It indicates the current function menu. 15. Current trigger type: Rising edge triggering Falling edge triggering Video line synchronous triggering Video field synchronous triggering The reading shows the trigger level value of the corresponding channel. 16.
-
Page 15: How To Implement The General Inspection
User Manual How to Implement the General Inspection After you get a new oscilloscope, it is recommended that you should make a check on the instrument according to the following steps: 1. Check whether there is any damage caused by transportation. If the packing boxes or foam cushions are found to have serious damage, keep them in a safe place until the complete instrument and accessories have passed the electrical and mechanical tests. -
Page 16: How To Implement The Probe Compensation
User Manual Figure 4-6 Auto set Check CH2 by repeating Step 2 and Step 3. How to Implement the Probe Compensation When connect the probe with any input channel for the first time, make this adjustment to match the probe with the input channel. The probe which is not compensated or presents a compensation deviation will result in the measuring error or mistake. -
Page 17: How To Set The Probe Attenuation Coefficient
User Manual Figure 4-7 Displayed Waveforms of the Probe Compensation Repeat the steps mentioned if needed. Figure 4-8 Adjust Probe How to Set the Probe Attenuation Coefficient The probe has several attenuation coefficients, which will influence the vertical scale factor of the oscilloscope. To change or check the probe attenuation coefficient in the menu of oscilloscope: (1) Press the function menu button of the used channels (CH1 MENU or CH2 MENU). -
Page 18: How To Use The Probe Safely
User Manual Caution: When the attenuation switch is set to 1X, the probe will limit the bandwidth of the oscilloscope in 5MHz. To use the full bandwidth of the oscilloscope, the switch must be set to 10X. How to Use the Probe Safely The safety guard ring around the probe body protects your finger against any electric shock, shown as Figure 4-10. - Page 19 User Manual Figure 4-11 Vertical Control Zone Use the "VERTICAL POSITION" rotary control to show the signal in the center of the waveform window. The "VERTICAL POSITION" rotary control functions the regulating of the vertical display position of the signal. Thus, when the "VERTICAL POSITION"...
-
Page 20: Introduction To The Horizontal System
User Manual Introduction to the Horizontal System Shown as Figure 4-12, there are a button and two rotary controls in the "HORIZONTAL CONTROLS". The following practices will gradually direct you to be familiar with the setting of horizontal time base. Figure 4-12 Horizontal Control Zone Use the horizontal "SEC/DIV"... - Page 21 User Manual Figure 4-13 Trigger Control Zone Press the "Trigger Menu" button and call out the trigger menu. With the operations of the menu selection buttons, the trigger setting can be changed. Use the "TRIG LEVEL" rotary control to change the trigger level setting. By rotating the "TRIG LEVEL"...
-
Page 22: Advanced User Guidebook
User Manual 5. Advanced User Guidebook Up till now, you have already been familiar with the basic operations of the function areas, buttons and rotary controls in the front panel of the oscilloscope. Based the introduction of the previous Chapter, the user should have an initial knowledge of the determination of the change of the oscilloscope setting through observing the status bar. -
Page 23: How To Set The Vertical System
• If the waveform is on and its menu is displayed, the waveform is turned off and its menu goes away. CH1 menu CH2 menu Couple setting Probe setting Limit setting Figure 5-1 Channel Setting Menu (Only MP720012(V) and SDS7122E(V) have "Limit" menu) - Page 24 Limit the channel bandwidth to 20 MHz to reduce Limit display noise. (Only MP720012(V) and SDS7122E(V) have this function) 1. To set channel coupling Taking the Channel 1 for example, the measured signal is a square wave signal containing the direct current bias. The operation steps are shown as below: (1) Press the CH1 MENU button to show the CH1 SETUP menu.
- Page 25 User Manual Figure 5-2 AC Coupling Oscillogram 2. To adjust the probe attenuation For correct measurements, the attenuation coefficient settings in the operating menu of the Channel should always match what is on the probe (see "How to Set the Probe Attenuation Coefficient" on P14). If the attenuation coefficient of the probe is 1:1, the menu setting of the input channel should be set to X1.
- Page 26 User Manual Figure 5-3 Regulation of the Attenuation Ratio of the Probe A list of the probe attenuation coefficient and the corresponding menu settings: Attenuation Coefficient of the Probe Corresponding Menu Setting 10:1 100:1 X100 1000:1 X1000 3. To measure current by probing the voltage drop across a resistor Take the Channel 1 as an example, if you are measuring current by probing the voltage drop across a 1Ω...
- Page 27 User Manual Figure 5-4 Measure Current 4. To invert a waveform Waveform inverted: the displayed signal is turned 180 degrees against the phase of the earth potential. Taking the Channel 1 for example, the operation steps are shown as follows: (1) Press the CH1 MENU button to show the CH1 SETUP menu.
- Page 28 Figure 5-6 Inverted Waveform To set bandwidth limit (Only MP720012(V) and SDS7122E(V) have this function) When high frequency components of a waveform are not important to its analysis, the bandwidth limit control can be used to reject frequencies above 20 MHz.
-
Page 29: Use Mathematical Manipulation Function
User Manual (3) Press the F1 button to select the Band Limit as full band. The high frequency of the signal will be allowed to pass. (4) Press the F2 button to select the Band Limit as 20M. The bandwidth is limited to 20 MHz. - Page 30 User Manual Rectangle Blackman Hanning Select dB for Format. Format Vrms Select Vrms for Format. ×1 Set multiple ×1. ×2 Set multiple ×2. Zoom ×5 Set multiple ×5. ×10 Set multiple ×10. channel Select channel low-pass high-pass type Select Filter type band-pass band-reject retangular...
-
Page 31: Using Fft Function
User Manual control to adjust the vertical position of M waveform. Press the F5 menu selection button and choose VOLTS/DIV, turn the M rotary control to adjust the voltage division of M waveform. Figure 5-8 Waveform resulted from CH1 +CH2 Using FFT function The FFT (fast Fourier transform) math function mathematically converts a time-domain waveform into its frequency components. - Page 32 User Manual magnitude accuracy. What you want to measure and your source signal characteristics help you to determine which window to use. Use the following guidelines to select the best window. Type Characteristics Window Better solution for magnitude than Rectangle, and good for frequency as well.
- Page 33 User Manual Figure 5-9 Hamming window Figure 5-10 Rectangle window...
- Page 34 User Manual Figure 5-11 Blackman window Figure 5-12 Hanning window Notes for using FFT Use Zoom function to magnify the FFT waveform if necessary. Use the default dB scale for details of multiple frequencies, even if they have very different amplitudes.
-
Page 35: Digital Filter (Only For Some Models)
User Manual What is Nyquist frequency? The Nyquist frequency is the highest frequency that any real-time digitizing oscilloscope can acquire without aliasing. This frequency is half of the sample rate. Frequencies above the Nyquist frequency will be under sampled, which causes aliasing. So pay more attention to the relation between the frequency being sampled and measured. -
Page 36: How To Set The Horizontal System
User Manual vertical sensitivity and anti-clockwise to decrease. When the vertical position of the channel waveform is adjusted, the changed value is displayed at the left bottom corner of the screen (see Figure 5-13). Figure 5-13 Information about Vertical Position How to Set the Horizontal System The HORIZONTAL CONTROLS includes the HORIZ MENU button and such rotary controls as HORIZONTAL POSITION and SEC/DIV. - Page 37 User Manual A window area is defined by two cursors. This Set (Set Window) function is not available at FFT mode. The defined window area for display is Zoom (Zoom Window) expanded to the full screen. Main Time Base Press the H1 menu selection button and choose Main. In this case, the HORIZONTAL POSITION and SEC/DIV rotary controls are used to adjust the main window.
-
Page 38: How To Set The Trigger System
User Manual Figure 5-16 Window Setting Window Expansion Press the H3 menu selection button and choose Zoom. As a result, the window area defined by two cursors will be expanded to the full screen size (see Figure 5-17). Figure 5-17 Zoom Window How to Set the Trigger System Trigger determines when DSO starts to acquire data and display waveform. -
Page 39: Single Trigger
User Manual to draw the waveform on right of trigger point. Trigger control area consists of 1 rotary control and 3 menu keys. TRIG LEVEL: The rotary control that set the trigger level; press the rotary control and the level will be cleaned to Zero. 50%: The instant execute button setting the trigger level to the vertical midpoint between the peaks of the trigger signal. - Page 40 User Manual Figure 5-18 Edge trigger menu Edge menu list: Menu Settings Instruction Single Mode Edge Set vertical channel trigger type as edge trigger. Channel 1 as trigger signal. Channel 2 as trigger signal. Source External trigger as trigger signal EXT/5 1/5 of the external trigger signal as trigger signal.
- Page 41 User Manual Field Synchronic trigger in video field Synchronic trigger in video odd filed Even Synchronic trigger in video even field Line NO. Synchronic trigger in designed video line, turn the M rotary control to set the line number Auto Acquire waveform even no trigger occurred Mode 100 ns –...
-
Page 42: Alternate Trigger
User Manual Figure 5-21 Pulse Width Trigger menu Pulse Width Trigger menu list: MENU SETTING INSTRUCTION Set vertical channel trigger type as pulse trigger. Single Mode Pulse Select CH1 as the trigger source. Source Select CH2 as the trigger source. Not allow DC portion to pass. - Page 43 User Manual Figure 5-22 Alternate trigger (Trigger Type: Edge) Menu Alternate trigger (Trigger Type: Edge) list: Menu MENU SETTING INSTRUCTION Alternate Mode Edge Set vertical channel trigger type as edge trigger. Select CH1 as the trigger source. Source Select CH2 as the trigger source. Not allow DC portion to pass.
- Page 44 User Manual SECAM Line Synchronic trigger in video line. Field Synchronic trigger in video field. Sync Odd Field Synchronic trigger in video odd filed Even Field Synchronic trigger in video even field Line NO. Synchronic trigger in designed video line, turn the M rotary control to set the line number Auto Acquire waveform even no trigger occurred...
- Page 45 User Manual Alternate trigger (Trigger Type: Pulse) menu list: MENU SETTING INSTRUCTION Alternate Pulse Set vertical channel trigger type as pulse trigger. Mode Select CH1 as the trigger source. Source Select CH2 as the trigger source. Not allow DC portion to pass. Allow all portion pass.
-
Page 46: How To Operate The Function Menu
User Manual Normal: The Normal mode allows the oscilloscope to acquire a waveform only when it is triggered. If no trigger occurs, the oscilloscope keeps waiting, and the previous waveform, if any, will remain on the display. Single: In Single mode, after pressing the Run/Stop key, the oscilloscope waits for trigger. - Page 47 User Manual Figure 5-26 ACQU MODE Menu The description of the Acqu Mode Menu is shown as follows: Function Menu Setting Description Sample Normal sampling mode. Use to capture maximal and minimal samples. Finding highest and lowest points Peak detect over adjacent intervals.
-
Page 48: How To Set The Display System
User Manual Figure 5-28 Normal ACQU Mode display, in which no burr can be detected. Figure 5-29 The displayed waveform after the noise is removed under the Average Mode, in which the average number of 16 is set. How to Set the Display System Press the Display button and the menu displayed in the screen is shown as Figure 5-30. - Page 49 User Manual Function Menu Setting Description Dots Only the sampling points are displayed. Type Vect The space between the adjacent sampling points in the display is filled with the vector form. 1 second Turn the M rotary control to set the persistence Time 2 seconds time...
- Page 50 User Manual Figure 5-32 Display in Dots form Persist When the Persist function is used, the persistence display effect of the picture tube oscilloscope can be simulated. The reserved original data is displayed in fade colour and the new data is in bright colour. Press the H2 button, the Persist menu will display at the right of screen.
- Page 51 User Manual XY Format This format is only applicable to Channel 1 and Channel 2. After the XY display format is selected, Channel 1 is displayed in the horizontal axis and Channel 2 in the vertical axis; the oscilloscope is set in the un-triggered sample mode: the data are displayed as bright spots.
-
Page 52: How To Save And Recall A Waveform
User Manual It is a 6-digit trig freq. The trig freq can measure frequencies from 2Hz to the full bandwidth. Only if the measured channel has triggering signal and in Edge mode, it can measure frequency correctly. In the Single trigger mode, it is a one channel trig freq and it can only measure the frequency of the triggering channel. - Page 53 User Manual used, the stored waveform will be shown, address number relevant information will be displayed at the top left of the screen; if the address is empty, it will prompt "None is saved". Save the waveform of the source to the selected address.
- Page 54 User Manual 4. Press the H5 button and press F1 button to select Internal. 5. Press the H4 button to save the waveform. 6. Recalling: Press the H3 button, and press the F1, turn the M rotary control to select 1 as object address.
- Page 55 User Manual default name is current system date. Turn the M rotary control to choose the keys; press the M rotary control to input the chosen key. The length of file name is up to 25 characters. Choose and press the Enter key of the keyboard to end the input and store the file with the current name.
- Page 56 User Manual Figure 5-38: Disk Management of computer 4. Right click 1 or 2 red mark area, choose Format. And system will pop up a warning message, click Yes. Figure 5-39: Format the USB disk warning 5. Set File System as FAT32, Allocation unit size 4096. Check "Perform a quick format"...
- Page 57 User Manual 6. Formatting process. Figure 5-41: Formatting the USB disk Check whether the USB disk is FAT32 with allocation unit size 4096 after formatting. Use Minitool Partition Wizard to format Download URL: http://www.partitionwizard.com/free-partition-manager.html Tip: There are many tools for the USB disk formatting on the market, just take Minitool Partition Wizard for example here.
- Page 58 User Manual Figure 5-42: Reload Disk 4. Right click 1 or 2 red mark area, choose Format. Figure 5-43: Choose format 5. Set File System FAT32, Cluster size 4096. Click OK. Figure 5-44: Format setting 6. Click Apply at the top left of the menu. Then click Yes on the pop-up warning to begin formatting.
-
Page 59: How To Cut And Recall A Waveform
User Manual Figure 5-45: Apply setting 7. Formatting process Figure 5-46: Format process Format the USB disk successfully Figure 5-47: Format successfully How to Cut and Recall a waveform To cut waveform between two time cursors, generate a file with the suffix “*.ota”, and save it to external memory device. - Page 60 User Manual Move cursor1 (CH1 zero position rotary control) and cursor2 (CH2 zero position rotary control) to choose the range of wave to be cut. 5. Press the H2 button, and the input keyboard will pop up. The default name is the current system date.
-
Page 61: How To Record/Playback Waveforms
User Manual Figure 5-50: choose the .ota file (3) Choose Recall output. And the tip “Read file successfully” will show on the interface. Figure 5-51: Read file Tips: 1. Normally the frequency, amplitude, and offset of the recalled wave are the same as the wave being cut, but when the frequency, amplitude, and offset are set out of the limit range, then AG generators would use the current parameter, which leads to the recalled wave not totally the same as the cut wave. - Page 62 User Manual contains two kinds: Internal and External. When the storage medium is Internal, Wave Record contains four modes: OFF, Record, Playback and Storage. When storage medium is External(See P62 Wave Record Menu of External Storage), Wave Record contains two modes: OFF, Record. Record: To record wave according to the interval until it reaches the end frame set.
- Page 63 User Manual Start frame Turn the M rotary control to select the number of start frame to playback (1 - 1000) End frame Turn the M rotary control to select the number of Playback Mode end frame to playback (1 - 1000) FrameSet Cur frame Turn the M rotary control to select the number of...
- Page 64 User Manual Figure 5-54 Wave Storage To use wave record function, do as follows: (1) Press Save button. (2) Press H1 button, turn the M rotary control to choose Record. (3) Press H2 button. In the Mode menu, press F2 button to choose Record. (4) Press H3 button.
- Page 65 User Manual Figure 5-55: Wave Record Menu of External Storage Record menu (External Storage) shows as follows: Menu Setting Instruction Close wave record function Mode Record Set record menu End frame Turn the M rotary control to select the number of frames to record (1 - 1000) Record mode Turn the M rotary control to select the interval...
- Page 66 User Manual Figure 5-56: Frame setting (External Storage) To use wave record to external, do as follows: 1. Press Save button. 2. Press H1 button, turn the M rotary control to choose Record. 3. Press H2 button. In the Mode menu, press F2 button to choose Record. Press H3 to choose External as the storage medium.
-
Page 67: How To Implement The Auxiliary System Function Setting
User Manual Figure 5-57: Play back waveform by software How to Implement the Auxiliary System Function Setting ●Config Press the Utility button and turn the M rotary control to select Config to go to the following menu. Figure 5-58 Configuration Menu The description of Configuration Menu is shown as the follows: Function Menu Setting... - Page 68 User Manual following menu. Figure 5-59 Display Menu The description of Display Menu is shown as the follows: Function Menu Setting Description Turn the M rotary control to adjust the BackLight 0% - 100% backlight. Graticule Select the grid type Menu Time 5 s - 50 s, OFF Set the disappear time of menu ●Adjust...
- Page 69 User Manual Figure 5-61 Self-Calibration Probe checking: To check whether probe attenuation is good. The results contain 3 circumstances: Overflow compensation, Good compensation, Inadequate compensation. According to the checking result, users can adjust probe attenuation to the best. Operation steps are as follows: 1.
- Page 70 User Manual Figure 5-62:Probe Checking ● Pass/Fail The Pass/Fail function monitors changes of signals and output pass or fail signals by comparing the input signal that is within the pre-defined mask. Press the Utility button and turn the M rotary control to select the Pass/fail to go to the following menu.
- Page 71 User Manual options, which could not be chosen simultaneously. "Stop" means stop once the condition satisfies your setting. 5. Begin to test: Press H2 button, then F2 button to select "Start", the test will begin. 6. Save rule: Press H5 button, then F2 button to save the rules, which could be called up at once when need, press F3 button to call up the rule saved.
-
Page 72: How To Measure Automatically
User Manual ● LAN Set Using the LAN port, the oscilloscope can be connected with a computer directly, or through the router to connect. The network parameters can be set in the menu below. Refer to "Using LAN Port" on P83 for the operation steps. Press the Utility button and turn the M rotary control to select the LAN Set to go to the following menu. - Page 73 User Manual Figure 5-67 Measure Menu The "Automatic Measurements" menu is described as the following table: Function Menu Setting Description Type Press F1 ,show the measure types Source Select the source Show all Show all the measures on the screen Add the selected measure types (shown at the left bottom, you could only add 8 types at most)
- Page 74 User Manual 6. Press the F1 button again, the type items will display at the left of screen, and turn the M rotary control to choose Freq. 7. Press the F4 button, the frequency added completes, finish setting of CH1. 8.
- Page 75 User Manual Figure 5-69 Mean: The arithmetic mean over the entire waveform. PK-PK: Peak-to-Peak Voltage. RMS: The true Root Mean Square voltage over the entire waveform. Max: The maximum amplitude. The most positive peak voltage measured over the entire waveform. Min: The minimum amplitude.
-
Page 76: How To Measure With Cursors
User Manual Figure 5-70 Rise Time: Time that the leading edge of the first pulse in the waveform takes to rise from 10% to 90% of its amplitude. Fall Time: Time that the falling edge of the first pulse in the waveform takes to fall from 90% to 10% of its amplitude. - Page 77 User Manual Figure 5-71 CURS MEAS Menu The description of the cursor measurement menu is shown as the following table: Function Setting Description Menu Switch off the cursor measurement. Type Voltage Display the voltage measurement cursor and menu. Time Display the time measurement cursor and menu. Display the channel generating the waveform to Source which the cursor measurement will be applied.
- Page 78 User Manual Carry out the following operation steps for the time cursor measurement of the channel CH1: Press Cursor and recall the Cursor Measure menu. Press the H2 button and choose CH1 for Source. Press the H1 button, the Type menu will display at the right of the screen. Press the F3 button to select Time for Type, with two purple dotted lines displayed along the vertical direction of the screen, which indicating Cursor 1 and Cursor 2.
- Page 79 User Manual Figure 5-74 CURS MEAS Menu The description of the cursor measurement menu is shown as the following table: Function Setting Description Menu Switch off the cursor measurement. Type Vamp Display the Vamp measurement cursor and menu. Freq Display the Freq measurement cursor and menu. Source Math FFT Display the channel for the cursor measure.
- Page 80 User Manual Figure 5-75 Wave of Vamp cursor measurement Carry out the following operation steps for the Freq cursor measurement: 1. Press Cursor and recall the Cursor Measure menu. 2. Press the H1 button, the Type menu will display at the right of the screen. Press the F3 button to select Freq for Type, with two purple dotted lines displayed along the vertical direction of the screen indicating the corresponding Cursor 1 and Cursor 2.
-
Page 81: How To Use Autoscale
User Manual Figure 5-76 Wave of Freq cursor measurement How to Use Autoscale This is a very useful function for first time users to carry out a simple and quick test on the input signal. The function is applied to follow-up signals automatically even if the signals change at any time. - Page 82 User Manual Follow-up and adjust both vertical and horizontal settings. Follow-up and only adjust horizontal scale. Mode Follow-up and only adjust vertical scale. Show Multi-period waveforms. Wave Only show one or two periods. If you want to measure the two-channel signal, you can do as the follows: 1.
-
Page 83: How To Use Built-In Help
User Manual 4. At the mode of Autoscale, DSO is always set as DC coupling with AUTO triggering. In this case, making Triggering or Coupling settings have no effect. 5. At the mode of Autoscale, if adjust the vertical position, voltage division, trigger level or time scale of CH1 or CH2, the oscilloscope will turn off Autoscale function. - Page 84 User Manual Judge waveform type by Autoset Five kinds of types: Sine, Square, video signal, DC level, Unknown signal. Menu as follow: Sine: ( Multi-period, Single-period, FFT, Cancel Autoset Square: ( Multi-period, Single-period, Rising Edge, Falling Edge, Cancel Autoset Video signal: DC level, Unknown signal: Description for some icons: Multi-period:...
-
Page 85: Communication With Pc
User Manual 6. Communication with PC Digital storage oscilloscope support communications with a PC through USB, LAN or COM port. You can use the Oscilloscope communication software to store, analyze, display the data and remote control. Here is how to connect with PC. First, install the Oscilloscope communication software on the supplied CD. -
Page 86: Using Lan Port
User Manual Using LAN Port Connect directly (1) Connection. Plug in the LAN line to the LAN port in the right side panel of the oscilloscope; plug the other end into the LAN interface of the computer. (2) Set the network parameters of the computer. Since the oscilloscope can not support obtaining an IP address automatically, you should assign a static IP address. -
Page 87: Connect Through A Router
User Manual Figure 6-3 Set the network parameters of the Oscilloscope Software (4) Set the network parameters of the oscilloscope. In the oscilloscope, press the Utility button and press H1 button, turn the M rotary control to select the LAN Set; press the H2 button, the set menu is displayed on the right. - Page 88 User Manual The Default gateway and Subnet mask should be set according to the router. Here we set the IP address to 192.168.1.71, Subnet mask is 255.255.255.0, Default gateway is 192.168.1.1. Figure 6-5 Set the network parameters of the computer (3) Set the network parameters of the Oscilloscope Software.
-
Page 89: Using Com Port
User Manual (4) Set the network parameters of the oscilloscope. In the oscilloscope, press the Utility button and press H1 button, turn the M rotary control to select the LAN Set; press the H2 button, the set menu is displayed on the right. Set the IP and the Port to the same value as the "Ports-settings"... -
Page 90: Demonstration
User Manual 7. Demonstration Example 1: Measurement a Simple Signal The purpose of this example is to display an unknown signal in the circuit, and measure the frequency and peak-to-peak voltage of the signal. Carry out the following operation steps for the rapid display of this signal: (1) Set the probe menu attenuation coefficient as 10X and that of the switch in the probe switch as 10X (see "How to Set the Probe Attenuation Coefficient"... -
Page 91: Example 2: Gain Of A Amplifier In A Metering Circuit
User Manual Then, the period, frequency, mean and peak-to-peak voltage will be displayed at the bottom left of the screen and change periodically (see Figure 7-1). Figure 7-1 Measure Frequency and PK-PK value for a given signal Example 2: Gain of a Amplifier in a Metering Circuit The purpose of this example is to work out the Gain of an Amplifier in a Metering Circuit. -
Page 92: Example 3: Capturing A Single Signal
User Manual (9) Calculate the amplifier gain with the following formulas. Gain = Output Signal / Input signal Gain (db) = 20×log (gain) Figure 7-2 Waveform of Gain Measurement Example 3: Capturing a Single Signal It's quite easy to use Digital Oscilloscope to capture non-periodic signal, such as a pulse and burr etc. - Page 93 User Manual (7) Press the H1 button to display the Trigger Type menu. (8) Press the F1 to choose Single as the type. (9) Turn the M rotary control to choose Edge as the mode. (10) Press the H2 button to display the Source menu. (11) Press the F1 button to choose CH1 as the source.
-
Page 94: Example 4: Analyze The Details Of A Signal
User Manual Example 4: Analyze the Details of a Signal Noise is very common inside most of the electronic signal. To find out what's inside the noise and reduce the level of noise is very important function our oscilloscope is capable to offer. -
Page 95: Example 5: Application Of X-Y Function
User Manual (2) Press the H1 button to display ACQU Mode menu. (3) Press the F3 button, turn the M rotary control and observe the waveform obtained from averaging the waveforms of different average number. User would see a much reduced random noise level and make it easy to see more details of the signal itself. - Page 96 User Manual (4) Turn the VOLTS/DIV rotary control, making the amplitudes of two signals equal in the rough. (5) Press the Display button and recall the Display menu. (6) Press the H3 button and choose XY Mode as ON. The oscilloscope will display the input and terminal characteristics of the network in the Lissajous graph form.
-
Page 97: Example 6: Video Signal Trigger
User Manual Example 6: Video Signal Trigger Observe the video circuit of a television, apply the video trigger and obtain the stable video output signal display. Video Field Trigger For the trigger in the video field, carry out operations according to the following steps: (1) Press the Trigger Menu button to display the trigger menu. -
Page 98: Troubleshooting
User Manual 8. Troubleshooting 1. Oscilloscope is powered on but no Display. Check whether the power connection is connected properly. Check whether the fuse which is beside the AC power input jack is blew (the cover can be pried open with a straight screwdriver). 2. -
Page 99: Technical Specifications
User Manual 9. Technical Specifications Unless otherwise specified, the technical specifications applied are for MP720012 only, and Probes attenuation set as 10X. Only if the oscilloscope fulfills the following two conditions at first, these specification standards can be reached. This instrument should run for at least 30 minutes continuously under the specified operating temperature. - Page 100 User Manual Performance Characteristics Instruction Single: Interval(△T) ± (1 interval time+25 ppm×reading+0.6 ns); accuracy Average>16: (DC - 100 MHz) ± (1 interval time+25 ppm×reading+0.4 ns) A/D converter 8 bits resolution (2 Channels simultaneously) 2 mV/div – 10 V/div ± 1 V (2mV/div – 100mV/div) ±...
- Page 101 User Manual Trigger: Performance Characteristics Instruction Internal ± 6 div from the screen center Trigger level range ± 600 mV EXT/5 ±3 V Internal ±0.3 div Trigger level ± (40 mV + 6% of Set Value) Accuracy (typical) EXT/5 ± (200 mV + 6% of Set Value) Trigger According to Record length and time base displacement...
-
Page 102: General Technical Specifications
User Manual General Technical Specifications Display Display Type 8" Coloured LCD (Liquid Crystal Display) Display Resolution 800 (Horizontal) × 600 (Vertical) Pixels Display Colours 65536 colours, TFT screen Output of the Probe Compensator About 5 V, with the Peak-to-Peak voltage ≥1 MΩ. Output Voltage (Typical ) Frequency (Typical ) Square wave of 1 KHz... -
Page 103: Appendix
User Manual 10. Appendix Appendix A: Enclosure Standard Accessories: A pair of Passive probe: 1.2 m, 1:1 (10:1) 1 x CD (PC link application software) 1 x Power cord: up to the standards of the country in which it is used. ...
Need help?
Do you have a question about the MP720012 and is the answer not in the manual?
Questions and answers