Table of Contents
Advertisement
Advertisement
Table of Contents

Related Manuals for multicomp pro MP720009


Summary of Contents for multicomp pro MP720009
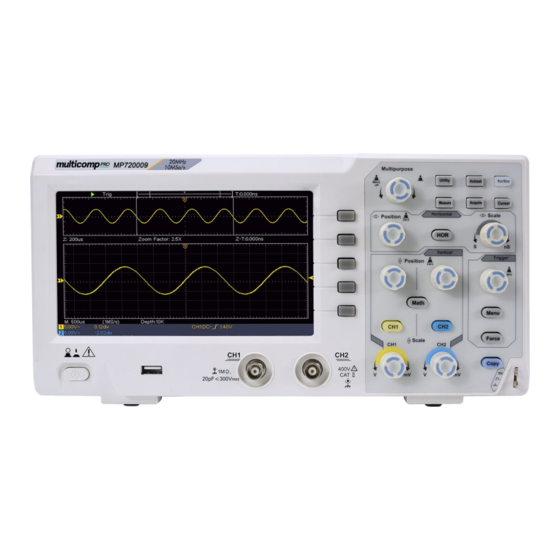
- Page 1 Smart Digital Storage Oscilloscope Models MP720009, MP720010 and MP720011...
-
Page 2: Table Of Contents
Table of Contents 1. General Safety Requirements ..................1 2. Safety Terms and Symbols ....................2 3. Quick Start ........................4 Introduction to the Structure of the Oscilloscope ..............4 Front Panel ............................. 4 Rear Panel ............................... 5 Control Area ............................6 User Interface Introduction ...................... - Page 3 Example 1: Measurement a Simple Signal ................48 Example 2: Gain of a Amplifier in a Metering Circuit ............49 Example 3: Capturing a Single Signal ..................50 Example 4: Analyze the Details of a Signal ................51 Example 5: Application of X-Y Function ................53 Example 6: Video Signal Trigger .....................
-
Page 4: General Safety Requirements
User Manual 1. General Safety Requirements Before use, please read the following safety precautions to avoid any possible bodily injury and to prevent this product or any other connected products from damage. To avoid any contingent danger, ensure this product is only used within the ranges specified. -
Page 5: Safety Terms And Symbols
User Manual 2. Safety Terms and Symbols Safety Terms Terms in this manual (The following terms may appear in this manual): Warning: Warning indicates conditions or practices that could result in injury or loss of life. Caution: Caution indicates the conditions or practices that could result in damage to this product or other property. - Page 6 User Manual To avoid body damage and prevent product and connected equipment damage, carefully read the following safety information before using the test tool. This product can only be used in the specified applications. Warning The two channels of the oscilloscope are not electrically isolated. The channels should adopt a common ground during measuring.
-
Page 7: Quick Start
User Manual 3. Quick Start Introduction to the Structure of the Oscilloscope This chapter makes a simple description of the operation and function of the front panel of the oscilloscope, enabling you to be familiar with the use of the oscilloscope in the shortest time. -
Page 8: Rear Panel
User Manual Rear Panel Figure 3-2 Rear Panel 1. Handle 2. Air vents 3. AC power input jack 4. Feet: Adjust the tilt angle of the oscilloscope. 5. USB Device port: It is used to transfer data when external USB equipment connects to the oscilloscope regarded as "slave device". -
Page 9: Control Area
User Manual Control Area Figure 3-3 Control Area Overview 1. Function button area: Total 6 buttons. 2. Horizontal control area with 1 button and 2 rotary controls. "HOR" button refer to horizontal system setting menu, "Horizontal Position" rotary control control trigger position, " Horizontal Scale" control time base. 3. -
Page 10: User Interface Introduction
User Manual User Interface Introduction 17 16 Figure 3-4 Illustrative Drawing of Display Interfaces 1. Waveform Display Area. 2. Run/Stop 3. The state of trigger, including: Auto: Automatic mode and acquire waveform without triggering. Trig: Trigger detected and acquire waveform. Ready: Pre-triggered data captured and ready for a trigger. - Page 11 User Manual 13. Current trigger type: Rising edge triggering Falling edge triggering Video line synchronous triggering Video field synchronous triggering The reading shows the trigger level value of the corresponding channel. 14. It indicates the measured type and value of the corresponding channel. "T" means period, "F"...
-
Page 12: How To Implement The General Inspection
User Manual How to Implement the General Inspection After you get a new oscilloscope, it is recommended that you should make a check on the instrument according to the following steps: 1. Check whether there is any damage caused by transportation. If the packing boxes or foam cushions are found to have serious damage, keep them in a safe place until the complete instrument and accessories have passed the electrical and mechanical tests. -
Page 13: How To Implement The Probe Compensation
User Manual Figure 3-5 Auto set Check CH2 by repeating Step 2 and Step 3. How to Implement the Probe Compensation When connect the probe with any input channel for the first time, make this adjustment to match the probe with the input channel. The probe which is not compensated or presents a compensation deviation will result in the measuring error or mistake. -
Page 14: How To Set The Probe Attenuation Coefficient
User Manual Figure 3-7 Adjust Probe How to Set the Probe Attenuation Coefficient The probe has several attenuation coefficients, which will influence the vertical scale factor of the oscilloscope. To change or check the probe attenuation coefficient in the menu of oscilloscope: (1) Push the function menu button of the used channels (CH1 or CH2 button). -
Page 15: How To Use The Probe Safely
User Manual How to Use the Probe Safely The safety guard ring around the probe body protects your finger against any electric shock, shown as Figure 3-9. Figure 3-9 Finger Guard Warning: To avoid electric shock, always keep your finger behind the safety guard ring of the probe during the operation. - Page 16 User Manual Figure 3-10 Vertical Control Zone Use the Vertical Position rotary control to show the signal in the center of the waveform window. The Vertical Position rotary control functions the regulating of the vertical display position of the signal. Thus, when the Vertical Position rotary control is rotated, the pointer of the earth datum point of the channel is directed to move up and down following the waveform.
-
Page 17: Introduction To The Horizontal System
User Manual Introduction to the Horizontal System Shown as Figure 3-11, there are a button and two rotary controls in the Horizontal Controls. The following practices will gradually direct you to be familiar with the setting of horizontal time base. Figure 3-11 Horizontal Control Zone Turn the Horizontal Scale rotary control to change the horizontal time base setting and observe the consequent status information change. -
Page 18: Introduction To The Trigger System
User Manual Introduction to the Trigger System As shown in Figure 3-12, there are one rotary control and three buttons make up Trigger Controls. The following practices will direct you to be familiar with the setting of the trigger system gradually. Figure 3-12 Trigger Control Zone 1. -
Page 19: Advanced User Guidebook
User Manual 4. Advanced User Guidebook This chapter will deal with the following topics mainly: How to Set the Vertical System How to Set the Horizontal System How to Set the Trigger System How to Set the Sampling/Display ... -
Page 20: How To Set The Vertical System
User Manual How to Set the Vertical System The VERTICAL CONTROLS includes three menu buttons such as CH1, CH2 and Math, and four rotary controls such as Vertical Position, Vertical Scale for each channel. Setting of CH1 and CH2 Each channel has an independent vertical menu and each item is set respectively based on the channel. -
Page 21: Use Mathematical Manipulation Function
User Manual (1) Push the CH1 button to show the CH1 SETUP menu. (2) In the right menu, select Coupling as DC. Both DC and AC components of the signal are passed. (3) In the right menu, select Coupling as AC. The direct current component of the signal is blocked. -
Page 22: The Waveform Calculation
User Manual The Waveform Calculation Press the Math button to display the menu on the right, select Type as Math. Function Menu Setting Description Type Math Display the Math menu Factor1 Select the signal source of the factor1 Sign + - * / Select the sign of mathematical manipulation Factor2... - Page 23 User Manual Function Menu Setting Description Type Display the FFT menu Select CH1 as FFT source. Source Select CH2 as FFT source. Hamming Rectangle Blackman Window Select window for FFT. Hanning Kaiser Bartlett Vrms Select Vrms for Format. Format Select dB for Format. Next Page Enter next page Switch to select the horizontal position or...
- Page 24 User Manual Type Characteristics Window Better solution for magnitude than Rectangle, and good for frequency as well. It has slightly better frequency resolution than Hanning. Recommend to use for: Hamming Sine, periodic and narrow band random noise. Transients or bursts where the signal levels ...
-
Page 25: Use Vertical Position And Scale Rotary Controls
User Manual The frequency resolution when using the Kaiser window is fair; the spectral leakage and amplitude accuracy are both good. The Kaiser window is best used when frequencies Kaiser are very close to the same value but have widely differing amplitudes (the side lobe level and shape factor are closest to the traditional Gaussian RBW). -
Page 26: How To Set The Horizontal System
User Manual Figure 4-1 Information about Vertical Position How to Set the Horizontal System The HORIZONTAL CONTROLS includes the Horizontal HOR button and such rotary controls as Horizontal Position and Horizontal Scale. 1. Horizontal Position rotary control: this rotary control is used to adjust the horizontal positions of all channels (include those obtained from the mathematical manipulation), the analytic resolution of which changes with the time base. -
Page 27: How To Set The Trigger System
User Manual Selected portion Main Window Time base of Horizontal position of Zoom window Zoom window Zoom Window In normal mode, the Horizontal Position and Horizontal Scale rotary controls are used to adjust the horizontal position and time base of the Main window. In wave zoom mode, the Horizontal Position and Horizontal Scale rotary controls are used to adjust the horizontal position and time base of the Zoom window. -
Page 28: Single Trigger
User Manual Single Trigger Single trigger has two types: edge trigger, video trigger. Edge Trigger: It occurs when the trigger input passes through a specified voltage level with the specified slope. Video Trigger: Trigger on fields or lines for standard video signal. The two trigger modes in Single Trigger are described respectively as follows: 1. -
Page 29: Alternate Trigger (Trigger Mode: Edge)
User Manual 2. Video Trigger Choose video trigger to trigger on fields or lines of NTSC, PAL or SECAM standard video signals. Push the Trigger Menu button to display the Trigger menu on the right. Select Type as Single in the right menu. Select Single as Video in the right menu. In Video Trigger mode, the trigger setting information is displayed on bottom right of the screen, for example, ,... -
Page 30: How To Operate The Function Menu
User Manual 100 ns - 10 s, turn the M rotary control to set time Holdoff interval before another trigger occur. Holdoff Set Holdoff time as default value (100 ns). Reset Prev Page Enter previous page How to Operate the Function Menu The function menu control zone includes 4 function menu buttons: Utility, Measure, Acquire, Cursor, and 2 immediate-execution buttons: Autoset, Run/Stop. - Page 31 User Manual the new data is in bright colour. (1) Push the Acquire button. (2) In the right menu, press Persist to select the persist time, including OFF, 1 Second, 2 Seconds, 5 Seconds and Infinity. When the "Infinity" option is set for Persist Time, the measuring points will be stored till the controlling value is changed.
-
Page 32: How To Save And Recall A Waveform
User Manual 3. Select Counter as ON or OFF in the right menu. How to Save and Recall a Waveform Push the Utility button, select Function in the right menu, select Save in the left menu. By selecting Type in the right menu, you can save the waveforms, configures or screen images. - Page 33 User Manual Function Save Display the save function menu Type Configure Choose the saving type as configure. Setting1 Configure ….. The setting address Setting8 Save the current oscilloscope configure to Save the internal storage Recall the configure from the selected Load address When the Type is selected as Image, the menu is shown as the following table:...
- Page 34 User Manual Turn on CH1 and CH2 channels, turn off the Math channel. Push the Utility button, select Function in the right menu, select Save in the left menu. In the right menu, select Type as Wave. 3. Saving: In the right menu, select Source as All. In the right menu, press Next Page, and select File Format as BIN.
- Page 35 User Manual Use system-provided function to format the USB disk 1. Connect the USB disk to the computer. 2. Right click Computer- Manage to enter Computer Management interface. 3. Click Disk Management menu, and information about the USB disk will display on the right side with red mark 1 and 2.
- Page 36 User Manual Figure 4-4: Formatting the USB disk setting 6. Formatting process. Figure 4-5: Formatting the USB disk Check whether the USB disk is FAT32 with allocation unit size 4096 after formatting. Use Minitool Partition Wizard to format Download URL: http://www.partitionwizard.com/free-partition-manager.html Tip: There are many tools for the USB disk formatting on the market, just take Minitool Partition Wizard for example here.
- Page 37 User Manual Figure 4-6: Reload Disk 4. Right click 1 or 2 red mark area, choose Format. Figure 4-7: Choose format 5. Set File System FAT32, Cluster size 4096. Click OK. Figure 4-8: Format setting 6. Click Apply at the top left of the menu. Then click Yes on the pop-up warning to begin formatting.
- Page 38 User Manual Figure 4-9: Apply setting 7. Formatting process Figure 4-10: Format process Format the USB disk successfully Figure 4-11: Format successfully...
-
Page 39: How To Implement The Auxiliary System Function Setting
User Manual How to Implement the Auxiliary System Function Setting ●Config Push the Utility button, select Function in the right menu, select Configure in the left menu. The description of Configure Menu is shown as the follows: Function Menu Setting Description Function Configure... - Page 40 User Manual Do Self Cal (Self-Calibration) The self-calibration procedure can improve the accuracy of the oscilloscope under the ambient temperature to the greatest extent. If the change of the ambient temperature is up to or exceeds 5℃, the self-calibration procedure should be executed to obtain the highest level of accuracy.
-
Page 41: How To Measure Automatically
User Manual How to Measure Automatically Push the Measure button to display the menu for the settings of the Automatic Measurements. At most 8 types of measurements could be displayed on the bottom left of the screen. The oscilloscopes provide 30 parameters for auto measurement, including Period, Frequency, Mean, PK-PK, RMS, Max, Min, Top, Base, Amplitude, Overshoot, Preshoot, Rise Time, Fall Time, +PulseWidth, -PulseWidth, +Duty Cycle, -Duty Cycle, Delay A→B , Delay A→B , Cycle RMS, Cursor RMS, Screen Duty, Phase, +PulseCount,... - Page 42 User Manual The measured value will be displayed at the bottom left of the screen automatically (see Figure 4-12). Figure 4-12 Automatic measurement The automatic measurement of voltage parameters The oscilloscopes provide automatic voltage measurements including Mean, PK-PK, RMS, Max, Min, Vtop, Vbase, Vamp, OverShoot, PreShoot, Cycle RMS, and Cursor RMS.
- Page 43 User Manual Min: The minimum amplitude. The most negative peak voltage measured over the entire waveform. Vtop: Voltage of the waveform's flat top, useful for square/pulse waveforms. Vbase: Voltage of the waveform's flat base, useful for square/pulse waveforms. Vamp: Voltage between Vtop and Vbase of a waveform. OverShoot: Defined as (Vmax-Vtop)/Vamp, useful for square and pulse waveforms.
-
Page 44: How To Measure With Cursors
User Manual Phase: Compare the rising edge of CH1 and CH2, calculate phase difference of two channels. Phase difference=(Delay between channels at the rising edge÷Period)×360°. Other measurements +PulseCount : The number of positive pulses that rise above the mid reference crossing in the waveform. -PulseCount : The number of negative pulses that fall below the mid reference crossing in the waveform. - Page 45 User Manual Window Main Measure in the main window. (Wave Extension Measure in the extension window. zoom mode) Turn the M rotary control to move line a. Turn the M rotary control to move line b. Line Two cursors are linked. Turn the M rotary control to move the pair of cursors.
- Page 46 User Manual Auto Cursor For the AutoCursr type, the horizontal cursors are set as the intersections of the vertical cursors and the waveform. Auto Cursor The Cursor Measurement for FFT mode In FFT mode, push the Cursor button to turn cursors on and display the cursor menu. The description of the cursor menu in FFT mode is shown as the following table: Function Setting...
-
Page 47: How To Use Executive Buttons
User Manual 1. Press the Math button to display the right menu. Select Type as FFT. 2. Push Cursor to display the cursor menu. 3. In the right menu, select Window as Extension. Press the first menu item in the right menu, select Freq&Vamp for Type, two blue dotted lines displayed along the horizontal direction of the screen, two blue dotted lines displayed along the vertical direction of the screen. - Page 48 User Manual Judge waveform type by Autoset Five kinds of types: Sine, Square, video signal, DC level, Unknown signal. Menu as follow: Waveform Menu Sine Multi-period, Single-period, FFT, Cancel Autoset Square Multi-period, Single-period, Rising Edge, Falling Edge, Cancel Autoset Video signal Type (line, field), Odd, Even, Line NO., Cancel Autoset...
-
Page 49: Communication With Pc
User Manual 5. Communication with PC The oscilloscope supports communications with a PC through USB. You can use the Oscilloscope communication software to store, analyse, and display the data and allow remote control. Here is how to connect with PC via USB port. 1. - Page 50 User Manual Click on Data Download icon Figure 5-1 Control with PC through USB port...
-
Page 51: Demonstration
User Manual 6. Demonstration Example 1: Measurement a Simple Signal The purpose of this example is to display an unknown signal in the circuit, and measure the frequency and peak-to-peak voltage of the signal. Carry out the following operation steps for the rapid display of this signal: (1) Set the probe menu attenuation coefficient as 10X and that of the switch in the probe switch as 10X (see "How to Set the Probe Attenuation Coefficient"... -
Page 52: Example 2: Gain Of A Amplifier In A Metering Circuit
User Manual Figure 6-1 Measure period and frequency value for a given signal Example 2: Gain of a Amplifier in a Metering Circuit The purpose of this example is to work out the Gain of an Amplifier in a Metering Circuit. -
Page 53: Example 3: Capturing A Single Signal
User Manual Figure 6-2 Waveform of Gain Measurement Example 3: Capturing a Single Signal It's quite easy to use Digital Oscilloscope to capture non-periodic signal, such as a pulse and burr etc. But the common problem is how to set up a trigger if you have no knowledge of the signal? For example, if the pulse is the logic signal of a TTL level, the trigger level should be set to 2 volts and the trigger edge be set as the rising edge trigger. -
Page 54: Example 4: Analyze The Details Of A Signal
User Manual (11) Turn the Trigger Level rotary control and adjust the trigger level to the roughly 50% of the signal to be measured. (12) Check the Trigger State Indicator on the top of the screen, if it is not Ready, push down the Run/Stop button and start acquiring, wait for trigger to happen. - Page 55 User Manual The signal displayed on the screen containing some noise, by turning on Peak Detect function and changing time base to slow down the incoming signal, any peaks or burr would be detected by the function (see Figure 6-4). Figure 6-4 Signal with Noises Separate Noises from the Signal When focusing on signal itself, the important thing is to reduce the noise level as...
-
Page 56: Example 5: Application Of X-Y Function
User Manual Figure 6-5 Reduce Noise level by using Average function Example 5: Application of X-Y Function Examine the Phase Difference between Signals of two Channels Example: Test the phase change of the signal after it passes through a circuit network. X-Y mode is a very useful when examining the Phase shift of two related signals. - Page 57 User Manual difference (see Figure 6-6). The signal must be centered and kept in the horizontal direction. Figure 6-6 Lissajous Graph Based on the expression sin (q) =A/B or C/D, thereinto, q is the phase difference angle, and the definitions of A, B, C, and D are shown as the graph above. As a result, the phase difference angle can be obtained, namely, q =±...
-
Page 58: Example 6: Video Signal Trigger
User Manual Example 6: Video Signal Trigger Observe the video circuit of a television, apply the video trigger and obtain the stable video output signal display. Video Field Trigger For the trigger in the video field, carry out operations according to the following steps: (1) Push the Trigger Menu button to display the right menu. -
Page 59: Troubleshooting
User Manual 7. Troubleshooting 1. Oscilloscope is powered on but no Display. Check whether the power connection is connected properly. Restart the instrument after completing the checks above. 2. After acquiring the signal, the waveform of the signal is not displayed in the screen. -
Page 60: Technical Specifications
If change of the operating temperature is up to or exceeds 5℃, do a "Self-calibration" procedure (see "How to Implement Self-calibration" on P12). All specification standards can be fulfilled, except one(s) marked with the word "Typical". Performance Characteristics Instruction Bandwidth MP720009 20 MHz MP720010 50 MHz MP720011 100 MHz Channel... - Page 61 8 bits (2 channels simultaneously) (A/D) Sensitivity 5 mV/div~5 V/div Displacement ±2 V (5 mV/div – 100 mV/div) ±50 V (200 mV/div – 5 V/div) Analog bandwidth MP720009 20 MHz MP720010 50 MHz MP720011 100 MHz Single bandwidth Full bandwidth Low Frequency ≥10 Hz (at input, AC coupling, -3 dB)
- Page 62 User Manual Trigger: Performance Characteristics Instruction ±5 div from the screen center Trigger level range Internal ±0.3 div Trigger level Internal Accuracy (typical) Trigger According to Record length and time base displacement Trigger Holdoff 100 ns – 10 s range 50% level setting Input signal frequency ≥...
-
Page 63: General Technical Specifications
User Manual General Technical Specifications Display Display Type 7" Coloured LCD (Liquid Crystal Display) Display Resolution 800 (Horizontal) × 480 (Vertical) Pixels Display Colours 65536 colours, TFT screen Output of the Probe Compensator Output Voltage About 5 V, with the Peak-to-Peak voltage ≥1 MΩ. (Typical) Frequency (Typical) Square wave of 1 KHz... -
Page 64: Appendix
User Manual 9. Appendix Appendix A: Enclosure (The accessories subject to final delivery.) Standard Accessories: Power Cord CD Rom Quick Guide USB Cable Probe Probe Adjust Options: Soft Bag... -
Page 65: Appendix B: General Care And Cleaning
User Manual Appendix B: General Care and Cleaning General Care Do not store or leave the instrument where the liquid crystal display will be exposed to direct sunlight for long periods of time. Caution: To avoid any damage to the instrument or probe, do not exposed it to any sprays, liquids, or solvents.
Need help?
Do you have a question about the MP720009 and is the answer not in the manual?
Questions and answers