
Related Manuals for Tektronix MSO 2 Series


Summary of Contents for Tektronix MSO 2 Series
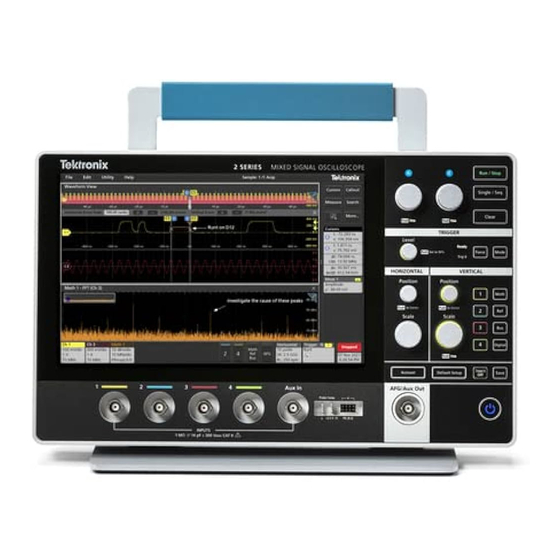
- Page 1 2 Series MSO MSO24 and MSO22 Help Register now! Click the following link to protect your product. tek.com/register *P077171605* 077-1716-05 January 2024...
- Page 2 Copyright © Tektronix. All rights reserved. Licensed software products are owned by Tektronix or its subsidiaries or suppliers, and are protected by national copyright laws and international treaty provisions. Tektronix products are covered by U.S. and foreign patents, issued and pending. Information in this publication supersedes that in all previously published material. Specifications and price change privileges reserved.
-
Page 3: Table Of Contents
Contents Contents TEKTRONIX END USER LICENSE AGREEMENT........................11 Open Source GPL License Notice.............................. 12 Instrument compliance markings..............................13 Welcome to the 2 Series MSO Help............................14 Product documents and support..............................15 Product support and feedback............................. 15 Product Documentation............................... 15 Installing your instrument................................17 Install option upgrade licenses.............................17... - Page 4 Contents Unmount a network drive from a standard instrument......................54 Unmount a TekDrive................................54 Connect the oscilloscope to a PC using a USB cable......................54 Deskew analog input channels - quick visual method......................54 Deskew analog input channels............................55 Connect a keyboard or mouse.............................56 ESD Prevention Guidelines..............................
- Page 5 Contents Mask testing waveforms................................89 Create a Mask..................................89 Edit mask segments on the screen............................89 Edit mask segments using the Mask Definition menu......................92 Zoom in on waveforms................................95 Turn on Zoom mode................................95 Using Wave Inspector front-panel controls for zoom......................96 Zoom mode and Searches..............................96 Measurement configuration.................................97 Label a measurement................................
- Page 6 Contents Parallel Bus configuration menu..........................127 Parallel Bus - Define Inputs menu..........................129 I2C serial bus configuration menu..........................129 SPI serial bus configuration menu..........................130 RS232 serial bus menu...............................132 CAN serial bus configuration menu..........................133 LIN serial bus configuration menu..........................136 SENT serial bus configuration menu..........................
- Page 7 Contents Save As configuration menu (File menu)........................181 Browse Save As Location configuration menu......................184 File Utilities configuration (File menu).........................185 Mount Drive configuration menu..........................186 Undo, Redo (Edit menu)............................. 188 User Preferences (Utility menu)..........................188 Connected Oscilloscope preferences......................... 191 Legalese..................................191 Define Custom Colors menu............................192 I/O (Utility menu).................................193 LAN Reset configuration menu (Utility >...
- Page 8 Contents Parallel serial bus trigger settings panel........................225 RS-232 serial bus trigger settings panel........................226 SENT serial bus trigger settings panel........................227 SPI serial bus trigger settings panel........................... 229 Virtual Keyboard.................................230 Bus trigger radix-specific virtual keypads...........................230 Virtual Keypad..................................231 Waveform View configuration menu..........................231 Waveform acquisition................................
- Page 9 Contents Math waveform differentiation............................248 Math waveform offset, position, and scale......................... 249 Waveform integration................................. 249 FFT process..................................250 FFT and aliasing................................250 Blackman-Harris FFT window concepts..........................251 Flattop2 window................................. 252 Gaussian window................................252 Hanning FFT window................................. 253 Hamming window................................253 Kaiser-Bessel FFT window..............................254 Rectangular window................................254 Tek-Exponential window..............................
- Page 10 Contents Time Outside Level measurement algorithm......................264 Time to Max................................265 Time to Min................................. 265 Unit Interval measurement algorithm..........................265 Frequency Response Analysis algorithms.........................265 Control Loop Response (Bode) measurement algorithm....................265 Index......................................266...
-
Page 11: Tektronix End User License Agreement
TEKTRONIX END USER LICENSE AGREEMENT TEKTRONIX END USER LICENSE AGREEMENT Go to www.tek.com/terms_and_conditions to read the Tektronix End User License Agreement. 2 Series MSO MSO24 and MSO22... -
Page 12: Open Source Gpl License Notice
You can order a CD containing the sources from us for a period of three years after download of the software, by sending a written request to: Chief Intellectual Property Counsel, Tektronix, Inc. MS 50/LAW 14150 SW Karl Braun Dr. -
Page 13: Instrument Compliance Markings
The mark is required per Article 11(2) of the WEEE Directive. TB RoHS TB RoHS marking indicates that the item is certified by Tektronix to be RoHS MARK Compliant to the 10 restricted substances according to EU Directive 2015/863 and that Tektronix has published a TDoC and/or DoC. -
Page 14: Welcome To The 2 Series Mso Help
Advanced serial bus triggering and analysis option lets you decode and trigger on industry standard buses • Industry standard VESA interface can be used with several accessories offered by Tektronix and it is also compatible with off the shelf VESA mounts... -
Page 15: Product Documents And Support
Finding documentation for your product and contacting Tektronix for support and feedback. Product support and feedback Tektronix values your feedback on our products. To help us serve you better, please send us your suggestions, ideas, or comments on your instrument, application, or product documentation. - Page 16 Product documents and support How to find your product documentation 1. Go to tek.com. 2. Click Download in the green sidebar on the right side of the screen. 3. Select Manuals as the Download Type, enter your product model, and click Search. 4.
-
Page 17: Installing Your Instrument
About this task Note: You can only install a Node Locked option license one time. If you need to reinstall an uninstalled Node Locked license, contact Tektronix Customer Support. Procedure Follow the instructions you received to download the upgrade license file (<filename>.lic). -
Page 18: Input Signal Requirements
3. Check that the status of all power-on self tests are Passed. If one or more power-on self tests shows Failed: 1. Power cycle the instrument. 2. Select Utility > Self Test. If one or more power-on self tests still shows Failed, contact Tektronix Customer Support. -
Page 19: Battery Pack Information
Installing your instrument Battery pack information The battery pack allows you to perform measurements without relying on AC power. All 2 Series MSO instruments support the installation of the battery pack. You can operate the instrument continuously for approximately three hours with one battery and six hours with two batteries in the battery pack. - Page 20 Installing your instrument Procedure 1. Remove cover from battery interface connector on the back of your instrument. 2. Attach the battery interface cover to the cover slot in the middle of the battery pack. Use this slot to save the cover for the battery interface connector when the battery pack is installed. 3.
-
Page 21: Operating Safely With Battery Power
Inspect the cable, insulation, and terminal ends for damage before use. Do not use a damaged grounding cable. Contact Tektronix for a replacement. If you choose not to attach the grounding cable, you are not protected against electric shock if you connect the oscilloscope to a hazardous voltage. -
Page 22: Rechargeable Battery Installation
The battery pack has 2 battery slots and supports hot swapping of the batteries during operation to extend the battery run time. The batteries are charged when the instrument is connected to an AC power source or charge each battery separately using the Tektronix external battery charger (TEKCHG-XX). -
Page 23: Rechargeable Battery Removal
Installing your instrument Rechargeable battery removal Procedure 1. Use your fingers to push on the door latch and open the door upward. 2. Open the battery latch to release the battery from the slot. 3. Use the battery pull tab to remove the battery from the slot. 4. - Page 24 Installing your instrument Item Description The battery icon displays a power cord when connected to an AC power source. This indicates that the battery is charging in the battery pack. The battery icon and a warning symbol when operating on a battery power alone. The battery icon turns red when less than ten percent of the battery charge is remaining.
-
Page 25: Instrument Stand To Battery Pack Installation
Installing your instrument Instrument stand to battery pack installation Mount your instrument to the provided stand in three configurations. Before you begin Align the stand with the four VESA screw mounts (closest to the label) on the back of the battery pack. Procedure 1. -
Page 26: Connecting Probes To The Instrument
Installing your instrument Connecting probes to the instrument Probes connect the instrument to your device under test (DUT). Use a probe that best matches your signal measurement needs. Connect a BNC passive probe or cable by pushing it onto a channel BNC bayonet connector and turn the lock mechanism clockwise until it locks. -
Page 27: Getting Acquainted With Your Instrument
Getting acquainted with your instrument Getting acquainted with your instrument The following content provides a high-level description of the instrument controls and user interface. Front panel controls and connectors The front panel controls provide direct access to key instrument settings such as vertical, horizontal, trigger, cursors, and zoom. The connectors are where you input signals with probes or cables. -
Page 28: Button And Knob Functions
Getting acquainted with your instrument Description 8 The AFG/AUX Out BNC connector is multiplexed. You must select either AFG or Aux Out to use this connector. AFG is the signal output for the optional Arbitrary Function Generator (AFG) feature. AUX Out generates a signal transition on a trigger event or outputs a synchronization signal from the AFG. - Page 29 Getting acquainted with your instrument Button Description Mode Sets how the instrument behaves in the absence or presence of a trigger event. Auto trigger mode enables the instrument to acquire and display a waveform whether or not a trigger event occurs. If a trigger event occurs, the instrument displays a stable waveform. If a trigger event does not occur, the instrument forces a trigger event and acquisition and displays an unstable waveform.
-
Page 30: Rear And Side Panel Connections
Getting acquainted with your instrument Button Description Digital Adds or selects a digital waveform on the Waveform view. If no digital waveform exists, pushing the button adds a digital waveform to the Waveform view and opens the digital configuration menu. If only one digital waveform is displayed, pushing the button turns off the digital waveform (removes it from Waveform view). - Page 31 Getting acquainted with your instrument Description 1 Use the digital probe connector to connect the P6316 Logic Probe. 2 Use the USB Device port to connect to a PC to remotely control the oscilloscope using the USBTMC protocol. 3 Use the LAN connector (RJ-45) to connect the oscilloscope to a 10/100 Base-T local area network. 4 Use the two USB Host ports to connect a USB memory device, keyboard, or mouse 5 The ground lug external chassis ground point allows you to connect your instrument chassis to a ground reference.
-
Page 32: Instrument Stand Installation
Getting acquainted with your instrument Instrument stand installation Mount your instrument to the provided stand in three configurations. Before you begin Align the stand with the four VESA screw mounts (closest to the label) on the back of the instrument. Procedure 1. -
Page 33: User Interface
Getting acquainted with your instrument User interface The touch screen user interface contains waveforms and plots, measurement readouts, and touch-based controls to access all oscilloscope functions. Description The menu bar provides menus for typical operations including: Saving, loading, and accessing files Undoing or redoing an action Setting oscilloscope display and measurement preferences Configuring network access... - Page 34 Getting acquainted with your instrument Description The results bar contains controls for displaying cursors, adding callouts, plots, and result tables to the screen. You also are able to add badges to the results bar. To remove a measurement, search or other badge from the results bar flick-it off screen. The controls are: The Cursors button displays on-screen cursors in the selected view.
-
Page 35: User Interface Elements
Getting acquainted with your instrument User interface elements Each area of the user interface has a specific function that helps manage information or controls. The Waveform Record View is a graphical high-level view of the overall waveform record length, how much of the record is on the screen (shown in brackets), the location of key time events including the trigger event, and the current position of waveforms cursors. -
Page 36: Badges
Getting acquainted with your instrument The System badges show global instrument settings (Horizontal, Trigger, Run/Stop status, and Date/Time). The Inactive Channel buttons add channel waveforms to the Waveform view and add an associated Channel badge to the Settings bar. The optional AFG button opens the AFG configuration menu to set and enable the AFG output. This button is only present if the AFG option is installed. - Page 37 Getting acquainted with your instrument You can drag Channel and Waveform badges to change their position in the Settings bar and open the badge right-click menu to access a quick-action menu. There are two ways to delete Channel and Waveform badges. •...
- Page 38 Getting acquainted with your instrument Measurement badges are listed in the order created, starting at the top of the Results bar. Deleting a Measurement badge does not change the order or names of the remaining badges. You can drag Measurement badges to change their position in the Results bar and open the badge right-click menu to access a quick-action menu.
- Page 39 Getting acquainted with your instrument Badge readout Description Failed The number of waveforms that contained one or more samples that violated the mask. Displays in red if greater than or equal to the total failures threshold. Cons The highest number of consecutively failed waveforms in the test run. Displays in red if greater than or equal to the consecutive failures threshold.
- Page 40 Getting acquainted with your instrument Search badges have < (Previous) and > (Next) Navigation buttons that open the Zoom mode and center the waveform in the display at the position of the previous or next search mark in the waveform record. Search badge Navigation buttons are only usable when the oscilloscope is in single acquisition mode.
- Page 41 Getting acquainted with your instrument • If the box is checked, it proceeds with deleting the rest of the items without bringing up the dialog box again. The dialog box appears for each set of measurements you want to delete. Signal Clipping and Badges WARNING: Clipping is caused by excessive or dangerous voltage at the probe tip, and/or a vertical scale setting that is not adequate to display the entire vertical range of the waveform.
- Page 42 Getting acquainted with your instrument Action Result Example Double tap Configuration menu with access to all settings for the badge. Touch and hold Right-click menu with single tap access to common actions. Typical actions include turning off a channel and deleting a measurement or search badge.
-
Page 43: Moving Waveform And Measurement Badges
Getting acquainted with your instrument Moving waveform and measurement badges You can move waveform and measurement badges within their display bars to meet your measurement needs. Simply touch and drag the badge to a new position. Moving waveform badges in the Settings Bar •... -
Page 44: Configuration Menus
Getting acquainted with your instrument Badge group characteristics • Badges in a group are listed left to right in the order they were added to the group. • The badge group color is the color of the last selected badge in the group. •... -
Page 45: Zoom User Interface
Getting acquainted with your instrument To open Help content for a configuration menu, tap the question mark icon in the upper right corner of the menu. Zoom user interface Use the zoom tools to magnify waveforms to view signal details. 1. -
Page 46: Using The Touch Screen Interface For Common Tasks
Getting acquainted with your instrument To exit the zoom display mode, tap the Zoom icon in the corner of display or tap the X in the Zoom Title Bar. Math-FFT or XY plot view zoom Use the A and B multipurpose knobs to adjust the zoom for Math-FFT or XY plot view. In a Math-FFT or XY plot view, if A and B multipurpose knobs are assigned to Zoom, the zoom box is highlighted and the multipurpose knobs within the Zoom Box are enabled. - Page 47 Getting acquainted with your instrument Task Touchscreen UI action Mouse action Display scale or navigation Tap the badge. Click the badge. buttons on a badge (waveform, measurement, search, horizontal). Not all measurement or search badges display navigation buttons. Open a configuration menu on Double-tap the badge, view, or other object.
-
Page 48: Accessing Application Help
Getting acquainted with your instrument Accessing application help Use the instrument online help to quickly get information about a function or assistance in performing a task. Using context-sensitive help To open help on a particular menu or item, tap the Help button (question mark symbol) in the title bar. The browser opens with content relevant to the menu or item. -
Page 49: Configure The Instrument
Configure the instrument Configure the instrument Configurations to help operate your instrument efficiently. Download and install the latest instrument firmware Installing the latest firmware helps ensure that your instrument has the latest features and is taking the most accurate measurements. Before you begin Save any important on-instrument files such as waveforms, screen captures, and setups to a USB drive or network. -
Page 50: Functional Check
Configure the instrument 2. To turn off showing the date and time on the screen, tap Display button to Off. To turn on date/time display again, double-tap in the blank area where the date/time badge was displayed to open the configuration menu, and set the Display button to On. -
Page 51: Compensate The Probe
4. Close the Calibration configuration dialog when SPC has completed. If the SPC fails, write down any error message text. Make sure that all probes and cables are disconnected and run the SPC again. If the SPC still fails, contact Tektronix Customer Support. Compensate the probe Probe compensation adjusts the high frequency response of a probe for best waveform capture and measurement accuracy. -
Page 52: Connect To A Network (Lan)
Configure the instrument 7. Use the probe adjustment tool provided with the probe to adjust the probe until the waveform has as flat a top and bottom as possible. Remove the adjustment tool before looking at the waveform. Repeat until waveform top and bottom are flat. See your probe manual for adjustment location and instructions. -
Page 53: Mount Tekdrive
CAUTION: The Linux ScopeApp does not support SMB version 1.0 for CIFS network mounts. Mount TekDrive TekDrive is a collaborative T&M data workspace provided with the purchase a supported Tektronix product. Before you begin You must have internet connectivity access to perform this procedure. -
Page 54: Unmount A Network Drive From A Standard Instrument
Configure the instrument The connected TekDrive is available in all file browsing windows. Unmount a network drive from a standard instrument Use this procedure to unmount (remove, disconnect) a network Linux mount point from a standard (non-Windows 10) instrument. To unmount a network drive from your instrument: 1. -
Page 55: Deskew Analog Input Channels
Configure the instrument Determine the channel you want to use as your reference. Double-tap the Channel badge of a channel other than the reference channel and tap the Other panel. 10. Tap the Deskew field and use the multipurpose knob to align this channel with the reference channel waveform such that the waveforms cross the trigger point at the same time. -
Page 56: Connect A Keyboard Or Mouse
Configure the instrument Turn on (display on screen) the connected channels that you want to deskew. Double-tap in the Waveform view and set Waveform Mode to Overlay. Push the Autoset button. Adjust the vertical Scale and Position controls for each channel so that the signals overlap and are centered on the display. Adjust the horizontal Scale so that the differences in the channel delays are clearly visible. -
Page 57: Analog Channel Operating Basics
Analog channel operating basics Analog channel operating basics Acquiring a signal After acquiring a signal you can take measurements and plot the results. Use the following procedure to set the scale and position parameters for analog signal acquisition. 1. Press the Default Setup button. 2. -
Page 58: Set Horizontal Parameters
Analog channel operating basics When using the Overlay Display mode, the instrument adjusts the horizontal and trigger settings of the trigger source channel to display a triggered waveform for that channel. Vertical scale and position adjustments for all active channels in Overlay Display mode are controlled by the Autoset in Overlay Display Mode Optimizes selection in the Autoset panel of the User Preferences menu. -
Page 59: How To Trigger On A Signal
Analog channel operating basics 2. Use the menu selections to set horizontal parameters. 3. Tap the Help icon on the menu title for more information on these settings. How to trigger on a signal Use this procedure to open the Trigger menu to select and configure the trigger event type and conditions. 1. -
Page 60: Set The Acquisition Mode
Analog channel operating basics 4. Tap the Help icon on the menu title for more information on these settings. 5. Tap outside the menu to close the menu. Set the acquisition mode Use this procedure to set the method the instrument uses to acquire and display the signal. 1. -
Page 61: Add A Channel Waveform To The Display
Analog channel operating basics 7. To clear the current acquisition data from waveform memory, double-tap the Acquisition badge and tap Clear in the Acquisition configuration menu, or push the Clear button on the front panel. Add a channel waveform to the display Use this procedure to add a channel signal to the Waveform View. -
Page 62: Configure Channel Or Waveform Settings
Analog channel operating basics Configure channel or waveform settings Use the channel and waveform configuration menus to set parameters such as vertical scale and offset, coupling, bandwidth, probe settings, deskew values, external attenuation values, and other settings. Before you begin Prerequisite: There is a channel or waveform badge in the Settings bar. - Page 63 Analog channel operating basics 2. The instrument adds the waveform to the Waveform view, adds a Waveform badge to the Settings bar, and opens a configuration menu. This example shows adding a Math waveform. 3. Use the configuration menus to refine the waveform parameters. Displayed fields depend on the waveform and selections made in the menu.
-
Page 64: Add A Measurement
Analog channel operating basics 6. Tap the Help icon on a configuration menu title for more information on math, reference, and bus waveform settings. 7. Tap outside the menu to close the menu. Add a measurement Use this procedure to select and add measurements. Acquire the channel(s) and/or waveform(s) on which you want to take measurements. - Page 65 Analog channel operating basics Select a measurement category panel, such as Amplitude Measurements or Time Measurements, to display measurements for those categories. Select a measurement and tap Add to add the measurement to the Results bar. You can also double-tap a measurement to add it to the Results bar.
-
Page 66: Configure A Measurement
Analog channel operating basics Tap outside the Add Measurements menu to close the menu. To further adjust a measurement's settings, double-tap a measurement badge to open a configuration menu for that measurement. Configure a measurement on page 66. 10. Tap the Help icon on the menu title for more information on settings. Configure a measurement Use this procedure to add statistical readouts to the measurement badge, display plots for the measurement, and refine measurement parameters (configuration, global versus local scope of settings, gating, filtering, and so on). -
Page 67: Delete A Measurement Or Search Badge
Analog channel operating basics 3. Tap available panel titles to make changes for those categories. 4. Use the available fields to refine the measurement conditions. Displayed fields depend on the measurement. Selection changes take effect immediately. Selection changes can also change fields in other panels. 5. -
Page 68: Display An Xy Plot
Analog channel operating basics 3. The second way to delete a Measurement or Search badge is by flicking it off the right edge of the display. Flicking to the left from the right edge of the display recovers the badge. Note: Badge recovery is possible within 10 seconds only of removal. - Page 69 Analog channel operating basics 2. Tap Bus Type and select the bus type from the drop-down list. 3. Use the fields and controls to select the bus signal sources, thresholds, other parameters, and the output format. The following image shows the settings for an I2C serial bus. The decoded bus is updated on the screen as you make changes to the settings.
-
Page 70: Add A Parallel Bus To The Waveform View
Analog channel operating basics 6. For more information on serial bus settings, tap the Help button on the Bus configuration menu. Add a parallel bus to the Waveform view Use this procedure to add a parallel bus to the Waveform view. When you acquire data from a Parallel bus, you can set up the bus to be clocked or unclocked. - Page 71 Analog channel operating basics b. Tap the Clock Source field and select the source for the parallel bus clock signal. c. Tap the Polarity and Threshold controls and set the clock signal transition to detect and threshold level, respectively. 3. Tap Define Inputs and select the signal sources for the parallel bus. Signal sources can be analog, math, or reference. Tap a signal in the Sources list to add it to the bus list on the left.
-
Page 72: Add A Search
Analog channel operating basics Add a Search Use this procedure to set search criteria and mark a waveform where those events occur. You can search on analog and digital signals, math waveforms, and reference waveforms. You can add searches to different waveforms and multiple searches to the same waveform. -
Page 73: Change Waveform View Settings
Analog channel operating basics 5. To move the waveform to center marks on the display, push the Run/Stop front panel button to stop acquisition, single-tap a Search badge, and tap the < or > Navigation button. Note: Navigation buttons are only functional when the oscilloscope acquisition mode is set to Stop. This opens the Zoom mode and moves the waveform to the previous or next event mark on the waveform. -
Page 74: Display And Configure Cursors
Analog channel operating basics 4. Tap the Help icon on the menu title to open the Waveform View menu help topic for more information on the waveform view parameters. 5. Tap outside the menu to close the menu. Display and configure cursors Cursors are on-screen lines that you can move to take measurements on specific parts of a waveform or between two different waveforms. - Page 75 Analog channel operating basics 5. To further configure cursors, double-tap on either cursor line or the cursor readouts to open the Cursors configuration menu. For example, tap the Cursor type to select the cursors to display, such as Waveform, V Bars, H Bars, and V&H Bars. The cursor configuration menu in the waveform view.
-
Page 76: Using Default Setup
Analog channel operating basics 7. Tap the Help icon on the menu title for more information on the menu settings. 8. To stop showing cursors, open the Cursors configuration menu and set Display to Off. Using Default Setup Use Default Setup to restore instrument settings to their factory defaults. 1. -
Page 77: Delete A Callout
Analog channel operating basics 4. Select the type of callout from the drop-down list. The types of callout available are as follow: Callout Type Description Note Adds a callout as a text. Arrow Adds a callout text with an arrow. Rectangle Adds a callout text with an arrow pointing to a rectangle. -
Page 78: Acquiring Digital Signals
DUT. Always observe the maximum input voltage ratings for input connectors. Connect the P6316 digital logic probe to the instrument. Connect the probe to the signal sources. Use the accessories in the Tektronix Probe Accessory Kit (shipped with the probe) to connect to your DUT. -
Page 79: Advanced Triggering
Advanced triggering Advanced triggering You can check the advanced trigger status in the trigger menu. The menu indicates the trigger type and then shows sources, levels, or any other parameters that are important for the particular trigger type. Triggering concepts User selected trigger conditions are used to capture waveforms for measurement and analysis. -
Page 80: Trigger On A Timeout Event
Advanced triggering 4. Tap Trigger When and select the pulse width condition on which to trigger (> Limit, < Limit, = Limit, ≠ Limit, Outside Range, Inside Range). 5. Set the pulse width time constraints: a. For all trigger when conditions except Outside Range or Inside Range, tap the Time Limit field and use the assigned multipurpose knob to set the pulse width time condition to meet. -
Page 81: Trigger On A Runt Signal Event
Advanced triggering Trigger on a runt signal event Use Runt triggering to locate signal pulses that do not make a full logic level transition. To trigger on a runt event: 1. Double-tap the Trigger badge to open the Trigger configuration menu. 2. -
Page 82: Trigger On A Logic Event
Advanced triggering 7. If Trigger When is set to a limit value, use the Time Limit field to set the runt signal time constraints. Trigger on a logic event Use the Logic trigger to trigger the oscilloscope when the specified logic conditions occur on the inputs. To trigger on a Logic event: 1. -
Page 83: Trigger On A Setup-Hold Event
Advanced triggering Trigger on a setup-hold event Use the Setup & Hold trigger to trigger on a waveform when a data signal changes state inside of a specified setup and hold time, relative to a clock edge. To trigger on a Setup/Hold event: 1. -
Page 84: Set Up Trigger On A Parallel Bus
Advanced triggering 5. Tap the Time Limit field to set the time value for the Trigger When condition. 6. Tap the Upper Threshold field and use the assigned multipurpose knob (or double-tap the field and use the keypad to enter a value) to set the length of setup time that the data signal must be stable before a clock edge occurs. -
Page 85: Set Up Trigger On A Serial Bus
Advanced triggering 4. Tap either the Binary or Hex Data boxes to enter the parallel bus data value, in either Binary or Hexadecimal format, on which to trigger. The number of bits shown depends on the number of sources (channels) in the parallel bus. a. - Page 86 Advanced triggering Settings take effect immediately.
-
Page 87: Setting Waveform Display Parameters
Setting waveform display parameters Setting waveform display parameters Use waveform display controls to set the display mode, persistence, style, and intensity display parameters, and graticule style and intensity. Set waveform display mode (Stacked or Overlay) Use this procedure to change the waveform display mode (Stacked or Overlay). 1. -
Page 88: Set The Graticule Style And Intensity
Setting waveform display parameters 4. Tap the Waveform Intensity field and use the multipurpose knob to set the brightness of all waveforms. Set the graticule style and intensity Use this procedure to set the graticule (display grid) style and intensity. 1. -
Page 89: Mask Testing Waveforms
Mask testing waveforms Mask testing waveforms Mask testing determines how well your signals conform to expected signal quality and provides instant automated statistical analysis. A mask defines a portion of the instrument display that a signal must not enter. Mask testing is supported for analog channels, analog math waveforms, analog reference waveforms, and RF vs. - Page 90 Mask testing waveforms Note: You cannot drag a mask segment from one waveform slice to another while in Stacked display mode. 2. To delete a mask segment: a. Touch and Hold or right-click on the segment to delete. b. Select Delete Segment from the menu. 3.
- Page 91 Mask testing waveforms c. Tap a plus symbol to add a new vertex at that location. The segment is redrawn to show the new vertex. You can continue to add vertices; there is no limit to the number of vertices in a segment. Note: You cannot move vertices while in add/delete vertex mode.
-
Page 92: Edit Mask Segments Using The Mask Definition Menu
Mask testing waveforms c. To exit rotate segment mode, tap outside the mask segment. The instrument returns to normal operation. Edit mask segments using the Mask Definition menu The Mask Definition menu allows you to edit the mask, including moving, changing size, moving individual vertices, adding and deleting vertices. - Page 93 Mask testing waveforms c. Tap the Vertical Center field and enter the height value as units of the current vertical channel settings (volts, amps, and so on). Or double-tap on the field and use the A knob to change the value. The shape immediately changes the vertical center position of the segment.
- Page 94 Mask testing waveforms a. Double-tap on the segment to edit. b. Select Segments under the Mask Defined By options. c. Tap the Edit Vertices panel. d. Select the vertex in the Define Area list that you want to move. Selecting a vertex highlights that vertex on the segment. e.
-
Page 95: Zoom In On Waveforms
Zoom in on waveforms Zoom in on waveforms Use the zoom tools to magnify waveforms to view signal details. Turn on Zoom mode Zoom mode lets you look at a portion of your waveform in greater detail. Enable Zoom mode and touch and drag on-screen to select the area to zoom. -
Page 96: Using Wave Inspector Front-Panel Controls For Zoom
Zoom in on waveforms Using Wave Inspector front-panel controls for zoom Use the Wave Inspector controls to increase or decrease the area of the zoom box and to control the part of the waveform shown in the main Zoom view. 1. -
Page 97: Measurement Configuration
Measurement configuration Measurement configuration After adding a measurement, you can customize the measurement for more precise results by using gating, setting reference levels, adding a filter, limiting the results to view, or adding a label. To customize measurements, double-tap a Measurement badge in the Results bar to open the Measurement configuration menu overview on page 114. -
Page 98: Set Measurement Gates
Measurement configuration • Global causes changes in this panel to be updated in all other measurements that also have Global selected in this panel. When switching from Global to Local: • If a specific measurement has not been set to Local before then no changes are made to any of the values. You can update the parameters. - Page 99 Measurement configuration • If a specific measurement has been set to Local before, then changed back to Global and then again switched to Local, the last used Local values are shown. • Local causes changes in this panel to only effect this measurement. When switching from Local to Global, all fields will update to the current Global parameters.
-
Page 100: Saving And Recalling Information
7. Tap Save to save the screen image to the specified file name, location, and type. Save a waveform to a file Use this procedure to save channel waveform data to a comma-separated values (csv) or Tektronix waveform data (wfm) file, for later analysis or inclusion in reports. -
Page 101: Save Instrument Settings To A File
8. Tap Save to save the waveform to the specified file name, location, and type. Save instrument settings to a file Use this procedure to save instrument settings to a Tektronix setup (.set) file. 1. Tap the File menu and select Save As. -
Page 102: Save Sessions
Saving and recalling information Tap Save Location or Browse to select the location to save the file. a. Tap the Save Location drop down arrow and select the location to save the file from a list of recent save locations. Or double-tap the field and use the virtual keyboard to enter a path to the save location. -
Page 103: Recall A Reference Waveform
Saving and recalling information Recall a reference waveform Use this procedure to recall (load) and display a saved waveform as a Reference waveform. There is no set limit to the number of reference waveforms that you can load and display. 1. -
Page 104: Recall A Session File
Saving and recalling information As you navigate the folders, the files list area shows all files that match the file type selected in the Files of Type field. 5. Select the file to recall, using one of the following methods: •... -
Page 105: Menus And Dialog Boxes
Menus and dialog boxes Menus and dialog boxes All of the menus on your instrument and the available settings within each menu. Act On Event configuration menu Use this configuration menu to set the actions the instrument takes when specified conditions are met (trigger event, measurement limit failure, mask hit failure, and so on). -
Page 106: Add Measurements Configuration Menu Overview
Menus and dialog boxes Field or control Description Save Screen Capture Saves the screen image at the time of the event, to the format designated in the Save Configuration panel. Save Waveform Saves the waveform data at the time of the event, to the format designated in the Save Configuration panel. -
Page 107: The Standard Measurements Tab
Menus and dialog boxes Add Measurements menu fields and controls Field or control Description Measurement tabs The tabs organize measurements by their type. The Measurement tab is the default set of Amplitude and Time measurements that are built in to the instrument. Measurement description Shows a graphic and short description of the selected measurement. - Page 108 Menus and dialog boxes The Amplitude Measurements panel measurements Measurement Description AC RMS The true Root Mean Square voltage, minus any DC component, of the waveform data points that are above the Mean signal level. You can take this measurement on each cycle in the waveform record or on the entire waveform record.
-
Page 109: Time Measurements Panel
Menus and dialog boxes Time Measurements panel Use the Time Measurements panel to add timing-related measurements to the Results bar. Time measurements can be taken on time-domain analog, math, and reference waveforms. Timing measurements can also be taken on some digital channel signals. To open the Time Measurements panel: 1. - Page 110 Menus and dialog boxes Measurement Description Low Time The time the signal remains below the Base reference level. The measurement is taken on each cycle in the waveform record. Negative Duty Cycle The ratio of the negative pulse width to the signal period, expressed as a percentage. The duty cycle is measured on the first cycle in the measurement region.
-
Page 111: The Fra Tab
Menus and dialog boxes Measurement Description Unit Interval The time difference between two successive bits. The measurement is taken on each bit of the waveform record. See also Measurement configuration menu overview on page 114 The FRA tab The FRA tab lists the optional FRA-related measurement that you can add to the Results bar. Note: The FRA tab opens if the 2-SOURCE or the 2-ULTIMATE license options is installed. - Page 112 Menus and dialog boxes Field or control Description Connection When Generator is set to External, Connection opens the AFG configuration menu. Enter the IP address and tap Test Connection to connect to the signal generator. Impedance A user configurable Impedance for the generator. Sets the impedance as 50 Ω or High Z. Points Per Decade Sets the number of frequency points between the start and stop frequency in terms of log scale.
-
Page 113: Configure Profile
Menus and dialog boxes Controls Description Delete Power 1 Deletes the selected power measurement badge. Configure Profile Use the Configure Profile menu to configure the amplitude profile for the Control Loop Response (Bode) measurement. It is recommended to customize the internal signal generator amplitude values using the amplitude profile configuration. Profiling allows you to set the generator to a lower amplitudes, at different frequencies where the DUT is sensitive, and set the higher amplitudes where the DUT is less sensitive to distortion. -
Page 114: Connect To An External Signal Generator
Menus and dialog boxes Start Stop Amplitude 100 kHz 1 MHz 300 mV 1 MHz 10 MHz 250 mV 10 MHz 20 MHz 200 mV Note: The maximum stop frequency value for the internal signal generator is 50 MHz. Connect to an external signal generator Use the Generator Connection Information menu to connect to a signal generator. -
Page 115: Measurement Name Panel (Measurement Configuration Menu)
Menus and dialog boxes Measurement configuration menu fields, controls, and panels Field, control, or panel Description Measurement Statistics A list of measurement statistics related to the measurement. You can add these statistics to a measurement badge by selecting the Show Statistics in Badge control. (Measurement name panel) Show Statistics in Badge Adds the listed statistical measurement readouts to the measurement badge readout. -
Page 116: Configure Panel (Measurement Configuration Menu)
Menus and dialog boxes Gating panel (Measurement configuration menu) on page 118 Pass/Fail Testing panel (Measurement Settings menu) on page 119 Configure panel (Measurement configuration menu) Use the Configure panel to set the measurement source(s), add a custom name (label) for the measurement, and other parameters. To open the Configure panel: 1. - Page 117 Menus and dialog boxes Reference Levels panel- fields and controls Not all items listed in the table are shown for all measurements; The panel only shows fields and controls relevant to the selected measurement. Field or control Description Reference Levels Global sets whether the reference levels defined in this measurement apply to all measurements that are set to global (the default setting).
-
Page 118: Gating Panel (Measurement Configuration Menu)
Menus and dialog boxes Gating panel (Measurement configuration menu) Use Gating to confine a measurement to a certain part of a waveform. To open the Gating panel: 1. Double-tap a Measurement badge in the Results bar to open the Measurement configuration menu. 2. -
Page 119: Pass/Fail Testing Panel (Measurement Settings Menu)
Menus and dialog boxes • Time gates can be placed anywhere. They can precede acquisition start value and extend beyond the acquisition value. • The Time Gating bars are shown in both the overview and zoomed view when zoom is on. See also Measurement Name panel (Measurement configuration menu) on page 115... -
Page 120: Add Plot Configuration Menu
Menus and dialog boxes Gating panel (Measurement configuration menu) on page 118 Add Plot configuration menu Use this configuration menu to select and plot the amplitude and time relationship of two (XY) signals, which can be sourced from channel, math, or reference waveforms. To add a plot: 1. -
Page 121: Frequency Response Analysis (Fra) Results Table Configuration Menu
Menus and dialog boxes • To configure or delete a single measurement in a Measurement Results table, touch and hold on a table row to open a right-click menu that lets you configure or delete that measurement. • You cannot sort the contents of a column. See also Measurement Table configuration menu on page 122... -
Page 122: Measurement Table Configuration Menu
Menus and dialog boxes Field or control Description Browse Tap to open the Browse Save As Location dialog, to navigate to and select the location to save the file. Browse Save As Location configuration menu on page 184. File Name Enter the file name. -
Page 123: Save As Configuration Menu (Measurement Results Table)
Menus and dialog boxes • To configure or delete a single measurement in a Measurement Results table, touch and hold on a table row to open a right-click menu that lets you configure or delete that measurement. • If you add or delete a measurement to the Results bar, that measurement is automatically added to or deleted from an existing Measurement Results table. - Page 124 Menus and dialog boxes Search Results Table menu Field or control Description Table Settings Location Timestamp Sets the search mark timestamp resolution to display. The timestamp shows the time of each mark Resolution relative to the first acquired search mark. Short shows a rounded version of the timestamp data.
-
Page 125: Save As Configuration Menu (Search Results Table)
Menus and dialog boxes Save As configuration menu (Search Results table) Use this configuration menu to set the location and file name to which to save the contents of a results table, as a comma-separated value (csv) format file. 1. Double-tap anywhere in the Search Results table to open the Search Results configuration menu. 2. -
Page 126: Save As Configuration Menu (Bus Decode Results Table)
Menus and dialog boxes Bus Decode Results Table operations • Each bus in a Bus Decode Results table has its own tab. Tap a tab to show the results for that bus. • Selecting a Bus in the Bus Decode Table configuration menu does not select and display the tab for that bus. Select a tab before configuring the table for that tab. -
Page 127: Bus Configuration Menu
Menus and dialog boxes Bus configuration menu Use the Bus menu to select the bus type to display, configure the input sources, and set how to display the bus on the screen. To open the Bus configuration menu: • For an existing bus, double-tap the Bus badge in the Settings bar. To add a new Bus badge on the Settings bar, tap the Math Ref Bus >... - Page 128 Menus and dialog boxes • To create a new parallel bus, tap the Math Ref Bus > Add New Bus button on the Settings bar. Open the bus configuration menu by double clicking on the badge. Set the Bus Type to Parallel. •...
-
Page 129: Parallel Bus - Define Inputs Menu
Menus and dialog boxes Parallel Bus - Define Inputs menu Use this menu to select the signal sources and order for the parallel bus waveform To access the Parallel Bus - Define Inputs menu, double-tap a Parallel Bus badge to open the configuration menu, and tap the Define Inputs button. -
Page 130: Spi Serial Bus Configuration Menu
Menus and dialog boxes I2C serial bus menu fields and controls Field or control Description Display Turns On or Off displaying the bus on the Waveform view. Label Enter a label for the bus. The default label is the selected bus type. To enter label text, double-tap the field and enter label using the virtual keyboard, or tap the field and enter text from an attached keyboard. - Page 131 Menus and dialog boxes SPI serial bus menu fields and controls Field or control Description Display Turns On or Off displaying the bus on the Waveform view. Label Enter a label for the bus. The default label is the selected bus type. To enter label text, double-tap the field and enter label using the virtual keyboard, or tap the field and enter text from an attached keyboard.
-
Page 132: Rs232 Serial Bus Menu
Menus and dialog boxes Field or control Description Display Format Sets the waveform view to show just the decoded bus information, or the decoded bus plus the source signal waveforms. This depends on data input. Available only when Data Input is One. Decode Format Sets the decode format used to display the bus information. -
Page 133: Can Serial Bus Configuration Menu
Menus and dialog boxes Field or control Description Data Bits Set the number of bits that define a data packet for your RS232 bus. Source Set the signal source from available analog or digital channels. Available when Data inputs is One. Threshold Set the threshold level to define a logic high level. - Page 134 Menus and dialog boxes CAN serial bus menu fields and controls Field or control Description Display Turns on or off displaying the bus on the Waveform view. Label Enter a label for the bus. Default standard label is the selected bus type. To enter label text, double-tap the field and enter label using the virtual keyboard, or tap the field and enter text from an attached keyboard.
- Page 135 Menus and dialog boxes Field or control Description XL Bit Rate Sets the data rate for Data Transfer mode. To enter a custom bit rate, select Custom and enter the custom bit rate in the Custom Rate input box. This control is available when CAN Standard is set to CAN XL or CAN 2.0 + FD (ISO) + XL. Custom rate Sets the custom bit rate to use to decode the signal.
-
Page 136: Lin Serial Bus Configuration Menu
Menus and dialog boxes LIN serial bus configuration menu Use this menu to set up and display a LIN (Local Interconnect Network) serial bus waveform. To set up the LIN serial bus: To create a new LIN bus waveform, tap the Math Ref Bus > Add New Bus button on the Settings bar. Open the bus configuration •... -
Page 137: Sent Serial Bus Configuration Menu
Menus and dialog boxes LIN serial bus search configuration menu on page 148 SENT serial bus configuration menu Use the SENT bus menu to set up and display a SENT (Single Edge Nibble Transmission) serial bus waveform. • To add a new SENT bus waveform 1. -
Page 138: Search Configuration Menu Overview
Menus and dialog boxes Field or control Description Slow Channel Sets the slow channel characteristics. Tap and select from the available list of slow channel types. The default value is None. Display Format Sets the display format for waveforms as Bus or Bus and Waveform. Bus sets the waveform view to display just the decoded bus information. -
Page 139: Bus Search Configuration Menus
Menus and dialog boxes Setup and Hold Search configuration menu on page 158 Timeout Search configuration menu on page 160 Bus Search configuration menus Use a Bus search to search for and mark bus-related events (Start, Stop, Missing Acq, Address, Data, and so on) on a bus waveform. To create a new Bus search: 1. -
Page 140: I2C Serial Bus Search Configuration Menu
Menus and dialog boxes Field or control Description Act on Event Tap the Act on Event button to configure the actions the instrument must take when a search event occurs. See Act On Event configuration menu on page 105 for the available fields and controls. Results Table Sets the results table as On or Off to see the active measurements, bus decode activity, and search results in a spreadsheet format. -
Page 141: Spi Serial Bus Search Configuration Menu
Menus and dialog boxes Field or control Description Addressing Mode Sets the slave device address length (7 bits or 10 bits long). Available when Mark On is Address or Address & Data. Address Sets the address pattern for which to search. The number of bits shown depends on the Address Mode setting. -
Page 142: Serial Bus Search Configuration Menu
Menus and dialog boxes Field or control Description Source Select the SPI bus that you want to search. Mark On Select the type of information for which to search. Search Source Set the search source. Set either MOSI or MISO. Available when Mark On is SS Active. -
Page 143: Can Serial Bus Search Configuration Menu (When Not Using A .Dbc Symbol Definition File)
Menus and dialog boxes Field or control Description Data Bytes Sets the number of data bytes (1 byte = 8 bits) for which to search (one to ten bytes). Use the A knob to change the value. Available when Mark On is Data. Data Sets the data pattern for which to search. - Page 144 Menus and dialog boxes Field or control Description Mark On Sets the type of information for which to search and mark on the bus waveform acquisition. Start of Frame sets a search mark at each occurrence of a CAN frame start. Type of Frame sets a search mark at each occurrence of the frame type as set in the Frame Type field.
-
Page 145: Can Serial Bus Search Configuration Menu (When Using A .Dbc Symbol Definition File)
Menus and dialog boxes Field or control Description Data Sets the data pattern for which to search. The number of bits shown depends on the Data Bytes setting. Tap the Binary or Hex field and use the A and B knobs to select and change the values. Or double-tap on the field and use the virtual keypad to enter values. - Page 146 Menus and dialog boxes Field or control Description Symbolic Sets the search for each occurrence of a specified message or signal condition as defined by an installed .dbc symbol definition file. This search setting is available when the Decode Format is set to Symbolic from CAN bus configuration menu.
-
Page 147: Can Dbc Symbolic Configuration Menu
Menus and dialog boxes Field or control Description Error Type Sets the error type for which to search and mark on the bus waveform. (Missing Ack, Bit Stuffing, or Any Error. Available when CAN Standard is in CAN 2.0 + FD (ISO) + XL, CAN 2.0, or CAN FD (ISO) from CAN bus configuration menu and Mark On is set to Error. -
Page 148: Lin Serial Bus Search Configuration Menu
Menus and dialog boxes LIN serial bus search configuration menu Use the LIN Search configuration menu to define conditions to search for and mark on an LIN bus waveform. You can have multiple searches on the same bus. Field or control Description Display Enables or disables displaying search marks on this search. -
Page 149: Sent Serial Bus Search Configuration Menu
Menus and dialog boxes Bus Search configuration menus on page 139 LIN serial bus configuration menu on page 136 SENT serial bus search configuration menu Use the SENT Search configuration menu to define conditions to search for and mark on an SENT bus waveform. You can have multiple searches on the same bus. - Page 150 Menus and dialog boxes Field or control Description Inverted Nibble Sets the value of the inverted nibble data for which to search. Tap the Binary or Hex field and use the A and B knobs to select and change the values. Or double-tap on the field and use the virtual keypad to enter values.
-
Page 151: Configure Pattern Editor
Menus and dialog boxes Configure pattern editor Use the pattern editor keypad to configure the pattern for the data or custom. To open the pattern editor, double-tap inside a Data/Custom field that requires alphanumeric values. Data Pattern Editor Table 4: Data Pattern Editor fields and controls Keys Description Entry field... -
Page 152: Logic Search Configuration Menu
Menus and dialog boxes 3. Select the search Source. 4. Use the menu fields to set the search parameters. To change the settings on an existing search, double-tap the search badge and make necessary changes. Edge Search configuration menu fields and controls Field or control Description Display... - Page 153 Menus and dialog boxes 3. Use the menu fields to set the search parameters. To change the settings on an existing search, double-tap the search badge and make necessary changes. Logic Search configuration menu fields and controls Field or control Description Display Sets the display of the mark icons to either On or Off.
-
Page 154: Logic Search - Define Inputs Configuration Menu
Menus and dialog boxes Field or control Description Copy Search Settings to Sets the current oscilloscope trigger settings to match the search criteria. Trigger Other search types Bus Search configuration menus on page 139 Edge Search configuration menu on page 151 Pulse Width Search configuration menu on page 154 Rise/Fall Time Search configuration menu... - Page 155 Menus and dialog boxes To change the settings on an existing search, double-tap the search badge and make necessary changes. Pulse Width Search menu fields and controls Field or control Description Display Sets the display of the mark icons to either On or Off. If you have multiple searches defined, the control turns off just the marks for the selected search.
-
Page 156: Rise/Fall Time Search Configuration Menu
Menus and dialog boxes Runt Search configuration menu on page 157 Setup and Hold Search configuration menu on page 158 Timeout Search configuration menu on page 160 Rise/Fall Time Search configuration menu Use the Rise/Fall Time search to mark occurrences where the rise or fall time is less than, greater than, equal to, or not equal to a specified time limit. -
Page 157: Runt Search Configuration Menu
Menus and dialog boxes Other search types Bus Search configuration menus on page 139 Edge Search configuration menu on page 151 on page 152 Logic search configuration menu on page 154 Pulse Width Search configuration menu Runt Search configuration menu on page 157 Setup and Hold Search configuration menu on page 158... -
Page 158: Setup And Hold Search Configuration Menu
Menus and dialog boxes Field or control Description Polarity Sets the polarity of the pulse to detect (positive pulse only, negative pulse only, or a positive or negative pulse). Time Limit Sets the time period condition to be met. Available only when Mark When = < Limit, > Limit, = Limit, or != Limit. Upper Threshold Sets the upper amplitude level through which the signal must pass to be considered a valid transition. -
Page 159: Setup And Hold Search - Define Inputs Configuration Menu
Menus and dialog boxes Field or control Description Results Table Sets the results table as On or Off to see the active measurements, bus decode activity, and search results in a spreadsheet format. Default is off. Stop Acquisition if Event Stops input acquisition when the search event occurs. -
Page 160: Timeout Search Configuration Menu
Menus and dialog boxes Setup and Hold Search - Define Inputs configuration menu fields and controls Field or control Description Ch(x) (analog channels) or Use to add (Include) or exclude (Don't Include) the data signal(s) from available input channels and D(x) (digital Channels waveforms. -
Page 161: Analog Channel Configuration Menu
Menus and dialog boxes Field or control Description Threshold Sets the amplitude level that the signal must pass through to be considered a valid transition. Set to 50% Sets the threshold at 50% of the measured signal transition range. 50% is calculated as (Top + Bottom)/2. -
Page 162: Invert Channel Guidelines
Menus and dialog boxes Probe Setup panel (Channel configuration menu) Use the Channel configuration menu Probe Setup panel to setup probe, deskew. To open the Probe Setup panel: 1. Double-tap an analog Channel badge on the Settings bar to open the Channel configuration menu. 2. -
Page 163: Afg Configuration Menu
Menus and dialog boxes • The channel Vertical Position value does not change • The Trigger level knob rotation direction does not change Invert and Setup, Autoset, and Default functions The invert state is saved and recalled correctly as part of Setup and Session files •... - Page 164 Menus and dialog boxes Field or control Description Symmetry Sets the symmetry of the ramp using the keypad or multipurpose knob. Available when the Waveform Type is Ramp. Width Sets the width of the pulse using the keypad or multipurpose knob. Available when the Waveform Type is Pulse.
-
Page 165: Cursor Configuration Menu
Menus and dialog boxes Cursor configuration menu Cursors are on-screen lines (bars) that you position in a Waveform or Plot views to take manual measurements on signals. They appear as horizontal and/or as vertical lines. To open the Cursors configuration menu: 1. -
Page 166: Date And Time Configuration Menu
Menus and dialog boxes Field or control Description Source Tap to select the source waveform from the drop-down list. Selected Waveform automatically moves the waveform cursors to the selected source or select a specific source from the drop-down list. Available when Source Waveform is Same. All is available in Source drop-down list only when the Cursor Type is set to Waveform. -
Page 167: Digital Channel Configuration Menu
Menus and dialog boxes Note: You cannot set a specific time; the time is preset at the factory. Digital channel configuration menu Use the digital channel menu to enable individual digital channels, set their thresholds (individually or as a group), and add labels. To open the digital channel configuration menu, double-tap a digital channel badge. - Page 168 Menus and dialog boxes Field or control Description Minimum Sample Rate Sets the minimum sample rate for acquisitions. Changing horizontal scale will not reduce the sample rate below this value. This can result in partial waveform records at lower frequencies, but at the same time would provide more sample points for a few cycles of the signal.
-
Page 169: Acquisition Configuration Menu
Menus and dialog boxes Acquisition configuration menu Use this configuration menu to set which data points are used to acquire waveforms, and enable automatically saving acquisitions to files. The Acquisition menu fields and controls To open the Acquisition menu, double-tap the Horizontal, tap the Acquisition Settings on the Settings bar. Displayed fields and controls can change depending on menu selections. -
Page 170: Mask Badge Configuration Menu
Menus and dialog boxes 2. Tap Zoom on the DRAW A BOX window to enable drawing a zoom box area on the screen. The mode stays in Zoom mode until changed. 3. Tap Mask on the DRAW A BOX window to enable drawing Mask Testing segments on the screen. The mode stays in Mask mode until changed. - Page 171 Menus and dialog boxes Mask Settings panel fields and controls Field or control Description Mask Defined By Define the way you edit the mask. The default option is Segments. Shape Lists the current shape type, and also lets you change the current shape to a specified shape. Changing a shape defines the minimum rectangle that includes all vertices of the current segment, and then does a best-fit approach to create the specified shape.
- Page 172 Menus and dialog boxes Field or control Description Horizontal Center Sets the segment horizontal center, as time units, as the point halfway between the leftmost vertex and rightmost vertex. Flip Horizontal Flips the segment horizontally around its Horizontal Center value. Rotate Rotates the segment in units of degrees, from 0°...
-
Page 173: Right Click Menu Functions Associated With Mask Segments
Menus and dialog boxes Field or control Description Insert Point Inserts a new row above the selected row and creates a new vertex on the segment shape. The new vertex is halfway between the vertices defined in the prior row and the following row in the table. Delete Point Deletes the currently selected point, keeps the row selected, and moves all rows below it up one row. -
Page 174: Mask Test Badge Configuration Menu
Menus and dialog boxes Field or control Description Rectangle Sets the shape of the mask to a rectangle Trapezoid Sets the shape of the mask to a trapezoid. Hexagon Sets the shape of the mask to a hexagon. Custom Sets the shape of your choice. Create Duplicate Creates a new segment with the same characteristics. -
Page 175: Right Click Menu Functions Associated With The Mask Test Badge
Menus and dialog boxes Field or control Description Act on Event Tap the Act on Event button to configure the actions the instrument must take when a Mask event occurs (Pass, Fail, or Hits). See Act On Event configuration menu on page 105 for the available fields and controls. - Page 176 Menus and dialog boxes Field or control Description Auto Scale Toggles Auto Scale mode on or off. Auto Scale calculates the vertical scale and position to center and display the entire waveform. Available when Math Type is Basic or Advanced. Label Enter a label for the math waveform.
-
Page 177: Equation Editor (Math Configuration Menu)
Menus and dialog boxes Field or control Description Math n = Lists the last-accessed advanced equation. Tap the down arrow to display a list of the last-accessed equations (up to a maximum of 20) created by the Equation Editor. Select an equation to display that math waveform. -
Page 178: Add Functions (Math Equation Editor)
Menus and dialog boxes Field or control Description Arrows Use to move the cursor position in the Math <x> = equation field. Space Use to add the space to the right of the cursor. Delete Deletes the selected part of the equation (recommend that you use a mouse to more easily select equation text). -
Page 179: Menu Bar Overview
Menus and dialog boxes Button Description Natural logarithm. Inserts the text LN( into the math expression. The natural logarithm function produces the natural logarithm of the argument. Natural antilog. Inserts the text EXP( into the math expression. The EXP function produces the natural antilog of the argument. -
Page 180: Recall Configuration Menu (File Menu)
Menus and dialog boxes Recall configuration menu (File menu) Use this menu to recall (load) reference waveforms, instrument setups, mask settings, and sessions (setup plus waveforms). The supported file formats are .wfm, .trc, .isf, .tr0, .wfmx, .set, .tss, .msk, .xml, .bin, and .csv. Recall the file using Recall configuration menu. -
Page 181: Save As Configuration Menu (File Menu)
Menus and dialog boxes Field or control Description Files of type Use to select the file format you want to open. The drop-down list shows all file extension types that the instrument can read for the selected file type. Cancel Cancels the file open action and closes the configuration menu. - Page 182 Menus and dialog boxes Field or control Description Auto Increment File Name Select to enable auto-incrementing of the file name. Auto increment adds a number count to the end of the file name, and increments it on each subsequent saving of the same file name. Count Sets the increment count start number.
- Page 183 Menus and dialog boxes Field or control Description Gating Sets the method to save a specified part of the waveform data. None saves the full waveform data (default). Cursors saves the waveform data located between the vertical cursors. If cursors aren't on when selecting cursor gating, the cursors are activated.
-
Page 184: Browse Save As Location Configuration Menu
Menus and dialog boxes A session is a zipped file that contains an instrument setup file and all acquired waveform data. Use session file contents to move analysis activities to a PC and free up the instrument for others to use. Field or control Description File save type... -
Page 185: File Utilities Configuration (File Menu)
Menus and dialog boxes Field or control Description Use to create a new directory (folder) at the current location. Opens the new directory after it is created. Cancel Cancels the file path change, closes the configuration menu, and returns to the Save As configuration menu. -
Page 186: Mount Drive Configuration Menu
Menus and dialog boxes Field or control Description Use the arrow buttons to navigate the file directory. The left arrow navigates back to the previously visited folder. The Right arrow navigates forward to the previously visited folder. The Up arrow navigates up one level from the current folder. Use to create a new directory (folder) at the current location. - Page 187 Menus and dialog boxes Field or control Description Specify Server Sets how you specify the server location; by server Name or IP address. Server Name The server name is associated with the remote drive. Double-tap the field and enter the server name. Server IP Address The IP address of the server.
-
Page 188: Undo, Redo (Edit Menu)
Menus and dialog boxes Field or control Description OK, Mount TekDrive Select to confirm the configuration to complete the TekDrive mounting. This will make sure all the file browsers in the application show the connected TekDrives in it for saving or recalling files to TekDrive. - Page 189 Menus and dialog boxes Field or control Description Backlight Sets the intensity of the backlight. Auto-Dim Select On to automatically dim the screen backlight after a specified time. Time Sets the amount of time to wait before the display is dimmed. Tap in the field and use the knob to change the time value, or double-tap to open the virtual keypad and set a time value.
- Page 190 Menus and dialog boxes Field or control Description Measurement Interpolation Interpolation defines how the waveform is drawn between waveform record data points. Tap and select the measurement interpolation method. Auto selects the best interpolation method. Sin(x)/x interpolation computes record points using a curve fit between the actual samples acquired. Linear interpolation computes record points between actual acquired samples by using a straight line fit.
-
Page 191: Connected Oscilloscope Preferences
When the check box is enabled in Connected Scope Preferences dialog: You agree that the software may contact Tektronix servers periodically. You also agree that the instruments model and serial number and status of the enabled check boxes will be sent to Tektronix. -
Page 192: Define Custom Colors Menu
Menus and dialog boxes Define Custom Colors menu Use this menu to change the colors used to display channel, math, and reference waveforms in the Waveform view. You can set custom waveform colors for both Normal and Inverted display modes. To open the Define Custom Colors menu: 1. -
Page 193: I/O (Utility Menu)
Menus and dialog boxes I/O (Utility menu) Use this configuration menu to set up a LAN, USB Device Port, Socket Server, and AUX OUT signal parameters. To open the I/O menu: 1. Tap the Utility menu. 2. Tap I/O..Entering and applying LAN network changes When first opening the I/O menu LAN panel, the Network Address is set to Auto (default setting) and the Apply Changes button is grayed out (inactive) in the LAN panel. - Page 194 Menus and dialog boxes Field or control Description Test Connection Tap to test the connection. If the connection test is successful, then OK is displayed. If the test is unsuccessful, then No Response is displayed. LAN Reset Tap to display the LAN Reset configuration menu (Utility >...
-
Page 195: Lan Reset Configuration Menu (Utility > I/O Menu)
You can type in more queries and view more results using this Telnet session window. You can find the syntax for relevant commands, queries and related status codes in the Programmer Manual that is available at the Tektronix website. Note: Do not use the computer’s backspace key during an MS Windows Telnet session with the oscilloscope. -
Page 196: Self Test Configuration Menu (Utility Menu)
If one or more tests fail at power-on, tap on Run Self Test and see if the test or tests continue to fail. If tests continue to fail, contact your nearest Tektronix Service Center for help with resolving the problem. -
Page 197: Security Configuration Menu
Calibrated. If an instrument becomes uncalibrated, this displays an Uncalibrated status and a red Warning message bar is shown at the top of the screen in the Menu bar area. Contact your nearest Tektronix Service Center for assistance. -
Page 198: Teksecure Erase Memory
CAUTION: If you need to send the instrument for service or repair, make sure to use the Clear Password function in the Change Password menu before sending to the Tektronix Service Center. Failure to do so may impede servicing the instrument. -
Page 199: Set Password Configuration Menu
CAUTION: If you need to send the instrument for service or repair, make sure to use the Delete Password function in the Change Password menu before sending to the Tektronix Service Center. Failure to do so may impede servicing the instrument. -
Page 200: Change Password Configuration Menu
Passwords and sending the instrument for service CAUTION: If you need to send the instrument for service or repair, make sure to use the Delete Password function before sending to the Tektronix Service Center. Failure to do so may impede servicing the instrument. Demo (Utility menu) Use this menu to access demonstrations of key oscilloscope features. -
Page 201: Help
Description System information Provides system-related information such as model, bandwidth, serial number, Host ID, and installed firmware version. Provide this information when communicating with Tektronix to purchase option licenses or communicate with Customer Support. Installed Options Lists installed options. Click on an item in the list to show details of the option in the Option Details area below the list. -
Page 202: Location To Save Exit Key Configuration Menu
Menus and dialog boxes Field or control Description Install License Tap this button to open the Browse License Files dialog to navigate to and select an option license file to install. You can navigate to the TekDrive location to install saved license files. See Browse License Files menu (Help >... -
Page 203: Browse License Files Menu (Help > About)
Menus and dialog boxes Field or control Description File Name Lists the selected license file name to return (uninstall). Tap the down arrow icon on the right end of the field to open a list of uninstalled license files, up to a maximum of 20. -
Page 204: Font Color Menu (Text Settings Configuration)
Menus and dialog boxes Field or control Description Use the arrow buttons to navigate the directory structure. The left arrow navigates back to the previously visited folder. The Right arrow navigates forward to the previously visited folder. Use to create a new directory (folder) at the current location. Opens the new directory after it is created. -
Page 205: Pattern Generator Configuration Menu
Menus and dialog boxes Field or control Description Tap to toggle text bolding On or Off. Tap to toggle text italics On or Off. Tap to toggle text underlining On or Off. Pattern Generator configuration menu The pattern generator provides output of a predefined pattern up to bit rate 25 Mb/s. Choose a bit pattern manually, you can select a predefined pattern, or load a saved .csv-format pattern from storage (USB drive, a network drive, or TekDrive on instruments). -
Page 206: Plot Configuration Menus
Menus and dialog boxes • Each column header in the file indicates the column of data to be generated from a corresponding pin. If there are no column headers are present, b0, b1, b2, b3 are added by default. The bits can be in any order as long as column headers are provided. •... -
Page 207: Save As Configuration Menu (Plot Save Panel, Save Plot Image Button)
Menus and dialog boxes Save As configuration menu (plot Save panel, Save Plot Image button) Use this menu to specify the name and location at which to save an image file for the selected plot. To access the Save As configuration menu to save an image of a plot to a file: 1. -
Page 208: Control Loop Response (Bode) Plot Configuration Menu
Menus and dialog boxes Save As configuration menu (plot Save panel, Save Plot Data button) fields and controls Field or control Description Save Location Lists the location where the file will be saved. The default value is the last location to which a file was saved. -
Page 209: Reference Waveform Configuration Menu
Menus and dialog boxes Field or control Description Interpolation Select the method to display the record points between sampled points. Sin(x)/x connects using a Sin(x)/x curve between the computed values. This makes the gain or phase curve smoother than linear interpolation. Linear connects between computed points (Gain or Phase value) using a straight-line fit. -
Page 210: Recall Configuration Menu (Ref Waveform Configuration Menu)
Menus and dialog boxes Field or control Description Vertical Scale Set the vertical scale by using the assigned multipurpose knob, a virtual keypad, or tap the up or down arrows. Label Adds a label to the waveform. Tap and enter text using a keyboard, or double-tap to open the virtual keyboard. -
Page 211: Search Configuration Menu
Menus and dialog boxes Field or control Description The Drive column lists the directory structure, including any network-connected drives. Use to quickly navigate to a location. Tap to list the contents of the directory in the file list area. Double-tap an item, or tap the small arrow to the left of the directory, to display the subdirectories under it. -
Page 212: Trigger Configuration Menu Overview
Menus and dialog boxes Pulse Width Search configuration menu on page 154 Rise/Fall Time Search configuration menu on page 156 Runt Search configuration menu on page 157 Setup and Hold Search configuration menu on page 158 Timeout Search configuration menu on page 160 Trigger configuration menu overview Use the Trigger menu to define the channel or waveform signal conditions on which to trigger the oscilloscope. - Page 213 Menus and dialog boxes Field or control Description Source Lists the source channel. Internal source (Edge trigger): This provides a 60 Hz trigger source that can cause the oscilloscope to trigger 60 times per second. AUX In: The AUX In (auxiliary) edge trigger source provides an extra trigger signal source when you need to use the input channels for other signals.
-
Page 214: Pulse Width Trigger Configuration Menu
Menus and dialog boxes Pulse Width Trigger configuration menu Use the Pulse Width Trigger to trigger on specific pulse width conditions, including when a pulse width is within or outside a range of specified times. To open the Pulse Width trigger configuration menu: 1. -
Page 215: Timeout Trigger Configuration Menu
Menus and dialog boxes Timeout Trigger configuration menu Use the Timeout Trigger to trigger on a waveform when an expected signal does not transition within a specified period of time, such as when a signal gets stuck either high or low. To open the Timeout trigger menu: 1. -
Page 216: Logic Trigger Configuration Menu
Menus and dialog boxes Field or control Description Trigger When • Occurs: A runt signal event occurs. • < Limit: A runt signal event occurs that has a pulse width less than the specified time limit. • > Limit: A runt signal event occurs that has a pulse width greater than the specified time limit. •... -
Page 217: Logic Trigger - Define Inputs Configuration Menu
Menus and dialog boxes Field or control Description Trigger When Defines the waveform condition on which to trigger. Goes True: All conditions change to a true state. (Use Clock Edge = No) • • Goes False: All conditions change to a false state. •... -
Page 218: Setup And Hold Trigger Configuration Menu
Menus and dialog boxes Logic Trigger - Define Inputs configuration menu fields and controls Field or control Description Ch(x) (analog channels) or Use to select the signal sources logic condition on which to perform the logic search (High, Low, Don't D(x) (digital Channels Care). -
Page 219: Setup And Hold Trigger - Define Inputs Configuration Menu
Menus and dialog boxes Setup and Hold Trigger - Define Inputs configuration menu Use this menu to set the input signals and their threshold levels for the Setup & Hold trigger. To open the Setup & Hold Trigger - Define Inputs dialog: 1. -
Page 220: Bus Trigger Configuration
Menus and dialog boxes Other trigger types • Bus Trigger Menu • Edge Trigger menu • Logic Trigger menu • Pulse Width Trigger menu • Runt Trigger menu • Setup and Hold Trigger menu • Timeout Trigger menu Bus Trigger configuration Use the Bus trigger menus to trigger on bus-related events (Start, Stop, Missing Ack, Address, Data, and so on). - Page 221 Menus and dialog boxes Field or control Description Type of Frame Sets the frame type for which to trigger. This trigger setting is available when CAN Standard is CAN XL or CAN 2.0 + FD (ISO) from the CAN Bus configuration menu. Frame Type Sets the frame type on which to trigger.
-
Page 222: I2C Serial Bus Trigger Settings Panel
Menus and dialog boxes Field or control Description BRS Bit Sets the Bit Rate Switch (BRS) bit state on which to trigger. This trigger setting is available when Trigger On is set to FD Bits. ESI Bit Sets the Error Status Indicator (ESI) bit state on which to trigger. This trigger setting is available when Trigger On is set to FD Bits. - Page 223 Menus and dialog boxes Field or control Description Direction Sets the transfer direction on which to trigger (Read, Write, Either). Available when Trigger On is Address. Addressing Mode Sets the slave device address length (7 bits or 10 bits long). Available when Trigger On is Address or Address &...
-
Page 224: Lin Serial Bus Trigger Settings Panel
Menus and dialog boxes Field or control Description Act on Trigger Tap the Act on Trigger button to configure the actions the instrument must take when a trigger event occurs. Act On Event configuration menu on page 105 for the available fields and controls. LIN serial bus trigger settings panel Field or control Description... -
Page 225: Parallel Serial Bus Trigger Settings Panel
Menus and dialog boxes Mode & Holdoff panel (Bus Trigger configuration panel) fields and controls Field or control Description Trigger Mode The trigger mode determines how the instrument behaves in the absence or presence of a trigger event: Auto trigger mode enables the instrument to acquire and display a waveform even if a trigger does not occur. -
Page 226: Rs-232 Serial Bus Trigger Settings Panel
Menus and dialog boxes Mode & Holdoff panel (Bus Trigger configuration panel) fields and controls Field or control Description Trigger Mode The trigger mode determines how the instrument behaves in the absence or presence of a trigger event: Auto trigger mode enables the instrument to acquire and display a waveform even if a trigger does not occur. -
Page 227: Sent Serial Bus Trigger Settings Panel
Menus and dialog boxes Mode & Holdoff panel (Bus Trigger configuration panel) fields and controls Field or control Description Trigger Mode The trigger mode determines how the instrument behaves in the absence or presence of a trigger event: Auto trigger mode enables the instrument to acquire and display a waveform even if a trigger does not occur. - Page 228 Menus and dialog boxes Field or control Description Fast Channel 2 Sets the condition and value of the fast channel 2 data on which to trigger. Tap the down arrow and select the condition on which to trigger (=, ≠, >, <, ≥, ≤). The default is =. Tap the Binary or Hex field and use the A and B knobs to select and change the values.
-
Page 229: Spi Serial Bus Trigger Settings Panel
Menus and dialog boxes Field or control Description Act on Trigger Tap the Act on Trigger button to configure the actions the instrument must take when a trigger event occurs. Act On Event configuration menu on page 105 for the available fields and controls. SPI serial bus trigger settings panel Field or control Description... -
Page 230: Virtual Keyboard
Menus and dialog boxes Field or control Description Act on Trigger Tap the Act on Trigger button to configure the actions the instrument must take when a trigger event occurs. Act On Event configuration menu on page 105 for the available fields and controls. Virtual Keyboard Use the onscreen virtual keyboard to enter textual information such as a file path, file name, label text, or on-screen callout. -
Page 231: Virtual Keypad
Menus and dialog boxes Virtual Keypad Use the virtual Keypad to enter numeric values and units for settings. To open the virtual keypad, double-tap inside a field that requires numeric values. Virtual Keypad fields and controls Field or control Description Clear Clears all values from the input entry field. - Page 232 Menus and dialog boxes Fields or controls Description Persistence Sets the length of time data points are displayed on screen before being erased. Off sets the record points to appear for the current acquisition only. Infinite continuously accumulates record points on the waveform until you change one of the acquisition display settings or clear the acquisition memory.
-
Page 233: Waveform Acquisition
Waveform acquisition Waveform acquisition Acquisition concepts The Acquisition system sets which data points are used to acquire waveforms. Acquisition hardware Before a signal is displayed, it must pass through the input channel where it is scaled and digitized. Each channel has a dedicated input amplifier and digitizer. -
Page 234: Interpolation
Waveform acquisition position is 50 percent, then the trigger point is in the middle of the waveform record. When horizontal delay is on, the time from the trigger point to the horizontal reference is the horizontal delay. Interpolation Your instrument can interpolate between the samples it acquires when it does not have all of the actual samples it needs to fill the waveform record. -
Page 235: Waveform Sample Interpolation
Waveform acquisition Acquisition mode Envelope mode finds the highest and lowest record points over many acquisitions. Envelope uses Peak Detect for each individual acquisition. Average mode calculates the average value for each record point over many acquisitions. Average uses Sample mode for each individual acquisition. -
Page 236: Vertical Acquisition Considerations
Waveform acquisition Set the horizontal scale, position, and resolution (record length) to include the acquired waveform record waveform attributes of interest with good sampling density on the waveform. These settings define the horizontal acquisition window, described in Horizontal acquisition considerations on page 236 . -
Page 237: Triggering Concepts
Triggering concepts Triggering concepts User selected trigger conditions are used to capture waveforms for measurement and analysis. The next figure shows how triggers fit into the overall instrument operation. Trigger helps you to capture meaningful waveforms to display on screen. This instrument has simple edge triggers as well as a variety of advanced triggers. -
Page 238: Trigger Types
Triggering concepts Trigger types The available trigger types include: Edge: This is the simplest and most commonly used trigger type, used with analog signal. An edge trigger event occurs when the trigger source passes through a specified voltage level in the specified direction (rising or falling signal voltage). When the edge trigger source is set to Internal, the instrument uses an internally generated 60 Hz signal to generate a trigger. -
Page 239: Trigger Coupling
Triggering concepts The Holdoff setting range is 0 s (minimum holdoff available) to 10 s (maximum holdoff available). For more information on how to set holdoff, see Set Trigger Holdoff on page 85. Learn about Trigger coupling Learn about Trigger modes Trigger coupling Trigger coupling determines what part of the signal is passed to the trigger circuit. -
Page 240: Advanced Triggering
Triggering concepts Advanced triggering You can check the advanced trigger status in the settings bar. The readout indicates the trigger type and then shows sources, levels, or any other parameters that are important for the particular trigger type. Bus triggering concepts A bus trigger occurs when a supported instrument detects a bus pattern that you specify for a parallel bus, or a bus cycle you select for a serial bus. -
Page 241: Logic Trigger Concepts
Triggering concepts Logic trigger concepts Trigger the instrument when logic patterns are true. You can set each bit to be active High, Low, or Don't Care. You can also set the logic thresholds and define the logic (AND, OR, NOR, or NAND). Setup and Hold trigger concepts A setup/hold trigger occurs when a data signal changes state inside of the user specified setup and hold times relative to the clock. -
Page 242: Waveform Display Concepts
Waveform display concepts Waveform display concepts This instrument includes a flexible, customizable display that lets you control how waveforms appear. The figure shows how the display features fit into the overall instrument operation. The display shows analog, digital, math, reference, and bus waveforms. The waveforms include channel markers, individual waveform graticule readings, and trigger source and level indicators. -
Page 243: Measurement Concepts
Measurement concepts Measurement concepts Measurement variables By knowing how the instrument makes calculations, you may better understand how to use your instrument and how to interpret your results. The instrument uses a variety of variables in its calculations. These include: Definition of Base and Top Base is the value used as the 0% level in measurements such as fall time and rise time. - Page 244 Measurement concepts 3. The level with the most points in the upper histogram is the Top value, and the level with the most points in the lower histogram is the Base value. If Mid gives the largest peak value within the histogram, the oscilloscope returns the Mid value for both Top and Base (this is probably a very low amplitude waveform).
-
Page 245: Missing Or Out-Of-Range Samples
Measurement concepts The instrument calculates these values as follows: 1. Find the first Mid reference edge in the waveform record or the gated region. This is Edge1. 2. Continuing from Edge1, find the next Mid reference edge in the waveform record (or the gated region) of the opposite direction of Edge1. -
Page 246: Math Waveform Elements
Measurement concepts This instrument supports mathematical combination and functional transformations of waveforms it acquires. The next figure shows this concept: You create math waveforms to support the analysis of your channel and reference waveforms. By combining and transforming source waveforms and other data into math waveforms, you can derive the data view that your application requires. Create math waveforms that result from: •... -
Page 247: Math Waveform Sources
Measurement concepts Dependencies In general, math waveforms that include sources as operands are affected by updates to those sources: • Shifts in amplitude or DC level of input sources that cause the source to clip also clip the waveform data supplied to the math waveform. -
Page 248: Math Waveform Differentiation
Measurement concepts Example: [CoefFileName="highpass_0.25bw.flt"]HighPass(Ch1) CoefFileName is the setting and is used as the high pass filter on channel 1. Example: [CoefFileName="highpass_0.25bw.flt"] HighPass(Ch1) + [CoefFileName="lowpass_0.05bw.flt"] LowPass(Ch2) The high pass filter file is applied to channel 1 and lowpass_0.05bw.flt is applied to channel 2. Functions, except for basic and logic functions, have the syntax function(source). -
Page 249: Math Waveform Offset, Position, And Scale
Measurement concepts Math waveform offset, position, and scale The settings that you make for offset, scale, and position affect the math waveform you obtain. Here are some tips for obtaining a good display: • Scale and position the source waveform so that it is contained on the screen. (Off-screen waveforms may be clipped, resulting in errors in the derivative waveform). -
Page 250: Fft Process
Measurement concepts • You should scale and position the source waveform so that it is contained on screen. (Off screen waveforms may be clipped, which will result in errors in the integral waveform.) • You can use vertical position and vertical offset to position your source waveform. The vertical position and vertical offset will not affect your integral waveform unless you position the source waveform off screen so that it is clipped. -
Page 251: Blackman-Harris Fft Window Concepts
Measurement concepts Another way to recognize aliasing is to realize that higher order harmonics usually have decreasing magnitudes compared to lower order harmonics. Thus, if you see a series of increasing harmonic magnitude values as frequency increases then you can suspect that they may be aliased. -
Page 252: Flattop2 Window
Measurement concepts Flattop2 window This window has the lowest scallop loss of any of the windows. It also has a wider resolution bandwidth but lower side lobe attenuation. Also, it is unique because the time domain shape has negative values. Note: The Flattop2 window is useful for high accuracy magnitude measurements for signals that do not require very narrow bandwidth. -
Page 253: Hanning Fft Window
Measurement concepts Hanning FFT window FFT windows have various resolution bandwidths and scallop losses (see the figure below). Choose the one that best allows you to view the signal characteristics you are interested in. The Hanning window has the narrowest resolution bandwidth, but higher side lobes. Hanning has slightly poorer frequency resolution than Hamming. -
Page 254: Kaiser-Bessel Fft Window
Measurement concepts Kaiser-Bessel FFT window A Kaiser-Bessel window balances amplitude accuracy, side lobe distance, and side lobe height. Although similar to the Blackman-Harris window, the near side lobes in a Kaiser- Bessel window tend to be higher for the same main lobe width, while the further-out side lobes are lower. -
Page 255: Tek-Exponential Window
Measurement concepts Tek-Exponential window In the time domain, it is not a symmetrical bell shape as is the case with the other windows. Instead, it is exponential with a peak at the 20% position of the time domain gate. The frequency domain shape is triangular. Note: Use this window for impulse-response testing where the 20% position is the zero phase reference point. -
Page 256: Measurement Algorithms
Measurement algorithms Measurement algorithms Amplitude measurement algorithms AC RMS measurement algorithm AC RMS is the true Root Mean Square of the data points about the Mean (µ). This measurement can be made across the entire record or on each cycle in the record. Area measurement algorithm Area is the arithmetic area for one waveform. -
Page 257: Maximum Measurement Algorithm
Measurement algorithms where s is the sample interval. Similarly, W(t) is the sampled waveform Ŵ(t) is the continuous function obtained by interpolation of W(t) A and B are numbers between 0.0 and RecordLength – 1.0 If A and B are integers, then: where s is the sample interval. -
Page 258: Positive Overshoot Measurement Algorithm
Measurement algorithms Note that overshoot values should never be negative (unless Top or Base are set out-of-range). Positive Overshoot measurement algorithm Positive Overshoot is the difference between Maximum and Top, divided by the amplitude. It is the percent that the waveform goes above top. -
Page 259: Fall Time Measurement Algorithm
Measurement algorithms In the diagram below, the Falling Slew Rate from mid ref to low ref is calculated using the following equation: Falling Slew Rate = (VREF - VREFLO)/ΔTF Fall Time measurement algorithm Fall Time is the time required for an edge to fall from the high reference level to the low reference level. By default the measurement is from reference level 90% amplitude to 10% amplitude. -
Page 260: Frequency Measurement Algorithm
Measurement algorithms Frequency measurement algorithm Frequency is the reciprocal of the period. Frequency is typically measured in Hertz (Hz) where 1 Hz = 1 cycle per second. Frequency = 1 / Period High Time measurement algorithm High Time is the amount of time that a waveform cycle is above the High reference voltage level. The application calculates the measurement using the following equation: Where: T High is the high time. -
Page 261: N-Periods Duration Measurement Algorithm
Measurement algorithms T Lo- is the Low reference crossing on the falling edge. N-Periods Duration measurement algorithm Duration N-Periods is the time required to complete N cycles. The source can be configured to be treated as either a clock or data waveform. Given a voltage waveform, the N-Period is calculated as follows: If the Signal Type is Clock The N–Period measurement calculates the elapsed time for N consecutive crossings of the mid reference voltage level in the direction... -
Page 262: Period Measurement Algorithm
Measurement algorithms Period measurement algorithm The time between two adjacent crossings of the Mid reference level (one cycle) of the waveform. Period is measured in horizontal units, typically seconds. Period = Edge3 - Edge1 Phase measurement algorithm Phase is the ratio of the Skew between two sources to the Period of the first source. It is the amount of phase shift between edges of the two waveforms. -
Page 263: Rise Time Measurement Algorithm
Measurement algorithms Rise Time measurement algorithm Rise Time is the time required for an edge to rise from the low reference level to the high reference level. By default the measurement is from reference level 10% amplitude to 90% amplitude. The following figure shows a rising edge with the two crossings necessary to calculate a Rise Time measurement. -
Page 264: Skew
Measurement algorithms The application calculates this measurement using the following equation: Where: T Setup is the setup time. T Main is the Main input (clock) Mid reference crossing time in the specified direction. T 2nd is the 2nd input (data) Mid2 reference crossing time in the specified direction. Skew Skew is the time between the mid reference level crossing on Source1 to the mid reference level crossing on Source2. -
Page 265: Time To Max
Measurement algorithms Time to Max Time to Max is the amount of time from the trigger point to the maximum data point. This measurement can be made across the entire record or on each cycle in the record. Time to Min Time to Min is the amount of time from the trigger point to the minimum data point. -
Page 266: Index
Index Numerics amplitude measurements AC RMS 250 Kohm termination Amplitude Area Base Maximum Mean about the instrument Minimum AC line voltage Negative Overshoot AC RMS Peak-To-Peak Acquired waveform Positive Overshoot acquiring a signal Acquisition input channels and digitizers Amplitude Measurements panel sampling analog channels Acquisition concepts... - Page 267 AFG documentation connected scope preferences, legalese domain name connecting probes dragging waveform and measurement badges contact Tektronix draw a mask on the screen Control Loop Response (Bode) draw-a-box button Control Loop Response plot menu Draw-a-Box button (Zoom)
- Page 268 edit a segment (mask) Flattop2 window (continued) change a segment's defined change a segment's height FlexRay bus trigger settings change a segment's horizontal center flip a segment (mask) change a segment's shape font color change a segment's source Frequency change a segment's vertical center functional test change a segment's width flip a segment horizontally...
- Page 269 how to (continued) How to Add reference waveform change display mode (stacked, Overlay) add waveform to screen how to compensate probes change display settings change graticule intensity change graticule style change measurement settings change persistence I2C bus trigger settings change waveform colors I2C serial bus menu change waveform intensity idata, plot...
- Page 270 LAN status Math waveform (continued) LAN, connect to interactions Level offset license file (option install) position license file (option) scale license key uninstall sources LIN bus trigger settings math waveform equation editor LIN serial bus menu math waveform menu linked cursors math waveforms load waveform...
- Page 271 measurement annotations mount drive menu measurement badge mouse touchscreen UI equivalents measurement badge, delete mouse, installing Measurement configuration menu movable graticule mode measurement gates move a vertex (mask) setting move cursors measurement gating settings moving badges measurement interpolation mode measurement label Measurement Name panel Measurement Results table navigation buttons, badges...
- Page 272 parallel bus search Rectangular window parallel bus trigger settings defined Pass/Fail Testing panel redo last action password, change reference clock out password, enter reference levels password, set measurement paste files Reference waveform menu Pattern Generator reference waveforms Peak Detect remove a vertex (mask) acquisition mode rename files Peak Detect acquisition mode...
- Page 273 save a plot image to a file sessions (continued) Save As dialog saving save bus decode results table to file save harmonics results table to file clock format (12/24 hr) how to 18, 26, 46, 49, 50, 52, 54, 57–62, 64, 66, 67, 72–74, 76, GPIB talk/listen address 79–83, 85, 100–104, 116, 120–123, 166, 192, 202, 203, probe deskew...
- Page 274 TekDrive drive ( trigger holdoff unmount a TekDrive trigger menu TekSecure Trigger menus TekSecure memory erase trigger out TEKTRONIX END USER LICENSE AGREEMENT trigger the oscilloscope Tektronix Technical Support Trigger types Termination Triggering text advanced time modes Time outside level...
- Page 275 waveform (continued) intensity persistence recalling record view waveform badge waveform colors, how to change 188, waveform cursors Waveform differentiation waveform dots style, setting waveform editor waveform file saving Waveform integration waveform intensity, setting waveform interpolation waveform persistence waveform persistence, setting waveform preview waveform style, setting waveform vectors style, setting...
Need help?
Do you have a question about the MSO 2 Series and is the answer not in the manual?
Questions and answers