Table of Contents
Advertisement
Quick Links
Advertisement
Table of Contents

Related Manuals for Resonance Spin Mate


Summary of Contents for Resonance Spin Mate
- Page 1 RESONANCE SYSTEMS NMR Analyzer “Spin Mate” Operation manual...
-
Page 2: Table Of Contents
2.1. NMR Analyzer components ........................ 5 2.2. Connecting Hardware to PC and Drivers Installation ................. 8 2.3. Technical Characteristics and Service Conditions ................11 2.4. Preparation of Spin Mate for measurements ................... 12 3. Software Overview ..........................13 3.1. Software Installation ........................13 3.2. -
Page 3: General Safety Information
• Make sure that the system is placed securely and stably on a sufficiently stable surface (e.g. table with a load capacity of 100 kg/m • Do not place the Spin Mate system near any heat sources, such as radiators. • Do not block the ventilation openings on the sides, top or bottom of the housing. - Page 4 Opening houses / cases, dismantel moduls, components, subsystems. If the Spin Mate system is used in a manner not described by the manufacturer, the safe functioning of the system may be impaired. No modifications of any kind may be made to the system without prior consultation with the manufacturer and without written approval.
-
Page 5: Spin Mate Overview
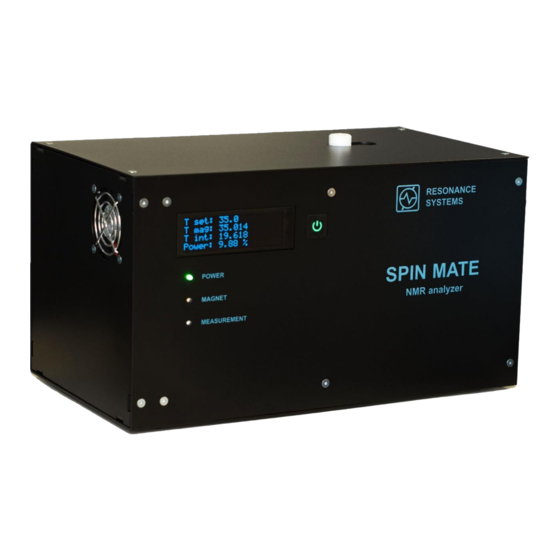
2. Spin Mate Overview 2.1. NMR Analyzer components Compact TD-NMR analyzer Spin Mate is an ideal instrument for such applications as Relaxation times measurement, Surface Area and Wettability of nanoparticles and colloidal systems, Crystallinity and Domain Sizes in Polymers and many others. Observable nuclei: H (basic configuration). - Page 6 Pic. 2.2. Front panel of Spin Mate. POWER – power LED. Switched to 100 % of brightness if temperature of magnet stable, otherwise flashes at 50 % of brightness; MAGNET – indicates magnet heating; MEASUREMENT – indicates active measurement process;...
- Page 7 Pic. 2.3. Back panel of Spin Mate. AC Input – power input with integrated switcher. This switcher switches on digital part of the analyser and magnet heater. The temperature is stored in the internal memory and the factory preset is +35 °C;...
-
Page 8: Connecting Hardware To Pc And Drivers Installation
2.2.1. The power switches on back panel units must be in position “O” – turned off. 2.2.2. Connect the Spin Mate to the PC by USB cable through USB port. 2.2.3. Connect the power supply cables to the Spin Mate. - Page 9 2.2.8. The Spin Mate 4.0 Properties window will appear (Pic. 2.8), in which you should push on Update Driver button. Pic. 2.8. Spin Mate 4.0 Properties window. 2.2.9. The Update Driver Software – Spin Mate 4.0 window will appear (Pic. 2.9), in which you should click on Browse my computer for driver software.
- Page 10 2.2.11. The result of drivers installation is shown in Pic. 2.11 a and b. Pic. 2.11. Result of installation drivers. 2.2.12. Push on Close button.
-
Page 11: Technical Characteristics And Service Conditions
2.3. Technical Characteristics and Service Conditions The main characteristics of the console and magnet system of NMR Analyzer Spin Mate and the PC requirements are presented in tables 2.1 and 2.3. Table 2.1. Basic characteristics of the NMR Analyzer Spin Mate. -
Page 12: Preparation Of Spin Mate For Measurements
2.4. Preparation of Spin Mate for measurements 2.4.1. Set the POWER switch on the back panel to the “O” position. Connect the NMR analyzer to the AC network. 2.4.2. Turn on the switcher the back panel to the “I” position, OLED display on the front panel and power button on the front panel should light up at 50% of brightness. -
Page 13: Software Overview
3. Software Overview Software Relax8 is the powerful tool both to use the standard NMR relaxation routines and to create new applications. The built-in script language based on widespread Pascal syntax is enriched with commands of fitting, Fourier and Laplace transforms, Low-pass filtering. The script supports dialogue windows, static messages, user-defined diagrams, data manipulation procedures. - Page 14 Pic. 3.3. Selection of the program destination. 3.1.5. Choose the Start Menu folder where the program’s shortcut should be located by the button Browse… (Pic. 3.4). After this procedure press the Next button. Pic. 3.4. Choice of the Start Menu folder for Relax8 shortcut creation. 3.1.6.
- Page 15 Pic. 3.5. Readiness to installation. 3.1.7. The software installation is complete. Press the Finish button to exit Setup (Pic. 3.6). Pic. 3.6. Finishing of Relax8 installation.
-
Page 16: Menu And Control Board
3.2. Menu and Control Board The Relax8 software has the opportunity to represent the data graphs and so to save the data to the file. There are also several methods for convenient control of the measurement process. To provide easy access for the measurement and the experiment observation the screen is divided into following parts (Pic. - Page 17 • Data Base • Help and Support • Tune Frequency The basic commands of the Main Menu Bar and corresponding keyboard shortcut combinations are shown in the Table 3.1. Table 3.1. The basic commands of the Main Menu Bar. File Load Application The opening of the standard or created earlier application with *.app extension...
- Page 18 Loads new firmware About Resonance It is inactive Systems Tune Frequency Tune Frequency Starting the procedure of fine resonance setting Ctrl+R Setups Setups The showing of the information about the system and the experiment parameters 3.2.3. Functional Buttons The Measurement Tool Bar is the panel for convenient and quick experiment handling. It is positioned at the top left of program screen and includes the set of Functional Buttons.
- Page 19 Рiс. 3.10. Start/Stop application button. 3.2.6. Application Window The Application Window appears after standard application loading for further measurement performing if Load Application and Settings button from Functional Buttons field was pressed and selected application (Pic. 3.7). The applications are written using the Pulse Programming Language, which is similar to Pascal.
- Page 20 PC-mouse. Moving NMR signal field of view could be done by moving PC-mouse with pressed the right button of it. Coordinates of position PC-mouse pointer in the NMR Signal Window are displayed in the Status Bar (Pic. 3.7). Experimental data displayed in the Signal Window can be saved to a file with the extension *.dat or to a graphic file using the command Save Signal as Picture by pressing the right button of the PC-mouse at the Signal Window.
- Page 21 Analysis Fourier Transform Building a signal spectrum FIT Relaxation XY data curve fitting List of the commands that appears after right-clicking on XY Plot field is presented in Pic. 3.14. Pic. 3.14. Context menu. 3.2.7.3. Code In this window (Pic. 3.16) the code of current application is shown. Pic.
- Page 22 The mode MEASURE is set automatically (Pic. 3.19). To take measurements, stay in this mode. To create the calibration function, follow to CALIBRATE mode. To perform the validation procedure of NMR Analyzer Spin Mate, choose the mode VALIDATE. Pic. 3.19. Mode Switcher.
-
Page 23: Measuring System Settings
3.3. Measuring System Settings Measuring System Settings appear after choosing the command Setups from the pull-down menu Setups or pressing the proper Functional Button or using the hot key F5. Measuring System Settings allow to setup all necessary parameters of the equipment and the experiment. There are three sheets (Basic settings, Standard applications, Hardware) and nine functional buttons in every sheet (RUN Check FID, Stop, Interface Tab, Revert, Apply, Save, Close, Open Ini-File, Save Ini-File) in the dialog window. - Page 24 Pic. 3.21. Basic settings tab. 3.3.2.1. Multi-Step Experiments Multi-Step Experiments – basic parameters for Т experiments performing. Time of Observation, us – recovery time of the longitudinal magnetization. It is final value of τ in sequence 90°-τ-90° to determine time of spin-lattice relaxation time T .
- Page 25 0°-90°-180°-270° is used type of phase cycling. Auto Tune Resonance within 10 kHz – tunes the resonance automatically before each measurement. It allows correcting small shifts of resonance frequency. Work mainly for samples with high proton density and long T ...
- Page 26 Amount – number of measurements. 3.3.3. Standard applications Additional settings for carrying out the experiment are set in Standard applications (Pic. 3.23). Pic. 3.23. Standard applications tab. 3.3.3.1. Intervals of magnitude measurements (FID, SFC, T Maximal and minimal values for average NMR signal amplitude calculation in the experiments. ...
- Page 27 Wait to Autostart, seconds – time to automatically start measurement after placing the sample in the magnet system; it is changed in the range of 1..20. 3.3.4. Hardware This tab (Pic. 3.24) includes special settings of NMR Analyzer Spin Mate.
- Page 28 Pic. 3.24. Hardware tab. 3.3.4.1. Sensor Frequency, MHz – resonance frequency. Phase, deg – initial phase of RF pulse. Tune Phase – phase correction to approximate the real component of signal to maximum, and the imaginary – to zero.
- Page 29 Resonance frequency value is tuned automatically using the standard sample by standard sample calibration by pressing the Functional Button Tune in this field. If necessary pulse duration can be corrected manually (see First Start-up and Daily Check). Buttons allows to import and export probe settings (all values of Sensor field).
- Page 30 2 – what tab is active when the app is just opened; 3 – what modes of measurements are allowed to be selected; 4 – Application Name appears on the Relax8 caption after Relax 8 – Resonance Systems Corporation: …;...
-
Page 31: Software Start-Up
To press on Apply and then Close. If after this tune signal is not on resonance, check whether Auto Digital IF (Pic. 3.24) is switched on. If it is off, switch on it and repeat procedure of resonance tuning. - Page 32 (approximately once in several days), than searching of resonance frequency. But notice that it has to be done each time, after the power of transmitter was changed. For the calibration of pulses duration use Settings of the...
- Page 33 7. FID recording will start (Pic. 4.4). The message “Scanning Frequency…” will appear. Pic. 4.4. Procedure of Scanning Frequency. 8. FT result of 90° pulse will be shown in XY Plot (Pic. 4.5). The resonance frequency is determined by corresponding to maximum amplitude of spectrum.
- Page 34 Pic. 4.5. Procedure of Adjusting Frequency. 9. After setting of resonance frequency, the automatic calibration of pulse durations is performed (Pic. 4.6). The message “Calibrating pulses…” will appear. Pic. 4.6. Procedure of Calibrating Pulses. 10. After the procedure Calibrating pulses, time for half signal is calculated (Pic. 4.7).
- Page 35 Pic. 4.7. Calculating time for half signal. 11. The Spin Mate is validated (Pic. 4.8). Pic. 4.8. End of validation procedure. 12. Follow the Report tab for watching a detailed report (Pic. 4.9).
- Page 36 Pic. 4.9. Report tab. 13. For saving this report should press on Save Report , enter a file title and click on Save and then Close. Your report will be saved with the resolution *.txt. To watch the already saved report, push on Open Report and choose the desired file from the pull-down list.
-
Page 37: Applications Test
4.3. Applications Test NMR Analyzer Spin Mate and Relax8 software are supplied with tubes (the diameter is equal 10 mm) with standard samples: glycerol, distilled water, and starch. For MeasureT1_180-t-90.app and MeasureT1_90-t-90.app tests utilize glycerol. Results of measurements are shown in Pic. 4.10 and Pic. 4.11, respectively. - Page 38 Pic. 4.12. MSE experiment. Starch. T2_Hahn.app, T2_CPMG_long.app and T2_CPMG_medium.app should be tested on glycerol (Pic. 4.13) and water (Pic. 4.14). Pic. 4.13. CPMG experiment. Glycerol. Pic. 4.14. CPMG experiment. Water.
-
Page 39: Relaxation Time Measurements
5. Relaxation Time Measurements 5.1. Spin-lattice Relaxation Time T The spin-lattice (or longitudinal) relaxation time T characterizes the rate of energy transfer from the nuclear spin system to the neighboring molecules (the “lattice”). There are two experiments commonly employed to measure the T , “Inversion-Recovery”... -
Page 40: Utilizing Applications For Measuring Spin-Lattice Relaxation Time
The longitudinal magnetization that appears during the time is turned by the second 90° pulse to the XY plane, then FID appears in the receiving circuit, the amplitude of which is proportional to the magnetization recovered during . Pic. 5.2. Longitudinal magnetization recovery curve. Saturation-Recovery experiment. 5.1.3. - Page 41 8. Press on Auto T1/T2; Time of observation (us), Initial step (us), Number of points will be automatically calculated. 9. Select the Fitting Model depending on sample composition – Single T or Double T 10. Push on Apply, Save and then Close. 11.
- Page 42 Check the Fit box and click on Plot. The button Report Results is intended for transferring results to the Fitting Results table, thus, it becomes convenient to copy data. Highlight all necessary data and push on Copy Selection. It is possible to paste these data into another program. Tick the Add to Excel and click on Report Results.
- Page 43 Pic. 5.7. Drop-down list after right-clicking on the table. 4. To complete the X and Y values editing process, use Close Data Grid, copy all data – Copy All, paste data – Paste, and cancel changes – Discard Changes (Pic. 5.7).
-
Page 44: Spin-Spin Relaxation Time T
5.2. Spin-spin Relaxation Time T The spin-spin (or transverse) relaxation time T characterizes the mechanism by which the transverse component of magnetization vector exponentially decays to its equilibrium state. There are few experiments utilized to measure the T 5.2.1. Free Induction Decay (FID) Free Induction Decay (FID) can be described as the most basic sequence in Time-Domain NMR that is founded on single 90°... -
Page 45: Magic Sandwich Echo (Mse)
Pic. 5.9. SE experiment. Starch. 5.2.3. Magic Sandwich Echo (MSE) Magic Sandwich Echo (MSE) is a modified form of Solid Echo sequence. This pulse sequence becomes necessary since SE cannot fully refocus multiple dipolar interactions. This technique is utilized in many polymer studies. MSE signal of cotton cellulose is shown in Pic. 5.10. Pic. -
Page 46: Utilizing Applications For Measuring Spin-Spin Relaxation Time
5.2.4. Utilizing applications for measuring Spin-spin Relaxation Time For taking T measurements keep to next steps: 1. Perform points 1-6 of the section 5.1.3, choosing as the work application FID.app or SE.app or MSE.app. 2. In the Basic settings tab install Relaxation period (it is approximately equal to 5T ) and Amount of scans. - Page 47 Pic. 5.11. XY Plot tab. Select the leftmost point of graph and click on it by the right PC-mouse button. Choose “Set Left Limit for Fitting” from the pull-down list. Perform the same actions for the right limit by selecting the rightmost point of graph and pushing on “Set Right Limit for Fitting”.
-
Page 48: Carr-Purcell-Meiboom-Gill (Cpmg). Main Information And Applying
Pic. 5.13. Fitting procedure. When measuring the spin-spin relaxation time by Hahn Echo pulse sequence, one or more points may fall out of the curve, having an underestimated or overestimated value of the signal intensity. To correct coordinates of points, follow these steps: 1. - Page 49 4. Select the Fitting Model depending on sample composition. 5. Push on Apply, Save and then Close. 6. Launch the measurement by clicking on RUN. 7. After the measurement finishing follow the Excel tab. In the first and second columns of table time and echo amplitude will be presented, respectively.
- Page 50 Check the Fit box and click on Plot. The button Report Results is intended for transferring results to the Fitting Results table, thus, it becomes convenient to copy data. Highlight all necessary data and push on Copy Selection. It is possible to paste these data into another program. Tick the Add to Excel and click on Report Results.
-
Page 51: Diffusion Measurements
Measuring of diffusion or self-diffusion coefficients is very informative TD-NMR technique and can be accurately made with Spin Mate equipped with Pulsed Field Gradient (PFG) Amplifier and PFG probe. The Spin Mate allows implementing various PFG sequences based on the script language... -
Page 52: Calibrating Of Gradient Multiplier
Gradient Multiplier and g Constant Gradient Natural inhomogeneity of the B field of NMR magnet. This value can be used when Spin Mate has no PFG option to estimate relatively high diffusion coefficients Calibration Diffusion The self-diffusion coefficient of known sample that is used for calibration. - Page 53 6.1.6. In the Basic settings tab install Relaxation period (it is approximately equal to 5T ) and Amount of scans (or at the bottom of screen). 6.1.7. Adjust the resonance frequency according to 4.2.5. 6.1.8. After the calibration sample reaches temperature equilibrium within the Magnet System, select the Calibration Mode: Pic.
-
Page 54: Measurements Of Self-Diffusion Coefficients
6.2.4. Make sure that Relaxation Period (Relax. delay), Amount of scans and RX1 Gain (Signal Gain) as well as the parameters of Diffusion measurements (Pic. 6.4) are selected correctly. Caution: though gradient amplifiers of Resonance Systems have several stages of coil and current protection, be extremely careful, playing with setups numbers in Diffusion experiments! For most cases only Diffusion time and Points in Diffusion Curve are necessary to change. - Page 55 Pic. 6.7. Diffusion GUI with experimental data. 6.2.6. Calculated diffusion coefficient(s) of sample will be shown in the table (Calculations). For loading and saving experimental data use Open Decay and Save Decay buttons.
-
Page 56: Spectrum Construction
7. Spectrum Construction In Relax8 there is the possibility to construct signal spectra using Fourier transform. To perform this procedure, follow the actions below: 7.1.1. Carry out a measurement by the application FID.app or SE.app or MSE.app. 7.1.2. After the measurement is completed, follow to the XY Plot tab and choose Fourier Transform from the section of the menu Analysis. -
Page 58: Development Applications For Software Relax8
8. Development Applications for Software Relax8 8.1. Syntax of Inline Programming Language of Relax8 To edit the application code, follow the Code tab that can be hidden in the settings. To activate it, call up the settings window (F5) and check box the Interface Tab field (Pic. 8.1). Push on the appeared Interface tab. - Page 59 procedure TXPower(power : real) Sets power of the transmitter (0..100%). It works only in RunTime_TX(false) mode! Otherwise one should use other procedure: Set_TXAMP_A(power : real) procedure Bases(X, Y : double) Sets position zero line of in-phase part of signal. It can be established also in settings: Base [0..64000] (Setups-Hardware-Signal...
- Page 60 TXPower(power : real). procedure Wobble(Duration, Phase : double) Turns on simultaneous TX and ADC. Duration in microseconds. Can be used to tune sensor or to turn the Spin Mate into spectrum analyzer procedure ADC(Duration : Single) Enables a real-time quadrature acquisition...
- Page 61 procedure Cycle(Repetitions : integer) Starts a cycle Repetition times (notice that for, repeat or while operators are not applicable in run-time sequences) procedure EndCycle End of a Cycle function p_90 : real Returns the 90° pulse duration which was set before in application or in settings (Setups –...
- Page 62 procedure LP_Filter_Frequency(frequency Sets the low-pass filter cut-off frequency. The real) same value you can set in the settings of the program (Setups – Hardware – Signal Processing): Filter Value, MHz procedure Sequence_Null(t : real) Sets the zero time shift, t in microseconds procedure Scale_Signal(min, max : real) Sets minimum and maximum in % of the intensity...
- Page 63 function Get_NECH : integer Returns Number of Echo, which was set before in application or in settings (Setups – Basic settings – Echo sequences): Number of Echo procedure Set_ NECH(amount : integer) Sets Number of Echo. The same value you can set in the settings of the program (Setups –...
- Page 64 function GET_GRAD_DURATION : real Returns Gradient Pulse Duration in Diffusion Measurements, which was set before in settings (Setups – Standard applications – Diffusion Measurements): Gradient Pulse Duration, us function GET_DIFFISION_TIME : real Returns Diffusion Time Diffusion Measurements, which was set before in settings (Setups –...
- Page 65 procedure Set_FFT_Nulls(n : integer) Adds n zeros after signal for FFT resolution increase procedure Perform_FFT Performs Fast Fourier transform of the acquired time-domain signal and shows the spectrum graph in sheet Results Graph of NMR Signal window procedure CPMG_Enable(on : boolean) Makes the averaging of points during each echo and plots the graph in sheet XY Plot.
- Page 66 function Exp(x : real) : real Returns e in the power x function Random(k : integer) : integer Returns random value within [0..k] Files and Interface Management procedure SetPersent(percents : real) Sets value percents scale in the experiment progress field. Percents should be in a range: 0..100 procedure AssignDataFile(FileName : string) Defines name of the output data file.
- Page 67 function ReadInteger(Prompt : string): integer Returns integer value from input box procedure ShowText(Prompt : string) Shows text window procedure HideText Closes text window procedure ClearText Clears all text in the text window procedure WriteToText(s : string) Writes a string s to text window. procedure WriteLnToText(s : string) Writes a string s to text window and goes to the next string...
- Page 68 procedure Set_Table_Value(value : double, Writes value number in cell, in which mouse precision: integer) pointer is set, accurate to amount of precision decimal place function Get_Table_Value : double Returns value from cell where the table cursor is focused procedure Insert_Table_Sheet(x : integer, y : Adds new spreadsheet to Excel book string) procedure Rename_Table_Sheet(x : Integer,...
-
Page 69: Comments To Examples Of Applications
8.2. Comments to Examples of Applications Code of the application for T measurements and its comments: //ini included // it means that an ini-file is included into the source code and is not located in a separate file //its content is shown below in the section [hardware] //[hardware] values are accessible in Setups. - Page 70 ADC_Multiplier(1); // Sets the ADC multiplier Sequence; // Tells compiler that pulse sequence description is listed below until EndSequence directive Pulse(p_180, 0); // Sets the TX rf-pulse with phase of 0° and with duration of 180°-pulse, which is set in settings (F5) // Silence(tau4);...
- Page 71 x1, y1, x_min1, factor1 : real; // List of variables of real type which will be utilized within this procedure begin n_:=GET_T1_N; // Sets the value of variable n_ such as the value which is written in the field of Number of points of Multi-Step Experiments in «Basic settings» (F5) x_min1:=GET_T1_TAU;...
- Page 72 Set_Table_Cell(4, i_+2); // Sets the table cursor into cell in 4th column and i_+2 row of the table Set_Table_Text(FloatToStr(w88-w8b, 3)); // Writes the value of w88-w8b in cell, in which the table cursor is set, accurate to 3 decimal place x1:=round(x1*factor1);...
Need help?
Do you have a question about the Spin Mate and is the answer not in the manual?
Questions and answers