Table of Contents
Advertisement
Quick Links
Advertisement
Table of Contents

Related Manuals for PASCO TD-8513


Summary of Contents for PASCO TD-8513
- Page 1 I n s tr u c ti o n M a nu a l 012- 09189A Heat Conduction Apparatus TD-8513...
-
Page 2: Table Of Contents
He a t Co nd u c ti on Ap p ar a t us Ta bl e o f Co nt en t s Contents Introduction ............3 Connections . -
Page 3: Introduction
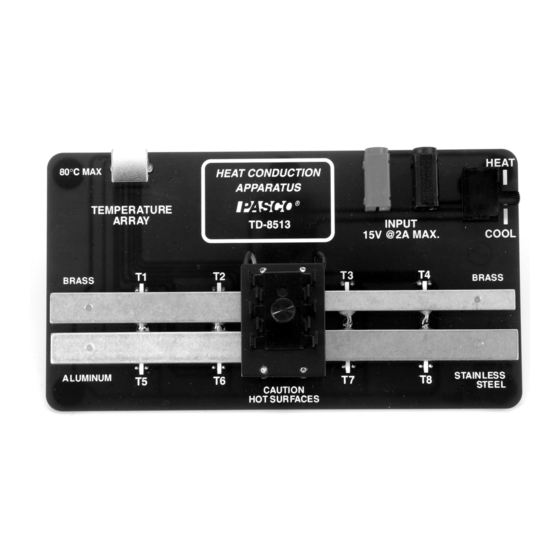
Or similar power supply capable of supplying at least 5 volts and 1 amp. Introduction The PASCO Heat Conduction Apparatus demonstrates the difference in the rate of heat conduction through bars of different materials and cross-sectional areas. The apparatus has four metal bars: one aluminum, one stainless steel, and two brass with different cross-sections. -
Page 4: Connections
He a t Co nd u c ti on Ap p ar a t us Connections The Heat/Cool switch changes the polarity of the voltage applied to the Peltier device so that the lower surface of the device either heats or cools the bars. When the switch is set to Cool, the device pumps heat from the lower surface to the upper surface;... -
Page 5: Experiment #1: Heat Conduction
PI-9877 4 mm Banana Patch Cords (qty. 2) SE-9750, SE-9751, or similar Temperature Array requires a PASPORT interface; see PASCO catalog or www.pasco.com Set-up On the power supply, turn the Function switch to SET MAX and set the voltage limit to 8 V; this will prevent accidental overload during the experiment. Turn the... - Page 6 He a t Co nd u c ti on Ap p ar a t us E x p er im e nt #1 : H ea t Co n du c ti o n Procedure Set the power supply to 5 V (constant DC) and simultaneously start recording in DataStudio.
- Page 7 Mo d el No . TD - 85 1 3 E x p er i m e nt # 1: H ea t Co n du c ti o n B. Heat Pulse Set-up Set the switch to HEAT and place the insulators over the bars. In DataStudio, set the sampling rate of the Temperature Array to 2 Hz.
- Page 8 He a t Co nd u c ti on Ap p ar a t us E x p er im e nt #1 : H ea t Co n du c ti o n Set-up Set the switch to COOL. Place the insulators on the bars.
-
Page 9: Experiment #2: Angstrom's Method
PI-9877 4 mm Banana Patch Cords (qty. 2) SE-9750, SE-9751, or similar Temperature Array requires a PASPORT interface; see PASCO catalog or www.pasco.com Set up On the power supply, turn the Function switch to SET MAX and set the voltage limit to 8 V;... - Page 10 He a t Co nd u c ti on Ap p ar a t us Ex p e r i me n t #2 : A n gs t r o m’ s M et ho d According to Angstrom’s method ∆...
- Page 11 Mo d el No . TD - 85 1 3 E x p e r im e nt # 2 : An g s tr o m ’s M et ho d A. Aluminum Set-up In DataStudio set the sampling rate of the Temperature Array to 2 Hz. Create a graph to display temperatures measured by both thermistors in the aluminum bar (T5 and T6).
- Page 12 He a t Co nd u c ti on Ap p ar a t us Ex p e r i me n t #2 : A n gs t r o m’ s M et ho d Repeat the calculations for the data runs taken with 40-second and 50-second tri- angle waves.
-
Page 13: Sample Data
Mo d el No . TD - 85 1 3 S am p le D at a Sample Data Experiment #1: Heat Conduction A. Heat Conduction Race Temperatures measured by the “far” ther- mistors show the aluminum bar to be the best conductor and stainless steel the worst. - Page 14 He a t Co nd u c ti on Ap p ar a t us S am p l e D at a For these sample data, the heat flow rates are: Wide Brass 0.36 J/s Narrow Brass 0.28 J/s Aluminum 0.28 J/s Stainless Steel...
- Page 15 Mo d el No . TD - 85 1 3 S am p le D at a C. Heat Waves In this graph the far thermistor lags the near thermistor by 11.1 s. The wave speed is 30 mm/11.1 s = 2.7 mm/s. The wavelength is 140 mm, about twice the length of the bar.
- Page 16 He a t Co nd u c ti on Ap p ar a t us S am p l e D at a Narrow brass bar: ∆ t Period (s) k (W/m·K) Average k (W/m·K) 0.578 0.142 10.2 0.599 0.150 0.571 0.142 10.8...
-
Page 17: Technical Support
Trademarks PASCO, PASCO scientific, DataStudio, and PASPORT are trademarks or registered trademarks of PASCO scientific, in the United States and/or in other countries. All other brands, products, or service names are or may be trademarks or service marks of, and are...
Need help?
Do you have a question about the TD-8513 and is the answer not in the manual?
Questions and answers