
Related Manuals for AEMC instruments PowerPad IV 8345


Summary of Contents for AEMC instruments PowerPad IV 8345
- Page 1 User Manual ENGLISH PowerPad ® Model 8345 POWERP D IV POWERP D IV Class POWER QUALITY ANALYZER WITH AEMC INSTRUMENTS ®...
- Page 2 Copyright © Chauvin Arnoux , Inc. d.b.a. AEMC Instruments. All rights reserved. ® ® No part of this documentation may be reproduced in any form or by any means (including electronic storage and retrieval or translation into any other language) without prior agreement and written consent from Chauvin Arnoux , Inc., as governed by United States and International copyright laws.
- Page 3 Statement of Compliance Chauvin Arnoux , Inc. d.b.a. AEMC Instruments ® ® certifies that this instrument has been calibrated using standards and instruments traceable to international standards. We guarantee that at the time of shipping your instrument has met its published specifications. An NIST traceable certificate may be requested at the time of purchase, or obtained by returning the instrument to our repair and calibration facility, for...
-
Page 4: Table Of Contents
TABLE OF CONTENTS 1. INTRODUCTION ................1 1.1 PRECAUTIONS FOR USE ............2 1.2 RECEIVING YOUR SHIPMENT ..........2 1.3 ORDERING INFORMATION ............. 3 1.3.1 Accessories ..................1.3.2 Replacement Parts ................ 1.5 CHARGING THE BATTERY ............4 1.6 CHOOSING A LANGUAGE FOR THE DISPLAY ....4 2. - Page 5 3.3.5 Network..................3.3.6 Updating the Embedded Software ..........3.3.7 Information ................... 3.4 CONFIGURING THE MEASUREMENT......... 24 3.4.1 Calculation Methods ..............3.4.2 The Distribution Network and the Type of Connection ....3.4.3 Sensors and Ratios ..............3.4.4 Trend Mode .................. 3.4.5 Transient Mode ................3.4.6 Inrush Current Mode ..............
- Page 6 6. HARMONICS ..................55 6.1 DISPLAY FILTER..............56 6.2 EXAMPLES OF SCREENS ............. 57 7. POWER....................59 7.1 DISPLAY FILTER ..............59 7.2 EXAMPLES OF SCREENS ............. 59 8. ENERGY .................... 61 8.1 DISPLAY FILTER..............61 8.2 EXAMPLES OF SCREENS ............. 62 9.
- Page 7 17. TECHNICAL SPECIFICATIONS ........... 89 17.1 REFERENCE CONDITIONS ..........89 17.2 ELECTRICAL SPECIFICATIONS.......... 92 17.2.1 Input Voltage Specifications ............17.2.2 Current Input Specifications ............17.2.3 Bandwidth and Sampling ............17.2.4 Instrument Specifications (Without Current Sensors) ....17.2.5 Specifications of the Current Sensors ........17.2.6 Uncertainty of the Real-Time Clock .........
- Page 8 20.2.4 Levels of Harmonics and Interharmonics ........ 20.2.5 Level of Unbalances ..............20.2.6 Mains Signaling Voltages (MSV) ..........20.2.7 Level of Harmonic Group Distortion ........20.2.8 Distortion ................. 20.2.9 K Factor and Harmonic Loss Factor ........20.2.10 Frequency ................20.2.11 DC Component ..............20.2.12 Active Power (P) ..............
-
Page 9: Introduction
1. INTRODUCTION Thank you for purchasing an AEMC Instruments PowerPad IV Model 8345. ® ® For best results from your instrument and for your safety, read the enclosed operating instructions carefully and comply with the precautions for use. Only qualified and trained operators should use this product. Symbols CAUTION - Risk of Danger! Indicates a WARNING. -
Page 10: Precautions For Use
1.1 PRECAUTIONS FOR USE This instrument complies with safety standard IEC/EN 61010-2-030 or BS EN 61010-2-030. The leads comply with IEC/EN 61010-031 or BS EN 61010-031. The current sensors comply with IEC/EN 61010-2-032 or BS EN 61010-2-032 for up to 600 V in CAT IV. Failure to observe the precautions for use may create a risk of electric shock, fire, explosion, or destruction of the instrument and installations. -
Page 11: Ordering Information
1.3 ORDERING INFORMATION PowerPad IV Model 8345 (No Probes) ........Cat. #2136.35 ® Includes meter, extra-large tool bag, internal carrying pouch, hand strap, USB cable, five 10 ft black voltage leads with alligator clips, twelve color-coded input ID markers, power adapter (PA32ER) with US power cord, two 6 ft stackable leads, two 10 ft black voltage leads with alligator clips for power adapter PA32ER, SD Card, one power plug adaptor for PA32ER, 5.8 A·h Li-ion battery pack, quick start guide, and USB stick with DataView... -
Page 12: Charging The Battery
1.5 CHARGING THE BATTERY Before using the instrument, you must fully charge the battery. 1. Remove the plastic film preventing the connection between the battery and instrument. To do this, refer to § 18.3, which explains how to remove the battery from the instrument. -
Page 13: Product Features
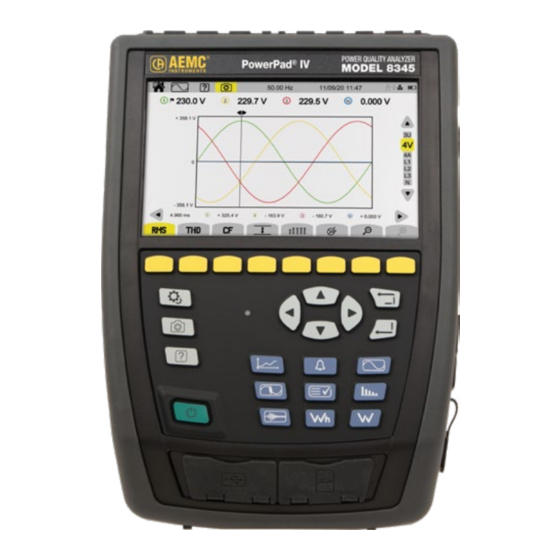
2. PRODUCT FEATURES 2.1 DESCRIPTION The PowerPad IV Model 8345 is a portable, three-phase power quality ® analyzer that complies with the standards governing the methods of power quality measurement, IEC 61000-4-30, Class A. The 8345 can be used to: Measure RMS values, powers, and disturbances of power distribution ■... -
Page 14: Display Functions
Current and voltage crest factors (neutral included) ■ Harmonic loss factor (FHL) for application to transformers in the presence ■ of harmonic currents K factor (FK) for application to transformers in the presence of harmonic ■ currents 40 alarms per user profile ■... -
Page 15: Measurement Functions
2.1.3 Measurement Functions The trend recording (data logging) function offers the following features. ■ Time-stamping Programming the recording’s beginning and end ■ Representation, in barcharts or curves, of mean values for many ■ parameters as a function of time, with or without the MIN-MAX 4 configurations per user profile ■... -
Page 16: Overall View
broken down, the unit of energy, the K factor calculation’s coefficients, the reference for levels of harmonics, and the calculation of PLT (sliding window or not) Choose the distribution system: single-phase, two-phase, or three-phase ■ with or without neutral Choose the connection method: standard, 2 elements, or 2½ elements ■... -
Page 17: Measurement Terminals
2.3 MEASUREMENT TERMINALS 4 current input terminals 5 voltage input terminals (for current sensors) 1000V CAT IV 2.4 SIDE CONNECTORS Strap attachment point Theft-proofing device for securing the instrument with a Kensington lock RJ45 connector for Ethernet connection USB type B connector for connection to a PC Special 4-point connector for the power supply. -
Page 18: Battery
2.5 BATTERY The instrument can operate on battery power or wall power. While the battery charges, the instrument can operate on wall power. The battery contributes to the operator’s safety, so do not use the instrument without its battery. The instrument’s display has a battery indicator icon that shows the battery’s status and remaining charge. -
Page 19: Keypad
Press the button again to turn the instrument off The instrument will request confirmation if it is recording or metering energy, recording transients or alarms, or capturing an inrush current. If the power-off command is confirmed, the recordings will finalize, and the instrument will turn off. -
Page 20: The Other Buttons
2.8.3 The Other Buttons Button Function See § Configuration button § 4.3 Screenshots button § 14 Help button § 15 2.8.4 The Function Buttons (8 Yellow Buttons) The functions of the yellow buttons depend on the selected mode and context. A button’s function for each screen is shown at the bottom of the display. -
Page 21: Memory Card
2.10 MEMORY CARD The instrument is delivered with a formatted SD card that is essential for recording measurements. The instrument accepts SD (SDSC), SDHC, and SDXC memory cards in FAT16, FAT32, or exFAT format. To install a new SD card, you will need to: 1. -
Page 22: Prop
2.11 PROP The back of the instrument has a retractable prop to hold it at a 60° angle. NOTE: Do not insert the leads into the terminals while the instrument is supported by the prop, or the prop could become damaged. The prop is designed only for viewing the display and interacting with the interface from different angles. -
Page 23: Configuration
3. CONFIGURATION The configuration screen allows you to set up specific configurations for the instrument’s parameters and every measurement mode. Press the button to access the configuration screen Press the button to configure the measurements Press the button to configure the instrument ... - Page 24 2. Press . The USER PROFILE screen displays the confirm button icon next to the first user profile being selected (see below image). Use the (▲, ▼) directional buttons, to select a different user profile. 3. Press to access the details of the user profile. Use the (◄, ►) directional buttons to select the user name field, and press again to enable the field name.
-
Page 25: Configuring The Instrument
3.3 CONFIGURING THE INSTRUMENT Except for the display and language, the instrument’s configuration cannot be changed if the instrument is recording or metering energy, recording transients or alarms, or capturing an inrush current. 3.3.1 Language 1. Press on the setup screen to enter the language selection screen. 2. - Page 26 3.3.2.1 GPS Mode The GPS mode is necessary to guarantee that your instrument is Class A (per IEC 61000-4-30). The instrument must have access to the GPS satellites at least once to receive the date and time. The instrument could take up to 15 minutes to synchronize.
-
Page 27: Display
1. If you choose time synchronization by NTP, enter the address of the NTP server in the NTP server field (Example: 0.fr.pool.ntp.org) 2. Select your country’s time zone. 3. Connect the instrument to the server via Ethernet connector or Wi-Fi. The time synchronization status is indicated by an icon ( ) in the status bar. - Page 28 The SD card’s remaining memory The total size of the SD card The SD card’s used memory 1. Press to manage the external memory’s content. 2. To view an item in detail, select it and press 3. Press to eject the SD card or USB drive. You must eject the SD card before removing it from the instrument;...
-
Page 29: Network
3.3.5 Network The instrument’s connection status is indicated in the top right of the display. Connection status Press to configure the Ethernet link Press to configure the Wi-Fi link Press to connect to the IRD server Press to configure the email notifications Only one link (Ethernet or Wi-Fi) can be activated at a time. - Page 30 symbol indicates that the link is inactive and can be activated. Press in the screen’s bottom right to deactivate an active link before modifying it If no link is active, no action is needed. For SSID, choose the network to connect to the instrument ...
-
Page 31: Updating The Embedded Software
For Server address, select the server address to connect to the instrument For Server port, enter the server port number to connect to the server address (up to 5 numbers) The Device name is the device's serial number. It is used by the IRD server ... -
Page 32: Information
3. Select the method to use to update the software: to update from the AEMC Instruments website via Ethernet link ® to update from the SD card to update from the USB drive 4. When the update method has been selected, press to download the file, which could take several minutes. -
Page 33: Calculation Methods
Before making measurements, you must specify the following: Calculation methods ■ Distribution network ■ ■ Type of connection Voltage ratios ■ Current sensors, their ranges, and their ratios ■ Values to record in Trend mode ■ Triggering levels for the transient and inrush current capture modes ■... - Page 34 3.4.1.2 Real Time Values Press the button in the function bar to configure the real-time values For Real-Time values, choose either 10/12 cycles and 200 ms or 150/180 cycles and 3 s. This choice will apply to the value’s calculation and display in most modes For Fundamental power factor, choose DPF, PF1, or cos φ...
- Page 35 For FK Coefficient : q, choose a value between 1.5 and 1.7 to use for the K factor calculation. The exponential constant q depends on the type of winding and the frequency A value of 1.7 is suitable for transformers where the conductor cross sections are round or square.
-
Page 36: The Distribution Network And The Type Of Connection
3.4.2 The Distribution Network and the Type of Connection Select to choose the connection of the instrument according to the distribution network Each distribution system corresponds to one or more network types. Distribution system Network Electrical Diagram Single-phase 2 wires with neutral without earth Single-phase... - Page 37 Distribution system Network Electrical Diagram Split-phase 3 wires with neutral without earth Split-phase 3 wires in open star with neutral without earth Split-phase Split-phase 3 wires 3 wires in “high leg” delta (L1, L2, and N) with neutral without earth Split-phase 3 wires in open “high leg”...
- Page 38 Distribution system Network Electrical Diagram Split-phase 4 wires with neutral and earth Three-phase 4 wires in open star with neutral and earth Three-phase Split-phase 4 wires 4 wires in “high leg” delta (L1, L2, N, and earth) with neutral and earth Three-phase 4 wires in open “high leg”...
- Page 39 Distribution system Network Electrical Diagram Three-phase 3 wires in star Three-phase 3 wires in delta Three-phase 3 wires Three-phase in open delta 3 wires (L1, L2, and L3) Indicate the current sensors that will be connected: all 3 Three-phase sensors (3A) or only 2 (A1 and 3 wires A2, A2 and A3, or A3 and A1).
- Page 40 Distribution system Network Electrical Diagram Three-phase 4 wires with neutral without earth Three-phase Three-phase 4 wires 4 wires in open “high leg” delta (L1, L2, L3, and N) with neutral Indicate which voltages will without earth be connected: all 3 voltages (3V) or only 2 (V1V2, V2V3, or V3V1).
-
Page 41: Sensors And Ratios
3.4.3 Sensors and Ratios Press to select the voltage ratios and current sensor’s ratios and range 3.4.3.1 Voltage Ratio Voltage ratios are used when the voltages are too high for the instrument and voltage transformers are used to lower them. The ratio lets you display the true voltage and use it in the calculations. -
Page 42: Trend Mode
Choice of range: ■ 0.10 A to 100.0 A AmpFlex ® ■ 1.0 A to 1000 A ■ 10 A to 10.00 kA Choice of range: ■ 0.10 A to 100.0 A MiniFlex MA194-24-BK ® ■ 1.0 A to 1000 A ■... - Page 43 Press to configure the Trend mode Select the quantities to record The frequency (Hz) is always selected. For more information about these quantities, refer to the glossary in § 20.10. Red quantities are incompatible with the configuration and cannot be recorded. Pages 2 and 3 concern the recording of harmonics.
-
Page 44: Transient Mode
3.4.5 Transient Mode The Transient mode is used to record voltage or current transients. Select to configure the Transient mode 3.4.5.1 Voltage Thresholds Press to configure the voltage thresholds For Number of cycles before trigger event, choose the number of cycles ... -
Page 45: Inrush Current Mode
If 4VE is selected, every voltage input has the same threshold, so there is only one threshold to configure. If 3VE+VNE is selected, every voltage input has the same threshold. The neutral has a different threshold, so there are two thresholds to configure. If V1E+V2E+V3E+VNE is selected, every voltage input and the neutral have different thresholds, so there are four thresholds to configure. -
Page 46: Alarm Mode
3.4.7 Alarm Mode The Alarm mode is used to monitor one or more quantities, either in absolute value or in signed value. Whenever a quantity crosses the user-defined threshold, the instrument will record information about the occurrence. Alarm active or not Threshold, hysteresis, and duration of the overshoot... -
Page 47: Energy Mode
For more information about these quantities, please refer to the glossary in § 20.10. You can also choose to have an email sent when the alarm is triggered. If there are several alarms, they can be grouped in a single email to limit the rate of emails to a maximum of one email every 5 minutes. -
Page 48: Monitoring Mode
For Enabled, select whether the specific tariff configured on the screen will be used in the calculations For Days, select the days when the specific tariff will apply For Start, specify when the specific tariff will begin on the selected days ... -
Page 49: Operation
4. OPERATION 4.1 TURNING THE INSTRUMENT ON To turn the instrument on, press the button The 8345 will display a start-up screen before displaying the waveform screen. 4.2 NAVIGATION You can use the buttons, touch screen, or remote user interface (VNC) to navigate the instrument’s menus. - Page 50 4. Press to enter the network configuration screen. 5. Press to enter the Ethernet link screen. 6. Check that the link is active. If it is active, the display will be shaded and will show in the bottom right. If it is inactive, the display will show in the bottom right, and you will have to check the physical connection between the Ethernet cable, instrument, and PC.
-
Page 51: Configuration
4.3 CONFIGURATION Before making any measurement, remember to specify: The connection type (§ 3.4.2) ■ The current sensors, the voltage ratio, and the current ratio (§ 3.4.3) ■ The calculation method, if necessary (§ 3.4.1) ■ For the recording modes, remember to specify: The quantities to record ■... -
Page 52: Three-Phase Network
4.4.3 Three-Phase Network For three-phase, 3-wire networks, indicate the current sensors that will be connected: all 3 sensors (3A) or only 2 (A1 and A2, A2 and A3, or A3 and A1) For three-phase, 4-wire and 5-wire networks, indicate the voltage sensors ... -
Page 53: Instrument Functions
Disconnecting the instrument from the network: 1. Disconnect in the reverse order of connection and always end by disconnecting the earth, neutral, or both. 2. Disconnect the leads from the instrument. 4.5 INSTRUMENT FUNCTIONS 4.5.1 Measurements There are 4 possible real-time modes: waveform , harmonics , power , and energy... -
Page 54: Help
4.5.3 Help Press the help button at any time for information about the functions and symbols used for the in-progress display mode 4.6 TURNING THE INSTRUMENT OFF To turn the instrument off, press the button The instrument will request confirmation if it is recording or metering energy, recording transients, recording alarms, or capturing inrush current, If you confirm the Power-off command, the recordings will be finalized and the instrument will turn off. -
Page 55: Waveform
5. WAVEFORM The Waveform mode screen is the initial screen when the instrument turns on. Press the button to enter waveform mode Cursor Display of voltages or currents with saturation indicators Selected display filter Values at the Functions cursor’s position Waveform mode displays voltage curves, current curves, and values calculated from the voltage and currents (except harmonics, powers, and energies). -
Page 56: Root Mean Square (Rms) Function
5.2 ROOT MEAN SQUARE (RMS) FUNCTION The RMS function displays the signals measured over a period and their RMS values averaged over 200 ms or 3 s, depending on the configuration. The configuration is explained in detail in § 3.4.1.2. Press the RMS button to access the RMS function screen ... -
Page 57: Total Harmonic Distortion (Thd) Function
The 4A display filter displays the instantaneous curves of currents and their RMS values. The L3 display filter displays the instantaneous phase 3 voltage curves, current curves, and their RMS values. Cursor Max and min of the voltages and currents Values at the cursor's position: ■... -
Page 58: Min-Max Function
5.5 MIN-MAX FUNCTION The MIN-MAX function displays the voltage’s and current’s RMS, maximum (MAX), minimum (MIN), positive peak (PK+), and negative peak (PK-) values. Press the button to access the MIN-MAX function screen The instrument will begin searching for the extreme values when it is switched on. -
Page 59: Summary Function
The L1 display filter displays the extreme values of the voltage and current of phase 1. The L2, L3, and N display filters are similar but concern phase 2, phase 3, and the neutral. 5.6 SUMMARY FUNCTION The summary function displays values for the voltage and current inputs that depend on the selected distribution network, connection type, and display filter. - Page 60 If a value cannot be calculated, the instrument will display - - -. For example, no value can be calculated because the instrument is not connected to the network. To change the display filter, use the ▲ ▼ buttons. The available display ...
-
Page 61: Phasor Function
5.7 PHASOR FUNCTION The phasor function displays the phasor diagram of the signals, the absolute values of the voltages or current, the phase difference between voltages or between currents, and the unbalance ratio or inverse unbalance ratio of the voltages or current. Press the button to access the phasor function screen ... - Page 62 The choice of current or voltage as reference can be changed in the configuration as mentioned in § 3.4.1. The L3 display filter displays the phasor diagram of the phase 3 voltage and current. A3 is the reference. The choice of current or voltage as reference can be changed in the configuration as mentioned in §...
-
Page 63: Harmonics
6. HARMONICS The voltages and currents can be analyzed as sum of sine waves at the network frequency and multiples thereof. Each multiple is a harmonic of the signal that is characterized by its frequency, amplitude, and phase difference with respect to the fundamental frequency (network frequency). -
Page 64: Display Filter
Press MSV to display the spectral level (curve) and RMS values at the configured MSV1 and MSV2 frequencies (see § 3.4.1) Press to stretch or shrink the scale of the bargraph Press to view interharmonics when the display filter concerns only one ... -
Page 65: Examples Of Screens
6.2 EXAMPLES OF SCREENS The V function with the 3L display filter Information about Cursor harmonic number 3 Envelope of the at the cursor’s maximum harmonics position: ■ Level (%f or %r) ■ Phase difference with respect to the Second page of harmonic of order 1 harmonics ■... - Page 66 To exit the function, press the button again The MSV-V function with the L1 display filter Cursor Value at the cursor’s position The MSV-U curve function with the L1 display filter Envelope of the curve Cursor Anything above the envelope is not correct Value at the The configuration...
-
Page 67: Power
7. POWER The Power mode displays power measurements (W) and power factor calculations (PF). Press the button to access the Power mode screen 7.1 DISPLAY FILTER The available display filters depend on the selected connection. Connection Display filter Single-phase, 2 wires Single-phase, 3 wires Split-phase, 2 wires Split-phase, 3 wires... - Page 68 PF function with the 3L display filter PF: power factor = P/S DPF or PF1 or cos φ: fundamental power factor The name is chosen in the configuration (see § 3.4.1) tan φ: tangent of the phase difference φVA: phase difference of the voltage with respect to the current...
-
Page 69: Energy
8. ENERGY The Energy mode is used to meter generated and consumed energy over a period and indicate the corresponding price. Press the button to access the Energy mode screen Press to access the energy configuration. To change the configuration, ... -
Page 70: Examples Of Screens
8.2 EXAMPLES OF SCREENS To change the display filter, use the ▲ ▼ buttons. The available display filters depend on the chosen distribution network and connection type Press the button in the function bar to start energy metering Wh function with the 3L display filter Energy metering is in progress... -
Page 71: Trend Mode
9. TREND MODE The Trend mode records the evolution of the quantities selected in the configuration (see § 3.4.4) for a specified duration. The number of trend recordings is limited only by the SD card’s capacity. Press the button to access the Trend mode screen ... -
Page 72: The List Of Recordings
Press the button to start the recording at the programmed date and time Press the button to suspend the in-progress recording symbol to the right of the camera icon indicates that a recording has ■ been programmed symbol to the right of the camera icon indicates that a recording is ■... -
Page 73: Reading A Recording
9.3 READING A RECORDING Select a recording from the list, and press the confirm button to open it. To change the display filter, use the ▲ ▼ buttons. The available display filters depend on the chosen distribution network and connection type To move the cursor, use the ◄... - Page 74 Phase-to-neutral voltages (V ) for an L1 display filter and The display window’s position in the recording Active power (P) for a display filter Σ The power, like energy, is displayed in bargraph form. Each bar’s duration is either 1 s or one recording period (if longer than 1 s). Press the Σ...
- Page 75 Cumulative active energy (E ) for a Σ display filter. 1. Place the cursor at the beginning of the accumulation range. 2. Press the Σ button. 3. Move the cursor to the end of the energy accumulation range. The cumulative total is displayed as it changes. The cumulative total’s start and end dates Period taken into...
-
Page 76: Transient Mode
10. TRANSIENT MODE The Transient mode records voltage or current transients for a specified duration determined by the selected configuration (see § 3.4.5). It also records shock waves, which are very high voltages for a very short time. The 8345 can record a large number of transients that is limited only by the SD card’s capacity. -
Page 77: The List Of Recordings
programmed in the configuration (§ 3.4.5) at the end of the current minute plus one minute Press the button in the function bar to suspend the in-progress recording Press the button to adjust the voltage, current, or shock wave thresholds ... -
Page 78: Reading A Recording
10.3 READING A RECORDING Channel that triggered the transient To view different pages 1. Select a recording from the list. 2. Press the confirm button to open it. 3. Press the button. 4. Use the ▲ ▼ buttons to change the display filter. The available display filters depend on the chosen distribution network and connection type. - Page 79 Transient event in all of the voltage channels Cursor Channel that triggered the transient capture Values at the cursor’s position To zoom on the event that triggered To place the the transient capture. cursor as close as possible to the This key is only triggering point active on 4V and L3...
- Page 80 Zoom on the triggering event or the maximum value Press to place the cursor as close as possible to the triggering element Press to place the cursor on the maximum Since shock waves build up quickly, these two points are often close together. Press one or more times to zoom ...
-
Page 81: Inrush Current Mode
11. INRUSH CURRENT MODE The Inrush Current mode is used to capture and record inrush currents for a duration specified by the selected configuration (see § 3.4.6). The 8345 can record a large number of inrush current captures that is limited only by the SD card’s capacity. -
Page 82: The List Of Captures
programmed time, if the SD card has enough space Press the button in the function bar to start the capture of a current programmed in the configuration (§ 3.4.6) at the end of the current minute plus one minute Press the button in the function bar to suspend the in-progress recording ... -
Page 83: Rms Values
current detections, start date, start time, duration, and the channel that triggered the capture. Press the confirm button again to display information about the capture Press to configure a new capture 11.3.1 RMS Values Press the RMS button to view the RMS voltage and current values ... -
Page 84: Instantaneous Values
Capture of inrush current in RMS on 3A Maximum values The display Disc 2 is solid, which window’s position means channel A2 in the recording triggered the capture Values at the Cursor cursor’s position Capture of RMS inrush current on L2 Press to place the cursor on the minimum voltage ... - Page 85 The maximum duration of a RMS+WAVE recording is 10 minutes. In this case, it can take up to a minute to display the curves. Capture of instantaneous inrush current values on 4A Max instantaneous absolute values Capture of instantaneous inrush current values on L3 Power Quality Analyzer PowerPad IV Model 8345 ®...
-
Page 86: Alarm Mode
12. ALARM MODE The Alarm mode detects and records overshoots of the selected quantities in configuration (see § 3.4.7) for a specified duration. The 8345 can record a large number of alarm recordings and is limited only by the SD card’s capacity. Each alarm recording can contain up to 20,000 alarms. The max number of alarms per recording is determined in the configuration. -
Page 87: The List Of Alarm Recordings
Press to start the alarm recording at the programmed time Progress of alarm The alarm recording recording is in progress Press the button in the function bar to start an alarm recording programmed in the configuration (§ 3.4.5) at the end of the current minute plus one minute Press the button in the function bar to modify the alarm recording... -
Page 88: Starting An Alarm Recording
12.3 STARTING AN ALARM RECORDING Select an alarm recording from the list, and press the confirm button open it To change the display filter, use the ▲ ▼ buttons. The available display filters depend on the chosen distribution network and connection type The alarm’s duration Beginning of the alarm Display filter... -
Page 89: Monitoring Mode
13. MONITORING MODE The Monitoring mode monitors electrical networks per standard EN 50160. In this mode, the 8345 detects: Slow variations ■ Rapid variations and interruptions ■ Voltage dips ■ Temporary voltage swells ■ Transients ■ Therefore, a monitoring recording will trigger a trend recording, a search for transients, an alarm recording, and a log of events. - Page 90 2. Select the Configure monitoring option. The configuration window will open with 5 tabs: • Monitoring • Slow variations thresholds • Interruptions and Rapid Voltage Changes (RVC) • Voltage Dips and Swells • Transients 3. In the Monitoring tab, indicate the nominal voltage, the frequency, and the name of the file that will contain the monitoring recording.
-
Page 91: The List Of Monitoring Recordings
Press to program a monitoring recording For Start, specify when the recording will begin For End, specify when the recording will end For Name, enter the recording’s name (up to 8 characters long) using capital letters (A-Z), numbers (0-9), and symbols (&, _, and -) Progress of the recording Press the... -
Page 92: Reading A Monitoring Recording
If the end date is red, the recording could not continue to the planned end date because of: A power supply problem (the instrument turned off due to low battery) ■ The maximum number of transients was reached ■ A write error on the SD card ■... -
Page 93: Screenshots
14. SCREENSHOTS button is used to take screenshots and view recorded screenshots. The screenshots are recorded on the SD card in the directory 8345\Photograph. You can read the screenshots on a PC via the application software or an SD card reader (not provided). 14.1 TAKING A SCREENSHOT You have two ways to take a screenshot: Hold the... -
Page 94: Displaying A Screenshot
14.2.1 Displaying a Screenshot To display a screenshot, select it and press the confirm button The instrument will display the selected screenshot. To view the different The mode icon and screenshots that make alternate blinking up the photograph Press to erase the screenshot ... -
Page 95: Help
15. HELP button will give you information about the various button functions and symbols used for the in-progress display mode. Some modes, like Power mode, have three available help screens, while others, like Waveform mode, only have two help screens. Examples of a help screen in Power mode are below. -
Page 96: Application Software
16. APPLICATION SOFTWARE The Power Analyzer application software is used to: Configure the instrument and measurements ■ Start and schedule measurements ■ Transfer the instrument’s data to a PC ■ The application software can also export the configuration to a file and import a configuration file. -
Page 97: Technical Specifications
17. TECHNICAL SPECIFICATIONS The 8345 complies with standard IEC 61000-4-30, Class A. 17.1 REFERENCE CONDITIONS Quantity of Influence Reference Conditions Ambient temperature 23 °C ± 3 °C Relative humidity 40 %RH to 75 %RH Atmospheric pressure 860 hPa to 1060 hPa Environmental <... - Page 98 Quantity of Influence Reference Conditions 3 phases available Phases (for three-phase systems) DC components of voltage and current Waveform Sine wave Electrical network frequency 50 Hz ± 0.5 Hz or 60 Hz ± 0.5 Hz ± 1 % Phase-to-neutral voltage Voltage amplitude between 100 V and 400 V Phase-to-phase voltage...
- Page 99 Nominal current (A ) depending on the sensor Nominal Full-Scale Full-Scale Technical Current Sensor Commercial RMS Current RMS per Class A per Class A 100 A 14.14 A to 16.97 A 30 A AmpFlex 193 and 1000 A 141.42 A to 169.71 A 300 A ®...
-
Page 100: Electrical Specifications
17.2 ELECTRICAL SPECIFICATIONS 17.2.1 Input Voltage Specifications to 1000 V phase-neutral and neutral-earth Range of Use to 1700 V phase-phase without exceeding 1000 V with respect to earth 2 MΩ between phase and neutral Input Impedance 2 MΩ between neutral and earth Permanent Overload 1200 V phase-neutral and neutral-earth... - Page 101 Waveform - Min-Max: RMS measurements: 512 spc stream ■ Min, Max measurements: 40 kS/s stream ■ ■ Pk+, Pk- measurements: 40 kS/s stream Transients: ■ 3U, 4V, 4A filters: 512 spc stream L1, L2, L3, N filters: 512 spc stream ■...
-
Page 102: Instrument Specifications (Without Current Sensors)
17.2.4 Instrument Specifications (Without Current Sensors) 17.2.4.1 Currents and Voltages Measurement Range Display without ratio Measurement Resolution Max Intrinsic Error (with unity ratio) (unity ratio) Frequency 42.50 Hz 69.00 Hz 10 mHz ±10 mHz 5.000 V 9.999 V 4 digits ±(0.1 % + 100 mV) 10.00 V 600.0 V... - Page 103 Measurement Range Display without ratio Max Intrinsic Measurement Resolution (with unity ratio) Error (unity ratio) 1.000 A 47.09 A 4 digits ±(0.5 % + 200 mA) SR193 clamp 47.10 A 566.0 A 4 digits ±0.5 % MR193 clamp 566.1 A 1000 A 4 digits ±(0.5 % + 200 mA)
- Page 104 Measurement Range Display without ratio Max Intrinsic Measurement Resolution (with unity ratio) Error (unity ratio) SR193 clamp 1.000 A 1000 A 4 digits ±(1 % + 1 A) MR193 clamp MN93 clamp 200.0 mA 200.0 A 4 digits ±(1 % + 1 A) SL261 clamp (10 mV/A) 200.0 mA...
- Page 105 Measurement Range Display without ratio Max Intrinsic Measurement Resolution (with unity ratio) Error (unity ratio) SR193 clamp 1.000 A 1414 A 4 digits ±(1 % + 2 A) MR193 clamp MN93 clamp 200.0 mA 282.8 A 4 digits ±(1 % + 2 A) SL261 clamp (10 mV/A) 200.0 mA 141.4 A...
- Page 106 Measurement Range Display without ratio Max Intrinsic Measurement Resolution (11) (with unity ratio) Error (unity ratio) ±(1 % + 10 pt) Without |sin φ| ≥ 0.5 AmpFlex and THD ≤ 50 % ® 1.000 var 10.00 Mvar 4 digits ±(1.5 % + 10 pt) Reactive power MiniFlex ®...
- Page 107 Measurement Range Display without ratio Max Intrinsic Measurement Resolution (11) (with unity ratio) Error (unity ratio) ±(1 % + 10 pt) Without |sin φ| ≥ 0.5 AmpFlex and THD ≤ 50 % ® 9,999,999 up to 1 var·h Mvar·h 7 digits ±(1.5 % + 10 pt) Reactive energy MiniFlex...
- Page 108 17.2.4.3 Quantities Associated with Power Values Measurement Range Display Measurement Max Intrinsic Error Resolution Fundamental phase -179 ° 180 ° 0.1 ° ±2 ° differences cos φ (DPF, PF 4 digits ±5 pt tan φ -32.77 32.77 4 digits ±1 ° if THD < 50 % ±3 pt if u ≤...
- Page 109 Measurement Range Display Measurement Max Intrinsic Error Resolution ±(2.5 % + 5 pt) Total harmonic if Ɐ n ≥ 1, t ≤ (100 ÷ n ) [%] distortion (THD) of the current with respect to the ±(2 % + (n ×...
- Page 110 Measurement Display Range Measurement Resolution Max Intrinsic Error (with unity ratio) (unity ratio) 4 digits phase-to- 1000 V ±(2.5 % + 1 V) RMS voltage neutral 4 digits of harmonic 4 digits (order n ≥ 2) phase-to- 2000 V ±(2.5 % + 1 V) phase 4 digits Distorting...
- Page 111 Measurement Display Range Measurement Resolution Max Intrinsic Error (with unity ratio) (unity ratio) SR193 clamp 4 digits 1000 A ±((n x 0.4 %) + 1 A MR193 clamp 4 digits MN93 clamp 200 mA 200 A 4 digits ±((n x 0.4 %) + 1 A SL261 clamp 4 digits (10 mV/A)
-
Page 112: Specifications Of The Current Sensors
17.2.5 Specifications of the Current Sensors You must add the measurement error on the RMS current and phase error to any instrument error for measurements that use the current measurements: powers, energies, power factors, tangents, etc. At 50/60 Hz Sensor Type Maximum RMS Current (A Maximum Error... -
Page 113: Uncertainty Of The Real-Time Clock
To avoid saturation, you must meet the following condition: n=∞ ∑ [n. I ] < I The range of the current sensor is I ■ The order of the harmonic is n ■ ■ The current of the harmonic of order n is I For example, the input current range of a dimmer must be one-fifth of the current range selected on the instrument. -
Page 114: Power Supply
17.4 POWER SUPPLY 17.4.1 Battery The instrument’s power supply unit is a 10.9 V, 5700 mA·h, Li-ion battery pack. Voltage 10.86 V Nominal capacity 5700 mA·h Minimum capacity 5500 mA·h 11 % after 200 charge-discharge cycles Loss of capacity 16 % after 400 charge-discharge cycles 50 °F <... -
Page 115: External Power Supply
17.4.2 External Power Supply You can connect the 8345 to an external power supply to charge the battery or conserve battery life. The instrument can operate while charging. The instrument has two compatible chargers: PA32ER Nominal voltage and 1000 V CAT IV overvoltage category 100 V to 1000 V... -
Page 116: Display Conditions
17.5 DISPLAY CONDITIONS The display unit is an active matrix LCD (TFT) with the following specifications: Diagonal: 7 in (18 cm) Resolution: 800 pixels x 480 pixels (WVGA) Colors: 262,144 colors used for display Backlight: LED Field of view: 85° in all directions 17.6 ENVIRONMENTAL CONDITIONS The instrument must be used in the following environmental conditions. -
Page 117: Mechanical Specifications
17.7 MECHANICAL SPECIFICATIONS Dimensions (L x D x H): 7.87 in x 11.22 in x 2.17 in (200 mm x 285 mm x 55 mm) Weight: 4.41 lb (2 kg) Display unit: 5.98 in x 3.58 in (152 mm x 91 mm) Display unit (diagonal): 7 in (178 mm) Index of protection: IP54 per IEC 60529 when the 5 elastomer caps are closed and no leads are... -
Page 118: Standard Iec 61000-4-30, Class A
17.8.2 Standard IEC 61000-4-30, Class A All of the measurement methods, measurement uncertainties, measurement ranges, aggregations of measurements, flagging, and markings comply with the requirements of IEC 61000-4-30, edition 3.0, for instruments of Class A. The 8345 performs measurements and calculations for the following. Line frequency over 10 s ■... - Page 119 Measurement Range of Quantity Parameter Uncertainty Range of Influence Amplitude [110 %; 200 %] U ±0.2 % U ∈ [100 V; 400 V] (V) Voltage swells Beginning ½ cycle ∈ [200 V; 1000 V] Duration ≥½ cycle 1 cycle Beginning ½...
-
Page 120: Markings Per Iec 62586-1
17.8.4 Markings per IEC 62586-1 The marking PQI-A-PI means: PQI-A: Class A power quality instrument P: Portable measuring instrument I: Indoor use 17.9 ELECTROMAGNETIC COMPATIBILITY (EMC) The instrument is in compliance with the requirements of standard IEC/EN 61326-1 or BS EN 61326-1. The instrument is intended for use in an industrial environment ■... -
Page 121: Maintenance
18. MAINTENANCE Except for the batteries, the instrument contains no parts that can be replaced by untrained or unaccredited personnel. Any unapproved work or part replacement using equivalents may gravely compromise safety. 18.1 CLEANING THE HOUSING 1. Disconnect anything connected to the instrument. 2. - Page 122 Prop Battery Battery release recess Notches Replacing the battery: 1. Disconnect anything connected to the instrument. 2. Turn the instrument over and insert a flat-head screwdriver into the battery release recess. 3. Push down on the screwdriver to release the battery. 4.
-
Page 123: Memory Card
18.4 MEMORY CARD The instrument accepts type SD (SDSC), SDHC, and SDXC memory cards. Lock the memory card when you remove it from the instrument Unlock the SD card before putting the card back into the instrument Unlocked memory card Locked memory card 1. -
Page 124: Repair And Calibration
18.6 REPAIR AND CALIBRATION To ensure that your instrument meets factory specifications, we recommend that it be sent back to our factory Service Center at one-year intervals for recalibration, or as required by other standards or internal procedures. For instrument repair and calibration: You must contact our Service Center for a Customer Service Authorization Number (CSA#). -
Page 125: Limited Warranty
18.8 LIMITED WARRANTY The instrument is warrantied to the owner for a period of two year from the date of original purchase against defects in manufacture. This limited warranty is given by AEMC Instruments, not by the distributor from whom it was ®... -
Page 126: Notation
20. APPENDICES This section has the formulas used to calculate the different parameters and the definitions for abbreviations. The formulas comply with standard IEC 61000-4-30, edition 3.0, for Class A instruments and comply with IEEE 1459, 2010 edition, for the power formulas. 20.1 NOTATION Notation Description... -
Page 127: Formulas
20.2 FORMULAS 20.2.1 RMS Values The quantities are calculated in accordance with standard IEC 61000-4-30, edition 3.0, § 5.2.1. The RMS value includes the DC component. 20.2.2 Peak Values 20.2.3 Crest Factor With Y = max(|Y |,|Y 20.2.4 Levels of Harmonics and Interharmonics The quantities are calculated in accordance with standard IEC 61000-4-7, edition 2.0 A1, §... -
Page 128: Level Of Unbalances
20.2.5 Level of Unbalances The quantities are calculated in accordance with standard IEC 61000-4-30, edition 3.0, § 5.7.1. The supply voltage’s is evaluated by the method of symmetrical components. In addition to direct component U1, an unbalance will add at least one of the following components: inverse component U2 or zero sequence component U0. -
Page 129: Level Of Harmonic Group Distortion
20.2.7 Level of Harmonic Group Distortion The quantities are calculated in accordance with standard IEC 61000-4-7 A1, edition 2.0, § 3.3.2. 20.2.8 Distortion 20.2.9 K Factor and Harmonic Loss Factor These quantities concern only the current and are calculated in accordance with standard IEEE C57.110, 2004 edition, §... -
Page 130: Frequency
20.2.10 Frequency This quantity is calculated in accordance with standard IEC 61000-4-30, edition 3.0, § 5.1.1. The zero crossings method is used. The aggregation’s duration depends on the instrument’s configuration (10 seconds in Class A mode). 20.2.11 DC Component Mean of the M samples YL. 20.2.12 Active Power (P) This quantity is calculated in accordance with standard IEEE 1459, 2010 edition, §... -
Page 131: Fundamental Reactive Power (Q 20.2.15 Harmonic Active Power (P H )
20.2.14 Fundamental Reactive Power (Q This quantity is calculated in accordance with standard IEEE 1459, 2010 edition, § 3.1.2.6. Fundamental reactive power, per phase: with φV = angle between V and I , V and I of the fundamental in channel L. Total fundamental reactive power: 20.2.15 Harmonic Active Power (P This quantity is calculated in accordance with standard IEEE 1459, 2010 edition,... -
Page 132: Non-Active Power (N)
20.2.18 Non-Active Power (N) This quantity is calculated in accordance with standard IEEE 1459, 2010 edition, § 3.1.2.14. Non-active power, per phase: Total non-active power: 20.2.19 Distorting Power (D) Distorting power, per phase: Total distorting power: 20.2.20 Power Factor (PF), Power Factor of Fundamental (PF1) These quantities are calculated in accordance with standard IEEE 1459, 2010 edition, §... -
Page 133: Tangent
20.2.21 Tangent Tangent of the difference between the angle of the fundamental voltage and the angle of the fundamental current. Tangent, per phase: Total tangent: 20.3 FLICKER The quantities are calculated in accordance with class F3 of standard IEC 61000-4-15, edition 2.0, § 4.7.3, § 4.7.4, and § 4.7.5. Flicker measures the human perception of the effects of fluctuations in the amplitude of the voltage supplying a lamp. -
Page 134: Sources Of Distribution Supported By The Instrument
20.4 SOURCES OF DISTRIBUTION SUPPORTED BY THE INSTRUMENT For more information, review the connections in § 4.4. 20.5 HYSTERESIS Hysteresis is a filtering principle used in Alarm mode (see § 12) and Inrush Current mode (see § 11). Carefully adjusting the hysteresis avoids a repeated change of state when the measurement oscillates around the threshold. -
Page 135: Minimum Scale Values Of Waveforms And Minimum Rms Values
20.6 MINIMUM SCALE VALUES OF WAVEFORMS AND MINIMUM RMS VALUES Minimum Scale Values Minimum RMS Values (Waveform mode) Phase-to-earth and phase-to-phase voltages AmpFlex 193 (10 kA) ® 80 A 10 A MiniFlex MA193 (10 kA) ® AmpFlex 193 (1 kA) ®... -
Page 136: Transient Capture Triggering Mechanism
20.8 TRANSIENT CAPTURE TRIGGERING MECHANISM When a search for transients begins, each sample is compared to the sample from the previous cycle. In standard IEC 61000-4-30, this monitoring method is called the “sliding window method”. The previous cycle corresponds to the middle of a virtual tube;... -
Page 137: Glossary
20.10 GLOSSARY AC and DC components AC component only DC component only Inductive phase shift Capacitive phase shift ° Degree Expert mode Absolute values Phase difference of the phase-to-earth voltage (phase voltage) with φ respect to the phase-to-earth current (line current) Phase difference of the phase-to-phase voltage (line voltage) with φ... - Page 138 Frequency range within which the response of an instrument is Bandwidth greater than minimum British thermal unit Crest factor for current or voltage: the ratio of peak current to RMS current A measurement channel corresponds to a difference of potential between two conductors.
- Page 139 Kilo (10 K factor calculated per IEEE C57.110. A transformer’s ability to be used with loads that consume non-sinusoidal currents Line (channel) Milli (10 Mega (10 Maximum value calculated over either 10 cycles or 12 cycles depending on whether the frequency is 50 Hz or 60 Hz Minimum value calculated over either 10 cycles or 12 cycles depending on whether the frequency is 50 Hz or 60 Hz Millisecond...
- Page 140 Total harmonic distortion is the percentage of harmonics in a signal, referred to the RMS value of the fundamental (%f) or to the total RMS value without DC (%r) Phase-to-phase voltage or voltage between phases Voltage zero (or homopolar) sequence unbalance ratio Voltage negative (or inverse) sequence unbalance ratio (neutral connected) or phase-to-phase voltage (neutral disconnected) Phase-to-phase voltage between phases 1 and 2...
- Page 141 Phase-to-earth voltages: 100 V, 220 V, 240 V, 380 V ■ Phase-to-phase voltages: 200 V, 220 V, 380 V, 415 V, 600 V, 660 V ■ Phase-to-phase RMS voltage Coordinated Universal Time Total harmonic distortion of the phase-to-phase voltage Harmonic distortion of the phase-to-phase voltage referred to the thdf RMS value of the fundamental Harmonic distortion of the phase-to-phase voltage referred to the...
-
Page 142: Unit Prefixes
20.11 UNIT PREFIXES SI Unit Prefixes Prefix Symbol: Multiplies by Milli- Kilo- Mega- Giga- Tera- Peta- Exa- Power Quality Analyzer PowerPad IV Model 8345 ®... - Page 143 NOTES: Power Quality Analyzer PowerPad IV Model 8345 ®...
- Page 144 10/22 99-MAN 100563 v0 AEMC Instruments ® 15 Faraday Drive • Dover, NH 03820 USA Phone: (603) 749-6434 • (800) 343-1391 • Fax: (603) 742-2346 www.aemc.com © Chauvin Arnoux , Inc. d.b.a. AEMC Instruments. All Rights Reserved. ® ®...
Need help?
Do you have a question about the PowerPad IV 8345 and is the answer not in the manual?
Questions and answers