Table of Contents
Advertisement
Quick Links
Advertisement
Table of Contents

Related Manuals for Luna 4600


Summary of Contents for Luna 4600
- Page 1 Optical Backscatter Reflectometer 4600 User Guide...
- Page 2 User Guide. Optical Backscatter Reflectometer Model 4600 Versions: User Guide 6, OBR 4600 Software 3.12.0 © 2013 Luna Technologies 3157 State Street Blacksburg, VA 24060...
-
Page 3: Table Of Contents
Contents 1. System Overview 1 The Control Software 2 Time Domain Data 4 Frequency Domain 4 Frequency Domain Resolution 5 2. Assembly and Startup 7 Components List 7 Setting up the OBR 11 Initial Startup 12 3. Software Guide 17 Window Features 18 System Control 19 Data Processing 21... - Page 4 Contents Instrument Configuration 34 Calibrating the System 35 Calibration Files 36 Conditions that Require Calibration 36 Consideration Prior to Calibrating 36 The Calibration Procedure 37 Checking the Calibration 38 Storing Multiple Calibrations 39 Acquiring Data 40 Single-Scan Mode 41 Continuous Scan Mode 43 Fast Scan Mode 44 Spot Scan Mode 44 Extended Range Spot Scan Mode 46...
- Page 5 Optical Backscatter Reflectometer 4600 5 User Guide Spreadsheet File Data 66 Displaying Two Parameters in Lower Graph 66 Manipulating Plots 67 Updating Lower Graph 67 Parameter Selection 68 Scaling Plot Axes 69 Autoscaling 69 Manual scaling 70 Using zoom tools 70...
- Page 6 Contents Viewing Segment Details 91 Comparing a Failing Trace to the Reference 93 Comparing Traces Using the Trace Comparison Window 93 Editing a Reference Trace: Processing Parameters and General Tolerances 94 Setting the Maximum Device Length 95 Resetting the Default Parameters 96 Suggested Setup and Use 97 Description of Processing Parameters and Tolerances 97 Characteristic Length (m) 98...
- Page 7 Optical Backscatter Reflectometer 4600 7 User Guide Standard Commands 121 System Level Commands 124 Configuration Commands 132 Data Capture and Retrieval Commands 144 Alphabetical Command Summaries 163 8. Measurement Theory 173 Fiber Optic Interferometry 173 Optical Network for OBR 174...
- Page 8 Contents Time Domain Linear Amplitude 181 Time Domain Polarization States 181 Time Domain Phase Derivative 182 Time Domain Magnitude Difference 182 Frequency Domain Return Loss 183 Frequency Domain Group Delay 183 Frequency Domain Window 184 How Frequency Domain Window Effects Measurements 186 Optional Distributed Sensing Parameters 187 Measurement Technique 188 Temperature Change and Strain 189...
- Page 9 Optical Backscatter Reflectometer 4600 9 User Guide 10. Troubleshooting 203 System Status Bar Messages 203 General Troubleshooting 204 The OBR or PC will not power on 204 Laser Ready light does not come on within several minutes 205 Control software will not load 205...
- Page 10 Contents A. Specifications Minimum PC Requirements 214 Class 1 Laser Product 214 Index 215...
-
Page 11: System Overview
Chapter 1 System Overview Luna Technologies’ Optical Backscatter Reflectometer (OBR) is the industry’s first ultra-high resolution reflectometry device with backscatter-level sensitivity for interrogating components or systems. The OBR uses swept-wavelength coherent interferometry to measure minute reflections in an optical system as a function of length. -
Page 12: The Control Software
2 Chapter 1 System Overview • Locate loss events—Monitor backscatter levels to isolate losses due to bends, crimps, bad splices, etc. • “Look inside” devices—Use high resolution and sensitivity to interrogate individual components within a subsystem. • Track Polarization—Track changes in the state-of-polariza- tion as light propagates through an optical network. - Page 13 Optical Backscatter Reflectometer 4600 3 User Guide Distributed Sensing Options (Lower Graph) The following time domain parameters are only available to users who purchase spectral shift or Distributed Sensing options with the OBR. • Magnitude Difference (See page 182) •...
-
Page 14: Time Domain Data
4 Chapter 1 System Overview The control software also provides many tools for data acquisition, manipulation, and display. Data may be acquired in standard, spot, or fast scan in continuous or regular scan mode. Postprocessing allows the user to change the spatial resolution without the need to redo the measurement. -
Page 15: Frequency Domain Resolution
If the step is too large, information about the device is lost. If the step is too small, extraneous noise enters the measurement. Luna Technologies’ OBR software allows the user to select precisely the correct step size by setting the time domain window so that it includes only the device response. - Page 16 6 Chapter 1 System Overview...
-
Page 17: Assembly And Startup
The Optical Backscatter Reflectometer is shipped with either a laptop or a PC with monitor, keyboard and mouse. All other components shown below are shipped with each OBR instrument. Optical Backscatter Reflectometer 4600 instrument. One (1) USB cable to connect the OBR instrument to the PC... - Page 18 Chapter 2 Assembly and Startup One (1) power cord for the OBR instrument. (Plus two (2) more, if you ordered the PC and monitor) OBR laptop PC (or desktop PC, shown below) Laptop power supply OBR desktop PC (or laptop PC, shown above)
- Page 19 Optical Backscatter Reflectometer 4600 9 User Guide 17-inch flat panel monitor (with desktop only) Monitor-PC interface cable (with desktop only) Keyboard (with desktop only) Mouse (with desktop only) Gold reflector...
- Page 20 Chapter 2 Assembly and Startup This OBR 4600 User Guide Software recovery CD-ROM Optical fiber connector cleaner Optical fiber bulkhead connector cleaners If components are missing or damaged, contact Luna Technologies toll free at 866-586-2682 or by e-mail at support@lunatechnologies.com.
-
Page 21: Setting Up The Obr
Optical Backscatter Reflectometer 4600 11 User Guide Setting up the OBR Important The instrument should always be fully assembled before turning power on to any of its components. To set up the OBR Remove all the OBR components from the shipping containers and verify that no components are missing. -
Page 22: Initial Startup
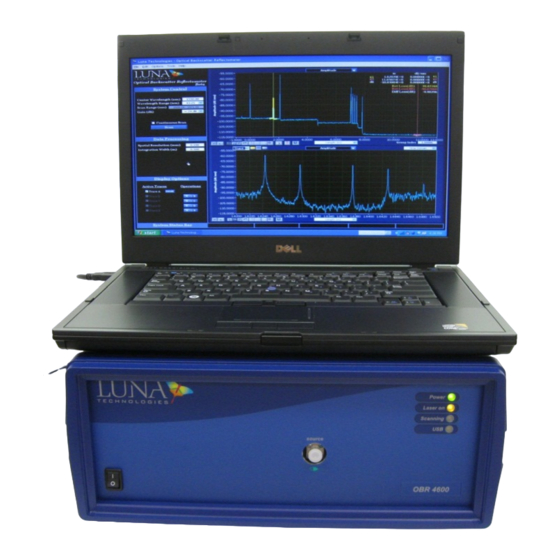
Windows version and options.) ® If you purchased a PC from Luna Technologies, it comes with the OBR control software already installed. If not, install the OBR software now. (From the Luna Technologies CD provided, open the OBR 4600 folder and run setup.exe, following on-screen instructions.) - Page 23 Optical Backscatter Reflectometer 4600 13 User Guide All LEDs on the front panel of the instrument will turn on, then all but the Power LED will turn off. The Power LED will remain lit until the unit is powered off.
- Page 24 “Include this location in the search” checkbox. Click the “Browse” button to select the location of the driver. Browse to the location where the instrument software was installed (e.g. C:\Documents and Settings\All Users\Application Data\Luna Technologies\OBR v#.#) and then into the “USB_Drivers” sub- directory. Click “OK”.
- Page 25 Optical Backscatter Reflectometer 4600 15 User Guide An alert dialog will be displayed: Click the “Continue Anyway” button to proceed. A new window will be displayed: Click the “Finish” button to complete installation of the driver. It is helpful to make a note of which USB port you used Important for the OBR instrument.
- Page 26 16 Chapter 2 Assembly and Startup Start the control software by double-clicking the OBR desktop icon or by selecting OBR Software from the programs group in the Windows Start menu. An initial window will appear for a few moments ® while the user interface is initialized.
-
Page 27: Software Guide
Chapter 3 Software Guide The control software is the primary interface between the user and the instrument. It provides all of the necessary tools to reference the system and to perform precise loss and reflection measurements of fiber-coupled optical devices. It also contains a variety of powerful features for data manipulation and display. -
Page 28: Window Features
18 Chapter 3 Software Guide Window Features Figure 3-1. OBR control software main window, with data loaded. Note that the upper vertical cursors are on, so loss calculations are shown in the upper graph. The sensing features and shift reference displayed in the Data Processing and Display Options areas are not available on all OBR units. -
Page 29: System Control
Optical Backscatter Reflectometer 4600 19 User Guide (if purchased) the fields in this area change. (See “Distributed Sensing Measurements” on page 48.) The Display Options area allows the user to control which traces are being displayed, to move data within local memory, and to view the Details of each measurement loaded into memory. - Page 30 20 Chapter 3 Software Guide Figure 3-2. The System Control area in the main OBR software window, shown in Normal (left) and Extended (right) Distance Range modes. Also in the left example, Spot Scans have been enabled by turning on the Spot Scan Cursor. •...
-
Page 31: Data Processing
Optical Backscatter Reflectometer 4600 21 User Guide • Clicking the Spot Scan button (as shown in the left side of Figure 3-2) starts a spot measurement of the device under test. (See “Spot Scan Mode” on page 44.) This same button is used to stop a Spot Scan when operating in Continuous Mode. - Page 32 22 Chapter 3 Software Guide in a given trace may be graphed by clicking in the adjacent checkbox. It may be moved from Trace A to another trace by clicking a button in the Operations column. Figure 3-4. The Display Options area in the main OBR software window. Only two traces will be available when the OBR is turned off (desktop analysis mode), and with some high resolution configurations.
-
Page 33: Graphs
Optical Backscatter Reflectometer 4600 23 User Guide Graphs Each Graph area contains controls for selecting the content of the graph and for manipulating how the graph is displayed. Figure 3-5. The upper graph area in the main OBR software window. - Page 34 24 Chapter 3 Software Guide Figure 3-6. The parameters menu on the left is available for the upper graph. The menu on the right is the Time Domain menu for the lower graph area. The last five parameters will be gray (unavailable) in some models. By selecting Fre- quency Domain in the top right corner of the lower graph area, the menu shown in the center becomes available.
- Page 35 Optical Backscatter Reflectometer 4600 25 User Guide Button Description Page Sets the mouse cursor to a cross-hair that allows the user to drag graph cursors. Allows the user to select from the following zoom tools that appear in a pop-up menu. A blue border surrounds the selected tool.
- Page 36 26 Chapter 3 Software Guide Button Description Page Toggles two vertical cursor lines on or off. Note that when these cursors are on in the upper graph, differential and return loss are calculated and displayed in the upper right legend. Also, the data points integrated to calculate loss are highlighted in contrasting colors.
-
Page 37: The Menu Bar
Optical Backscatter Reflectometer 4600 27 User Guide Button Description Page Allows the user to set the location of subsequent spot scans. Locks the spot scan cursor onto the active cursor. Saves the current graph as a .jpg image file. The center button recalculates the data in the lower graph area based on the data in the upper graph highlighted by the yellow (left) or orange (right) vertical cursor. -
Page 38: The Edit Menu
28 Chapter 3 Software Guide • Load Reference File allows the user to select a file from the hard drive to load into the shift reference. (See “Distributed Sensing Measurements” on page 59.) This feature is only available as a pur- chased option, and will otherwise be gray in the file menu. - Page 39 Optical Backscatter Reflectometer 4600 29 User Guide vertical cursors are on and when the lower graph displays fre- quency domain data. Data resolution is further discussed under “Resolution Bandwidth Calculations” on page 177. • Data Decimation (Upper Graph) > Specify Level allows the user to select data decimation level, as explained under “Data Decima-...
-
Page 40: The Tools Menu
30 Chapter 3 Software Guide >Set Logging Options calls up a dialog box where the user may set the directory and filename prefix for logged data. • Fast Scanning: > Fast Scanning Enabled turns on (checked) and off (unchecked) fast scanning. -
Page 41: The Help Menu
• Install New Feature Key calls up a dialog box where the user may enter a key string provided by Luna Technologies, in order to unlock a newly purchased software feature. • Reset Hardware allows the user to reset the OBR hardware with- out having to turn off the device. - Page 42 32 Chapter 3 Software Guide...
-
Page 43: Performing Measurements
Indicator LEDs Power switch Optical Port (FC/APC Connector) Figure 4-1. The OBR 4600 instrument. Four LEDs indicate the state of the instrument: • The Power LED lights when the power is on. •... -
Page 44: Aligning The Obr Optics
34 Chapter 4 Performing Measurements Aligning the OBR Optics In order to perform accurate measurements, the internal optics of the OBR must be properly aligned. The three conditions that require an alignment to be performed are listed below. Alignment must be performed... When the instrument is initially set up for the first time. -
Page 45: Calibrating The System
Optical Backscatter Reflectometer 4600 35 User Guide Figure 4-2. The Instrument Configuration dialog box allows the user to set the maximum device length and resolution, and shows the resultant wavelength range and number of traces available. Changing the desired resolution in the lower left pull-down menu (Figure 4-2) may require a software restart, depending on how much the settings change. -
Page 46: Calibration Files
36 Chapter 4 Performing Measurements Calibration Files The most recent calibration is stored in a file which is loaded by the control software upon start-up. If the software is unable to locate a calibration file, a dialog box will appear to alert the user that a calibration must be performed before a measurement can take place. -
Page 47: The Calibration Procedure
Optical Backscatter Reflectometer 4600 37 User Guide The Calibration Procedure To calibrate the system Ensure that the OBR unit is powered on and that the laser is on and ready. The Laser On light on the front of the instrument comes on when the laser reaches operating temperature. -
Page 48: Checking The Calibration
38 Chapter 4 Performing Measurements Align the connector key to fit in the groove in the bulkhead adaptor. Turn the screw ring around the connector clockwise until it is just tightened. Click OK. A dialog box appears as calibration proceeds. A prompt appears instructing the user to disconnect the reference fiber and reflector. -
Page 49: Storing Multiple Calibrations
(For the return loss accuracy see the Specifications Sheet shipped with your OBR unit.) If the return loss curve is not nominally flat, perform a second calibration. If this fails to yield a nominally flat return loss curve, contact Luna Technologies toll free at 866-LUNAOVA (866-586-2682). Storing Multiple Calibrations Users may store more than one calibration file, covering different wavelength ranges. -
Page 50: Acquiring Data
40 Chapter 4 Performing Measurements Click on the Use Default Calibration Filename(s) checkbox, leaving it unchecked, as shown above. The Calibration Filename field becomes accessible. Type in a new filename. Alternately, if other calibration files have been saved, the user may select a previously-saved calibration file from the pull-down list. -
Page 51: Single-Scan Mode
Optical Backscatter Reflectometer 4600 41 User Guide page 46). Each option performs a complete scalar measurement of the device (or section of the device, for Spot Scans) under test, and all parameters are available from measurements done in any mode. - Page 52 42 Chapter 4 Performing Measurements Figure 4-6. The System Control area in the main OBR software window, shown in Normal (left) and Extended (right) Distance Range modes. In Normal Range mode, select a Wavelength Range from the pull- down menu. If the desired scan range falls outside the range of the most recent calibration, either select a smaller scan range or recalibrate the OBR.
-
Page 53: Continuous Scan Mode
Optical Backscatter Reflectometer 4600 43 User Guide Click Scan in the System Control area (Figure 4-6). The instrument performs the measurement and the software displays the test data in the upper graph. Note that even if Options > Display Options > Auto-Update Lower Graph is off (unchecked), data may appear in the lower graph window from a previous scan. -
Page 54: Fast Scan Mode
44 Chapter 4 Performing Measurements Fast Scan Mode In both the Single Scan and Continuous Scan modes, the user may chose to increase the scanning rate from the default setting. Spot Scans (see below) may also be performed at a user-set scanning rate. The user should note that Fast Scanning increases the laser sweep rate to decrease measurement time. - Page 55 Optical Backscatter Reflectometer 4600 45 User Guide performed in both the Single Scan and Continuous Scan modes, at default or user- set scanning speeds. To perform a single spot-scan measurement If desired, select Options > Fast Scanning > Set Fast Scan Rate to set the scanning rate.
-
Page 56: Extended Range Spot Scan Mode
46 Chapter 4 Performing Measurements To perform continuous spot-scan measurements Follow the instructions above for a single Spot Scan. In the System Control Area, click to enable Continuous Scan mode. Optional: If Data Logging is desired, select Options > Spot Scan > Logging Enabled. -
Page 57: Frequency Domain Windowing
Optical Backscatter Reflectometer 4600 47 User Guide To perform extended range spot-scan measurements Perform the first four steps of the single Spot Scan measurement (see “To perform a single spot-scan measurement” on page 45). Select Options > Distance Range > Extended (A check mark in the menu indicates that Extended Range is On or Enabled). -
Page 58: Distributed Sensing Measurements
48 Chapter 4 Performing Measurements Figure 4-7. Amplitude of a flat end face reflector. The Blue trace shows the data without the Frequency Domain Window applied. The White trace shows that applying the Frequency Domain Window makes the peak details more evident. Distributed Sensing Measurements If the user purchases this option, s/he can measure five distributed sensing parameters: spectral shift, spectral shift quality, temperature change, strain, and... -
Page 59: Temperature Change And Strain Coefficients
Optical Backscatter Reflectometer 4600 49 User Guide When calculating Sensing curves, the Sensing Range used must begin in a region of zero temperature or strain difference between the reference and measurement files. This is necessary to align the measurement files for spectral and temporal correlations. - Page 60 50 Chapter 4 Performing Measurements opened, it shows the default coefficients. These coefficients will be used whenever a new scan is taken. The coefficients for each individual trace may be viewed or modified by using the Trace pull-down menu. A trace may have different coefficients from the default values.
-
Page 61: Distributed Sensing Technique
Optical Backscatter Reflectometer 4600 51 User Guide is not necessary to recalculate, as the coefficient values do not affect other curve types. Distributed Sensing Technique Turn Options > Sensing Enabled on, as indicated by a check mark by that menu item. -
Page 62: Gauge Length
52 Chapter 4 Performing Measurements Area is the only segment that will appear in the lower graph. The user may change the width of the highlighted area (and lower graph X-axis) by entering a new Sensing Range in the Data Processing area. Make sure that the Sensing Area begins in a region of zero temperature or strain difference between the Reference and measurement files. - Page 63 Optical Backscatter Reflectometer 4600 53 User Guide temperature or strain gradient, reducing the Gauge Length to a lower value may produce a more stable result. The Spatial Resolution filter (in the Data Processing area) does not apply to distributed sensing measurements.
-
Page 64: Distributed Sensing Examples
54 Chapter 4 Performing Measurements Distributed Sensing Examples Figure 4-9. Control panel settings for a spectral shift measurement. Note that the Shift Reference is loaded (as indicated by the blue Details button for Trace E) but not displayed (the Active Traces check box is unchecked for Trace E). The temporal or spectral shifts are calculated for the area defined by the upper graph vertical cursor location and the Sensing Range setting in the Data Processing area. - Page 65 Optical Backscatter Reflectometer 4600 55 User Guide sum of these two spectra is then calculated to generate a polarization-independent spectrum associated with each fiber segment. An example of a small spectral shift for the data displayed in Figure 4-9 is shown in Figure 4-10 below.
- Page 66 56 Chapter 4 Performing Measurements Figure 4-11. Results of the cross correlation calculation for a section of the FUT in Figure 4-9, which shows roughly -0.8 fs Temporal Shift between perturbed and the Shift Reference, Trace E Trace A Figure 4-12. The reflection Amplitude for the same temporal range as in Figure 4- 11 for Trace A (blue) is shifted by roughly -0.8 fs to the left of the Shift Reference, Trace E (purple).
- Page 67 Optical Backscatter Reflectometer 4600 57 User Guide Figure 4-13. Spectral Shift result for a constant strain applied to a 32 mm length of fiber. Figure 4-14. Calculated Spectral Shift Quality result for the same source data and same length range as in Figure 4-9.
- Page 68 58 Chapter 4 Performing Measurements Figure 4-15. Temporal shift results for the same source data and same length range as in Figure 4-13.
-
Page 69: Data Processing And Display
Chapter 5 Data Processing and Display Once a measurement has been performed, the OBR control software provides many tools for manipulating and displaying measured data. Data stored in the local memory of the software can be used to display any of the parameters described under “Standard Parameter Calculations”... -
Page 70: Displaying Stored Data
60 Chapter 5 Data Processing and Display Figure 5-1. The Display Options area in the main OBR software window. In the example, data has been loaded into Traces A and B, but only Trace A is being displayed, as indicated by the check boxes. Displaying Stored Data The control software can display any combination of Traces A through E simultaneously in the graph windows if the OBR is on and connected. -
Page 71: Trace Details
Optical Backscatter Reflectometer 4600 61 User Guide When data is loaded into local memory (by selecting File > Load Data File or by scanning) or moved within local memory (by clicking an Operations button), it is automatically displayed in the upper graph window. -
Page 72: Saving And Loading Data Files
Furthermore, a spreadsheet file can always be generated from a binary file at a later date, but a binary file cannot be generated from a spreadsheet file. Finally, other data analysis software packages available from Luna Technologies accept only the binary data format produced by the OBR control software. - Page 73 Optical Backscatter Reflectometer 4600 63 User Guide Your_Filename_Upper.txt is a spreadsheet file of all of the upper graph parameters selected in the File > Select File Options dialog box. Your_Filename_Lower.txt is a spreadsheet file of all of the lower graph parameters selected in the File >...
- Page 74 64 Chapter 5 Data Processing and Display To specify options for saving data Select File > Select File Options The Select File Options dialog box shown below opens. Figure 5-3. Select Data File Options dialog box. WIth the setting shown, the full binary file and the lower graph spreadsheet file for two parameters will be saved.
-
Page 75: Loading Saved Data
Optical Backscatter Reflectometer 4600 65 User Guide To set the software to save spreadsheet text files whenever File > Save Data Files is selected, check the appropriate box(es) under Spreadsheet File Options. Important Spreadsheet files, of type “.txt,” cannot be reloaded into the OBR software. -
Page 76: Spreadsheet File Data
66 Chapter 5 Data Processing and Display Spreadsheet File Data The header of a spreadsheet file gives the following information: • Date and time data was acquired • Reference date and time • Device descriptor (The user may enter a descriptor after clicking the Details button in the Data Management area.) •... -
Page 77: Manipulating Plots
Optical Backscatter Reflectometer 4600 67 User Guide Figure 5-4. The lower graph area can display two parameters at a time if Options > Lower Graph > Two Plots is enabled (checked). Manipulating Plots The OBR control software gives the user great control over the content and appearance of the data plots. -
Page 78: Parameter Selection
68 Chapter 5 Data Processing and Display If Options > Cursors > Show Integration Area is on (checked), the regions of the graph around the vertical cursors are highlighted. This highlighted segment is the only data that will appear in the lower graph. Lower graphs of all traces will be based on this same segment of the X-axis. -
Page 79: Scaling Plot Axes
Optical Backscatter Reflectometer 4600 69 User Guide To change the content of a graph window Click on the Title Bar of the graph. A drop-down list of the available plot parameters appears. Figure 5-5. Upper graph window showing the Title Bar pulled down for parameter selection. -
Page 80: Manual Scaling
70 Chapter 5 Data Processing and Display At other times, the user may rescale each plot axis independently by using the autoscale buttons for the X-axis and the Y-axis , located in the lower left corner of each graph window. Manual scaling The plot axes may be scaled manually by double-clicking on either the lowest or highest value labeled on the axis and typing in a new value. - Page 81 Optical Backscatter Reflectometer 4600 71 User Guide The X-axis zoom tool: This tool allows the user to zoom in on a region of the X-axis only, without adjusting the Y-axis scale. This is the default tool active in each graph when the software is opened.
-
Page 82: Using Cursors, Legends And Other Buttons
72 Chapter 5 Data Processing and Display To use this tool, first select it from the zoom menu button. Then click once to zoom out once; or click, hold and release to zoom out several times at the cursor location. Using Cursors, Legends and Other Buttons Cursors The OBR software offers three types of cursors. - Page 83 Optical Backscatter Reflectometer 4600 73 User Guide Vertical cursors: Clicking this button toggles two vertical cursors on or off. Note that when these cursors are on, the data points integrated to calculate return loss and differential loss are highlighted in contrasting colors, and the results are displayed in the upper right legend.
-
Page 84: Legend
74 Chapter 5 Data Processing and Display Spot Scan Cursor: Clicking this button turns on the spot scan cursor. Select the cross-hair tool to move the spot scan cursor to a region of the data where you desire a spot scan. See “Spot Scan Mode” on page 44 for more details. Spot Scan Cursor Unlocked or Locked Toggle Button:... -
Page 85: Adjusting Group Index
Optical Backscatter Reflectometer 4600 75 User Guide Adjusting Group Index When the upper graph X-axis displays length, the Group Index field shown below appears in the lower right corner. The user may enter the index appropriate for the device under test. -
Page 86: Adjusting Spatial Resolution
76 Chapter 5 Data Processing and Display Figure 5-9. The Specify Decimation Level dialog box allows the user to set the number of data points displayed. Decimation makes the graphs much less “noisy” and quicker to display. Note that files saved in the binary (.obr) format contain the raw data, undecimated. Text files (.txt) may be reduced in size by selecting a smaller number of points to display before saving. -
Page 87: Lightpath Analysis Software Guide
LightPath Analysis Tutorial This tutorial walks the user through adjusting the default Parameter Configuration File and creating a Reference Trace using Luna Technology sample files. Later sections describe how to create these files from your own devices, and how to use these standards to pass or fail test data. - Page 88 LightPath Analysis Software Guide If your system did not come with the LightPath Analysis software preinstalled, contact Luna Innovations Incorporated for installation files and instructions. Make sure there is no other software running, including the OBR software. Start the software from the Windows ®...
-
Page 89: Adjusting A Parameter Configuration File
Optical Backscatter Reflectometer 4600 79 User Guide Figure 6-1. LightPath Analysis software main screen. Adjusting a Parameter Configuration File From the main menu, select Setup > File Configuration. The Specify File Paths window appears, as shown in Figure 6-2, allowing the user to set the Reference... -
Page 90: Loading A File
(C:\Documents and Settings\All Users\Application Data\Luna Technologies\LightPath Analysis v#.#). The Compare to Reference Trace option is unchecked by default, (meaning the data will be compared to the Parameter Configuration File), and no Reference Trace Folder is specified. -
Page 91: Data Display
User Guide Select File > Load Data File from the menu; browse and open the file device1.obr, located in C:\Documents and Settings\All Users\Application Data\Luna Technologies\LightPath Analysis v#.#. The software will display a Processing dialog while generating the LightPath data. This may take several seconds. -
Page 92: Changing Data Processing Parameters And Tolerances
82 Chapter 6 LightPath Analysis Software Guide going from the input level to the return loss. Drops are depicted with a vertical line going from a floor of -115 dB to the input level. The color of each feature indicates whether it passed or failed, compared to the values in the Reference Trace or Parameter Configuration File. - Page 93 Optical Backscatter Reflectometer 4600 83 User Guide Figure 6-4. In the Parameter Specifications window, the user can adjust the parameters and general tolerances used by the Parameter Configuration File or the Reference Trace to separate and to pass or fail features.
-
Page 94: Why A Feature Failed
84 Chapter 6 LightPath Analysis Software Guide file is loaded, or if the software is closed, the unsaved values will be lost. This may be useful for some situations (such as this tutorial, or to briefly view the affect of a change), but has the risk of losing tolerance or processing parameter values. -
Page 95: Editing General Tolerances
Optical Backscatter Reflectometer 4600 85 User Guide software is using a Parameter Configuration File for comparisons, there is no data in the Reference Trace Event Listing grid. (Once a Reference Trace is specified, this grid will contain data, as shown in Figure 6-10 on page 92.) The Trace File Folder area shows the location of the trace being evaluated, in this case the currently loaded data held in a temporary directory. -
Page 96: Saving Lightpath Files
86 Chapter 6 LightPath Analysis Software Guide (RL) Peak Tolerance (dB) value from -65 to -50. This will allow the peaks in Features 4 and 8 to pass. You may click Apply to see that these peaks are now shown in green, for passing. Then return to the Parameter Specifications window by selecting Setup >... -
Page 97: Changing From A Configuration File To A Reference File
Optical Backscatter Reflectometer 4600 87 User Guide Changing from a Configuration File to a Reference File Now that we have made changes to the tolerances in a data file, we can save that file as the new Reference. Select Setup > File Configuration from the main menu to view the Specify File Paths window (Figure 6-2). -
Page 98: Editing Feature-Specific Tolerances
88 Chapter 6 LightPath Analysis Software Guide Click OK to accept the new configuration. The current trace will be reprocessed. No changes will be seen at this time, however, because the trace is being compared to itself. Editing Feature-Specific Tolerances The main advantage of using a Reference Trace instead of General Tolerance values is that each individual feature can have its own tolerance range. - Page 99 Optical Backscatter Reflectometer 4600 89 User Guide at the lower right, along with the tolerated minima and maxima. Note that the upper of the three regions is blank for fiber sections, which have a Return Loss of zero. The Min and Max values to the sides of the Targets represent the range of values that will be considered passing for this particular feature.
- Page 100 90 Chapter 6 LightPath Analysis Software Guide The minimum and maximum values should be set so that all segments of the Reference Trace pass, and with a wide enough range so that all segments of any good trace would be expected to pass. The pull-down menu in the Tolerance Specification window graph (Figure 6-8) can be used to change the display.
-
Page 101: Comparing A New Trace To The Reference
Reference Trace. Select File > Load Data File from the menu; browse and open the file device2.obr, located in C:\Documents and Settings\All Users\Application Data\Luna Technologies\LightPath Analysis v#.#. The new trace should be similar to the first, but may differ slightly. If you set the Loss tolerances as directed above, all the features should be marked as passing. - Page 102 Chapter 6 LightPath Analysis Software Guide Figure 6-10. The Trace Comparison window, with the graph pull-down menu set to High Resolution Data. The Reference data shows in blue, and the loaded trace shows in red. Select several different features using either the Event Listing grids or the vertical cursors with the cross-hair tool.
-
Page 103: Comparing A Failing Trace To The Reference
Optical Backscatter Reflectometer 4600 93 User Guide Comparing a Failing Trace to the Reference Load the file device3.obr (File > Load Data File). This file is similar to device1.obr but shows an extra peak around 0.54 meters. Press the Compare button to view the Trace Comparison window. -
Page 104: Editing A Reference Trace: Processing Parameters And General Tolerances
Chapter 6 LightPath Analysis Software Guide Press the Close button to exit the Trace Comparison window. Note that the loaded trace is still device3.obr, and the lower graph data is not reprocessed. Press the Save LightPath Files button to save the LightPath data for device3.obr. Enter device3 as the descriptor for new data folder, and press OK. -
Page 105: Setting The Maximum Device Length
Optical Backscatter Reflectometer 4600 95 User Guide The Reference Trace Processing Parameters should be changed only to correct a situation in which good devices are failing because of mismatched features caused by random but acceptable variations between devices. Ideally, many devices should be tested before a... -
Page 106: Resetting The Default Parameters
Reference or Parameter Configuration File. Select the file lpa_default_params.ini located in the folder C:\Documents and Settings\All Users\Application Data\Luna Technologies\LightPath Analysis v#.#. In the Peak Processing Parameters section, change the Feature Extract Length from 0.05 back to 0.1. In the General Tolerances section, change the (RL) Peak Tolerance value from -50 to -65, and change the (IL) Splice Loss Tolerance value from 0.6 to 0.1. -
Page 107: Suggested Setup And Use
Optical Backscatter Reflectometer 4600 97 User Guide Suggested Setup and Use As already discussed, the LightPath Analysis software is designed to compare devices to an ideal Reference Trace for quality control purposes. Ideally, the Reference Trace and all test scans for a given device or component should be stored in the same base folder, with the Reference Trace in a “golden”... -
Page 108: Characteristic Length (M)
Chapter 6 LightPath Analysis Software Guide Characteristic Length (m) A window is passed across a raw data set to find the “rolling median” of that data. The width of the window is defined as a number of points corresponding to the Characteristic Length specified by the user. -
Page 109: Drop Length (M)
Optical Backscatter Reflectometer 4600 99 User Guide Drop Length (m) The Drop Length is similar to the Characteristic Length discussed above, in that it is the length of a window used to calculate a rolling median of the data set. -
Page 110: Feature Extract Length (M)
Chapter 6 LightPath Analysis Software Guide Feature Extract Length (m) Once a Peak or other feature is detected by the software, a segment of data is extracted around that location for further processing. The length of this segment is specified by the Feature Extract Length parameter specified by the user. Primarily, this parameter is used for processing of Peak features that are found in the data set. -
Page 111: Peak Detect Ratio (Lin)
Optical Backscatter Reflectometer 4600 101 User Guide Peak Detect Ratio (lin) The Peak Detect Ratio is the ratio of the raw data value to the calculated median value that denotes a peak at that location. This ratio is calculated at each data point. -
Page 112: Peak Dead Zone (M)
102 Chapter 6 LightPath Analysis Software Guide Peak Dead Zone (m) The Peak Dead Zone is the length within the scatter data set in which the software will not look for another Peak while processing an extracted segment around a Peak. Default Value: 0.005 meters Closely Related To:... -
Page 113: Drop Detect Ratio (Lin)
Optical Backscatter Reflectometer 4600 103 User Guide Drop Detect Ratio (lin) The Drop Detect Ratio is the ratio between the raw scatter data and the median value. The ratio between these two values is calculated at all data points and a drop is detected when the calculated value is greater than this criteria. -
Page 114: Integration Length (M)
104 Chapter 6 LightPath Analysis Software Guide Integration Length (m) The Integration Length parameter is the length of the data set over which the integrated power is calculated for the purpose of detecting the location of splice losses in the data. It is also the length used when performing the same calculations to find the insertion loss across all artifacts that were determined to be Peaks. -
Page 115: Return Loss Type
Optical Backscatter Reflectometer 4600 105 User Guide Return Loss Type The software can use two methods to calculate Return Loss: • Measured Return Loss: The actual power reflected from an event as detected by the OBR. If Insertion Loss has occurred before a Return Loss, the power reflected from that event is reduced. -
Page 116: Peak Tolerance (Db)
106 Chapter 6 LightPath Analysis Software Guide Peak Tolerance (dB) The Peak Tolerance value is equivalent to the Maximum Return Loss allowed by all artifacts in the data set. If the return loss of any artifact surpasses this tolerance, it will be shown to fail. Default Value: -65 dB Closely Related To:... -
Page 117: Drop Tolerance (Db)
Optical Backscatter Reflectometer 4600 107 User Guide Drop Tolerance (dB) The Drop Tolerance is equivalent to the Maximum Return Loss that is allowable for any Drop detected in the scatter data. The return loss of a Drop is calculated by integrating the power of an area centered around the feature that has a length equivalent to the Feature Extract Length. -
Page 118: Loss Tolerance (Db)
108 Chapter 6 LightPath Analysis Software Guide Loss Tolerance (dB) The Loss Tolerance is the maximum allowable insertion loss across any interface in the data set. Default Value: 2.0 dB Closely Related To: Splice Loss Tolerance, Integration Length... -
Page 119: Splice Loss Tolerance (Db)
Optical Backscatter Reflectometer 4600 109 User Guide Splice Loss Tolerance (dB) The Splice Loss Tolerance is the maximum allowable insertion loss for splices found in a data set. Default Value: 0.2 dB Closely Related To: Loss Tolerance, Integration Length... -
Page 120: Location Tolerance (M)
110 Chapter 6 LightPath Analysis Software Guide Location Tolerance (m) The Location Tolerance is the maximum distance a feature may be from its expected location (based on the Reference or golden trace location) and still be considered passing. Default Value: 0.1 m... -
Page 121: Maximum Length (M)
Optical Backscatter Reflectometer 4600 111 User Guide Maximum Length (m) Features after the Maximum Length will not be displayed, when this item is checked in the Parameter Specifications window (Figure 6-4 on page 83) or the Tolerance Specification window (Figure 6-8 on page 88). Only the last Peak or Drop before this length will be displayed. -
Page 122: Remote Commands Unique To Lpa
112 Chapter 6 LightPath Analysis Software Guide Remote Commands Unique to LPA FETCh:NUMberofFeatures? Usage: FETC:NUMF? Description: Queries the number of features present in the current LightPath trace. Response: Returns a number indicating the number of features in the trace. Returns an error message if no trace data has been loaded. - Page 123 Optical Backscatter Reflectometer 4600 113 User Guide FETCh:PASSed? Usage: FETC:PASS? Description: Queries whether the current LightPath trace has passed. That is, is all of the features have passed. Response: Returns a 1 if all features have passed, or 0 if one of more features have failed.
- Page 124 114 Chapter 6 LightPath Analysis Software Guide Use reference: 1 Use general tolerances: 0 Base folder: C:\LPA_Data The response shows the current reference trace directory and the default parameter filename. The “Use Reference:1” response indicates that the reference trace is being used (instead of the default parameters file).
- Page 125 Optical Backscatter Reflectometer 4600 115 User Guide Response: None Example: CONF:CFG C:\LPA_Data\myref, C:\LPA\myparams.ini, 1, 0, C:\LPA_Data Sets the reference trace to “C:\LPA Data\myref” and the default parameter file to “C:\LPA\myparams.ini”. Specifies that the reference trace should be use, and that the feature specific tolerances should be used.
- Page 126 116 Chapter 6 LightPath Analysis Software Guide CONFigure:REFerencetrace Usage: CONF:REF {refDir} Description: Sets the current LightPath reference trace, and sets the LightPath software to evaluate traces using the reference trace rather than the default parameter file. If the refDir parameter is not a fully qualified path, it is assumed to be subdirectory in the Base Folder—the directory where LightPath data files are saved.
- Page 127 Optical Backscatter Reflectometer 4600 117 User Guide If the base folder is “C:\LPA_Data”, then the files are saved to “C:\LPA_Data\ device2”.
- Page 128 118 Chapter 6 LightPath Analysis Software Guide...
-
Page 129: Controlling The Obr Remotely
Chapter 7 Controlling the OBR Remotely This chapter provides information about controlling the Optical Backscatter Reflectometer remotely, using GPIB or TCP/IP commands. This section assumes that the user already has some familiarity with either GPIB or TCP/IP. For detailed information about GPIB, see IEEE 488.2 standards documents; for information about TCP/IP, see the IEEE 802 standards documents. -
Page 130: Remote Control Setup Configuration
120 Chapter 7 Controlling the OBR Remotely address of 0. Be aware of the IP address of the OBR PC in order to use TCP/IP remote control. - Page 131 GPIB) with LabVIEW source code. Shortcuts for these should appear in the Start menu under Start, All Programs, Luna Technologies, OBR. The LabVIEW source code for both is included in the folder C:\Program Files\Luna Technologies\OBR\Remote Control Example Code. This folder also includes example C++ code to remotely connect to the OBR.
- Page 132 122 Chapter 7 Controlling the OBR Remotely the OBR control software. The commands are organized by function. For an alphabetical listing of each command, see Table 7-1, “Alphabetical Summary of GPIB and TCP/IP Commands,” on page 163. Each of the commands listed below may be used for either GPIB or TCP/IP interface. The OBR control software accepts all mandatory IEEE 488.2 commands for GPIB,...
-
Page 133: Standard Commands
Optical Backscatter Reflectometer 4600 121 User Guide but only responds to the commands described in this section. The OBR does not accept TCP/IP commands that are not listed in this document. Important The OBR control software does not support multiple commands on a line, separated by semicolons. - Page 134 122 Chapter 7 Controlling the OBR Remotely *CLS Usage: *CLS Description: Clears the status register. Response: None. *ESE Usage: *ESE {n} Description: Sets the value (0–255) of the Status Enable register. Response: None. *ESE? Usage: *ESE? Description: Retrieves the current value (0–255) of the Status Enable register.
- Page 135 Optical Backscatter Reflectometer 4600 123 User Guide *OPC? Usage: *OPC? Description: Queries the OBR to determine if the operation is complete. Response: Returns "1" if the previous operation has been completed; "0" if the previous operation is still processing. *RST...
-
Page 136: System Level Commands
124 Chapter 7 Controlling the OBR Remotely *TST? Usage: *TST? Description: Performs a self-test query. Response: None. System Level Commands SCAN Usage: SCAN Description: Tells the OBR to execute an optical Scan based on the configured system parameters. Depending on the wavelength range (CONF:RANG) setting and Scan Rate (CONF:RATE), this command may take up to several minutes to complete. - Page 137 Optical Backscatter Reflectometer 4600 125 User Guide SYSTem:ON? Usage: SYST:ON? Description: Queries whether the OBR is on. Response: Returns "1" if the system is on, "0" if it is off. SYSTem:WARM? Usage: SYST:WARM? Description: Queries if the laser is at operating temperature.
- Page 138 126 Chapter 7 Controlling the OBR Remotely SYSTem:LASEr? Usage: SYST:LASE? Description: Queries the laser state. Response: Returns “1” if the laser is on, or “0” if the laser is off. SYSTem:ReaDY? Usage: SYST:RDY? Description: Queries if the OBR is ready to Scan. Response: Returns “1”...
- Page 139 Optical Backscatter Reflectometer 4600 127 User Guide After a successful alignment, the system will automatically perform calibration. Poll for *OPC? to determine when this operation has completed. SYSTem:ALIGn? Usage: SYST:ALIG? Description: Queries the OBR if the optics are aligned. Response: Returns “1”...
- Page 140 Sets the name of the calibration file. If the filename is not specified, this command sets calibration file to the default filename, obrCal_refl. Because this command is used for other Luna systems, the user must specify zero (0) with this command for a reflection calibration.
- Page 141 Usage: SYST:CALF? 0 Description: Retrieves the name of the calibration file. Because this command is used for other Luna systems, the user must specify zero (0) with this command to retrieve the calibration filename. Response: Returns the name of the calibration file currently in use.
- Page 142 130 Chapter 7 Controlling the OBR Remotely letter: A, B, C, D or E. If no trace is specified, the specified file will be loaded into Trace A. SYSTem:SAVE Usage: SYST:SAVE {“filename.obr”, trace} Description: Saves the specified trace data as a binary file using the specified filename.
- Page 143 Optical Backscatter Reflectometer 4600 131 User Guide name must be in quotes, with the file type “.txt” inside the quotes as well. If no trace is specified, Trace A will be saved. Domain can be set to 0 for time domain, or 1 for frequency domain.
-
Page 144: Configuration Commands
132 Chapter 7 Controlling the OBR Remotely Response: Returns “1” if data is loaded into the specified trace, “0” if data is not loaded into that trace. SYST:LAST? Usage: SYST:LAST? Description: Queries the last remote command or query processed by the device. - Page 145 Optical Backscatter Reflectometer 4600 133 User Guide CONFigure:STARt Usage: CONF:STAR {startWavelength} Description: Sets the start wavelength for the scan in nanometers. The wavelength parameter must be within the operating range of the instrument. If the start wavelength falls outside the limits of the...
- Page 146 134 Chapter 7 Controlling the OBR Remotely power of two, so the actual value of the Scan Range will be set to the valid value closest to scanRange. Response: None. Notes: If the center wavelength and scan range settings for a measurement fall outside the most recent calibration, the wavelength settings will be coerced to fit within the most recent calibration.
- Page 147 Optical Backscatter Reflectometer 4600 135 User Guide match the new Integration Width (or Sensing Range) and the Integration (or Sensing) start set using the CONF:INTS command. CONFigure:INTegrationWidth? Usage: CONF:INTW? Description: Retrieves the OBR Integration Width in the units set by CONF:XUNI (page 139).
- Page 148 136 Chapter 7 Controlling the OBR Remotely (1) range (page 28). Response: None. CONFigure:DistanceRANge? Usage: CONF:DRAN? Description: Retrieves the OBR Distance Range (page 28). Response: Returns the Distance Range, either zero (0) in the Normal Range or one (1) in the Extended Range. CONFigure:DeviceUnderTestLength Usage: CONF:DUTL {length}...
- Page 149 Optical Backscatter Reflectometer 4600 137 User Guide CONFigure:DeviceUnderTestLength? Usage: CONF:DUTL? Description: Queries the current DUT length (in meters) for Extended Range mode. Response: Returns the current DUT length in meters. CONFigure:SensingRANge Usage: CONF:SRAN {sensingRange} Description: In optional Sensing mode (page 48), sets the OBR Sensing Range in the units set by CONF:XUNI (page 139).
- Page 150 138 Chapter 7 Controlling the OBR Remotely Description: Sets the OBR Integration Area start in the units set by CONF:XUNI (page 139). [In Sensing mode, this sets the Sensing Area start, also in the units set by CONF:XUNI.] Response: None. Note: Setting the Integration (or Sensing) start will cause the Integration (or Sensing) center to be adjusted to match the...
- Page 151 Optical Backscatter Reflectometer 4600 139 User Guide Note: Turning sensing mode on disables rolloff corrections. It does not change the laser sweep speed or disable the frequency window filter, both of which are done when entering Sensing Mode in the OBR GUI. These actions can be performed separately by using the CONF:RATE and CONF:FWIN commands.
- Page 152 140 Chapter 7 Controlling the OBR Remotely Description: Sets the gauge length in cm. This is the new name for CONF:SRES {sensingResolution}. The CONF:SRES command is still supported, but may be discontinued in the future. Response: None Examples: CONF:GLEN 1.5 Sets the gauge length to 1.5 cm.
- Page 153 Optical Backscatter Reflectometer 4600 141 User Guide CONFigure:SensingRESolution and CONF:SRES? Note: Being replaced by the command CONF:GLEN and CONF:SSPA (above). CONFigure:XaxisUNIts Usage: CONF:XUNI {units} Description: Sets the X-axis units being used to specify the Integration (or Sensing) Area. These are the units that will be used by...
-
Page 154: Data Capture And Retrieval Commands
140 Chapter 7 Controlling the OBR Remotely Response: Returns a number indicating the x-axis units used to define the Integration (or Sensing) Area. The possible responses are: 0 : nanoseconds 1 : meters 2 : feet 3 : inches 4 : millimeters Example: CONF:XUNI? Response: 1... - Page 155 Optical Backscatter Reflectometer 4600 141 User Guide Description: Queries the laser sweep rate. Response: Returns the current laser sweep rate in nm/sec. Example: CONF:RATE? This query returns the laser sweep rate in nm/sec. CONFigure:GRouP Usage: CONF:GRP {groupIndex} Description: Sets the OBR Group Index.
- Page 156 142 Chapter 7 Controlling the OBR Remotely Description: Sets the Spatial Resolution Filter width (ns). Response: None. CONFigure:SpatialResolutionFilterWidth? Usage: CONF:SRFW? Description: Retrieves the Spatial Resolution Filter width in nanoseconds. Response: Returns the Spatial Resolution Filter width in nanoseconds. CONFigure:GAIN Usage: CONF:GAIN {gain} Description: Sets the gain vector index.
- Page 157 Optical Backscatter Reflectometer 4600 143 User Guide measurements. A value of 0 (do not apply window) or 1 (apply window) must be specified as a parameter. Response: None Example: CONF:FWIN 1 This command causes the frequency domain filter to be applied to all new measurement scans.
- Page 158 144 Chapter 7 Controlling the OBR Remotely a trace (“A” through “E”) or the word (“DEFAULT”) must be specified as a parameter. Response: Returns the coefficients defined for the specified trace, or the default coefficients that will be used for new measurements.
- Page 159 Optical Backscatter Reflectometer 4600 145 User Guide graphType Graph/Parameter Name Time Domain (domain = 0) Values Amplitude Linear Amplitude Polarization States Phase Derivative Amplitude (dB) Spectral Shift (only on some units) Temporal Shift (only on some units) Strain (only on some units)
- Page 160 146 Chapter 7 Controlling the OBR Remotely This query should be called before performing the FETC:MEAS? command if the controller program needs to pre-allocate space for the data. Example: FETC:FSIZ? A, 0, 0, 1 This command returns the data array size of Trace A’s time domain amplitude data, with data decimation on.
- Page 161 Optical Backscatter Reflectometer 4600 147 User Guide xUnits for the frequency domain can be set to 0 for wavelength (nm), 1 for frequency (GHz), or 2 for frequency (THz). Response: Returns the curve name or title on the first line, Y-axis label on the second line, and the X-axis label on the third line.
- Page 162 148 Chapter 7 Controlling the OBR Remotely commands. If the Integration Width (or Sensing Range) is set to 0, then the Y-axis data is returned for the entire measurement area. This query is usually preceded by the FETC:FSIZ? query to determine the number of data points that will be returned. All parameters must be specified.
- Page 163 Optical Backscatter Reflectometer 4600 149 User Guide Units for the time domain can be set to 0 for time (ns), 1 for length (m), 2 for length (ft), 3 for length (in), or 4 for length (mm). Units for the frequency domain can be set to 0 for wavelength (nm), 1 for frequency (GHz), or 2 for frequency (THz).
- Page 164 150 Chapter 7 Controlling the OBR Remotely Description: Queries the OBR for current measurement Details for trace specified. The trace is specified as a single letter: A, B, C, D or E. Response: Returns a string of information (shown below) about the specified (A-E) or default (A) trace.
- Page 165 Optical Backscatter Reflectometer 4600 151 User Guide sending the FETC:RSIZ? request with the same trace parameter. The values for each point are formatted as: {S real <tab> S imaginary <tab> P real <tab> P imaginary} The string "///" is returned after the last data point to indicate that the response is complete.
- Page 166 152 Chapter 7 Controlling the OBR Remotely GraphType can take values from 0 to 4, as shown in the table beginning on page 145. Only the frequency domain values of graphType are used in this command. Decimate can be set to 1 to use decimation, or 0 to return all points.
- Page 167 Optical Backscatter Reflectometer 4600 153 User Guide Response: Returns the ending wavelength, in nanometers, for the specified trace. If no trace is specified, the ending wavelength for Trace A is returned. If a successful scan has not been made before this query, the OBR responds with “Trace A (B, etc.) contains no data.”...
- Page 168 154 Chapter 7 Controlling the OBR Remotely Response: Returns the start time in nanoseconds for the specified trace. If no trace is specified, the start time for Trace A is returned. If a successful scan has not been made before this query, the OBR responds with “Trace A (B, etc.) contains no data.”...
- Page 169 Optical Backscatter Reflectometer 4600 155 User Guide Alphabetical Command Summaries The table below provides summaries of GPIB and TCP/IP commands, listed alphabetically by command. For detailed information about each command, see “Remote Control Commands for the OBR” above, beginning on page 120. All commands are given in their truncated form, and are case-sensitive.
- Page 170 156 Chapter 7 Controlling the OBR Remotely Table 7-1: Alphabetical Summary of GPIB and TCP/IP Commands *SRE? Queries the current value of the Service Request Enable register. *STB? Queries the value of the Status Byte register. *TST? Performs a self-test query. *WAI Prevents the OBR from executing any further commands or queries until all pending operations have been completed.
- Page 171 Optical Backscatter Reflectometer 4600 157 User Guide Table 7-1: Alphabetical Summary of GPIB and TCP/IP Commands CONF:GRP Sets the OBR Group Index. Retrieves the OBR Group Index. CONF:GRP? CONF:INTC Sets the OBR integration center in the units set by CONF:XUNI (page 139).
- Page 172 158 Chapter 7 Controlling the OBR Remotely Table 7-1: Alphabetical Summary of GPIB and TCP/IP Commands CONF:SRBW? Retrieves the spatial Resolution Bandwidth in millimeters. Sets the Spatial Resolution Filter width (ns). CONF:SRFW Retrieves the Spatial Resolution Filter width in CONF:SRFW? nanoseconds.
-
Page 173: Alphabetical Command Summaries
Optical Backscatter Reflectometer 4600 159 User Guide Table 7-1: Alphabetical Summary of GPIB and TCP/IP Commands FETC:FSIZ? {trace, Retrieves the size of the data array for the specified variables: domain, graphType, Trace can be A, B, C, D or E. - Page 174 160 Chapter 7 Controlling the OBR Remotely Table 7-1: Alphabetical Summary of GPIB and TCP/IP Commands FETC:GSTR? Retrieves the graph title or name, the Y-axis label, and the X- {domain, axis label for the specified domain, graphType, and xUnits. graphType, xUnits} Domain = 0 for the time domain, 1 for frequency domain.
- Page 175 Optical Backscatter Reflectometer 4600 161 User Guide Table 7-1: Alphabetical Summary of GPIB and TCP/IP Commands FETC:MDET? Queries the OBR for current measurement Details for the {trace} trace specified (A-E). FETC:MEAS? Retrieves the Y-axis data for the specified parameters. (For {trace, domain, variable definitions, see “FETC:FSIZ? above.)
- Page 176 170 Chapter 7 Controlling the OBR Remotely Table 7-1: Alphabetical Summary of GPIB and TCP/IP Commands SCAN Tells the OBR to execute an optical Scan based on the configured system parameters. SYST:ACQ? Queries whether data has been acquired (1) or not (0). SYST:ALIG Aligns the optics SYST:ALIG?
- Page 177 Optical Backscatter Reflectometer 4600 171 User Guide Table 7-1: Alphabetical Summary of GPIB and TCP/IP Commands SYST:RLDC Reloads the most recent valid calibration file into memory. SYST:SAT? Queries whether the detectors were saturated during the previous scan. SYST:SAVE Saves the specified trace (A-E) data as a binary file using the {“filename.obr”,...
- Page 178 172 Chapter 7 Controlling the OBR Remotely Table 7-1: Alphabetical Summary of GPIB and TCP/IP Commands SYST:SSEG Saves as a binary file the segment of the trace defined by the Integration (or Sensing) Area. {“filename”, trace} SYST:VER? Queries the software version. SYST:WARM? Queries if the laser is at operating temperature (1) or not (0).
-
Page 179: Measurement Theory
Chapter 8 Measurement Theory The Luna OBR utilizes swept-wavelength interferometry to interrogate the device or system under test. This technique measures the full scalar response, including both phase and amplitude information. The amplitude of the time domain data is equivalent to a traditional optical time domain reflectometry (OTDR) measurement. -
Page 180: Optical Network For Obr
Optical Network for OBR A schematic of Luna’s OBR optical network is shown in Figure 8-2. The optical system is comprised of a tunable laser source (TLS), an interferometer (the DUT... - Page 181 The Luna OBR is designed such that the internal delay path through the device under test is long enough such that the low frequency terms will not influence the measurement, even for very short devices.
- Page 182 176 Chapter 8 Measurement Theory segment that contains the device information. Because the initial data was acquired ω as a function of optical frequency, , the transformed data is a function of time. For this reason, the transformed data is referred to as time domain data. Figure 8-3.
-
Page 183: Fiber Optic Interferometry
Optical Backscatter Reflectometer 4600 177 User Guide Once the data has been transformed back into the frequency-domain, the calibrated amplitude response yields the loss of the test device. The derivative of the phase response yields the group delay. Fiber Interferometry: References B. -
Page 184: Spatial Resolution Calculations
178 Chapter 8 Measurement Theory 1 ---- RBW [GHz] = -- ∆t λ --------- RBW [pm] = c∆t λ where is the center scan wavelength and c is the speed of light in a vacuum. Spatial Resolution Calculations The Spatial Resolution field in the Data Processing area sets the length of the box- car filter applied to the amplitude data in the time domain. -
Page 185: Standard Parameter Calculations
Optical Backscatter Reflectometer 4600 179 User Guide t ∈ [ 0, T ] domain axis is given by and the data is highlighted at a cursor such that t ∈ [ t , then the average return loss at that cursor is given by ∑... - Page 186 180 Chapter 8 Measurement Theory Time Domain Amplitude and Amplitude (dB) Using the equation above for the linear transfer function, H( ω ), the impulse response is given by the Fourier transform of the transfer function, h ˜ = FFT{ H( ω ) } FFT{ H( ω...
- Page 187 Optical Backscatter Reflectometer 4600 181 User Guide Time Domain Linear Amplitude h ˜ The linear amplitude is the plotted on a linear scale. Figure 8-5. Time domain Linear Amplitude data for a switch. Time Domain Polarization States The OBR detects the power returned in two orthogonal polarization states. The power in these two states can be summed to form the total power returned from a particular location in the fiber.
- Page 188 182 Chapter 8 Measurement Theory Time Domain Phase Derivative The time domain phase derivative plot is the derivative of the phase of the impulse response with respect to time. Note that the time derivative of phase is the definition of optical frequency, so this derivative can be scaled as a wavelength. For a device with a distributed impulse response, the time domain phase derivative shows the wavelength distribution as a function of time for an infinitely short pulse as it is dispersed by the device.
- Page 189 Optical Backscatter Reflectometer 4600 183 User Guide Frequency Domain Return Loss Return loss is the ratio of optical power output by the device to the optical power input to the device, and is expressed in dB. In terms of the transfer function, it is defined as ⁄...
-
Page 190: Time Domain Amplitude And Amplitude (Db)
184 Chapter 8 Measurement Theory arg ( z ) ∆ω where denotes the argument (phase) of the complex number , and i + 1 the change in optical frequency from index i to index Figure 8-9. Group Delay data for a patch cord. Frequency Domain Window Some OBR users have noted that the reflectance peaks from strong reflection events (generally with higher than -45 dB return loss) exhibit marked broadening at the... - Page 191 Optical Backscatter Reflectometer 4600 185 User Guide Fiber End Face Fiber End Face Plastic End Cap Surfaces Plastic End Cap Surfaces Normal Trace Normal Trace With Spectral With Spectral Window Applied Window Applied Figure 8-10. OBR traces of a FC/PC connector with a clear plastic cap over the ferrule with (white) and without (blue) a Frequency Domain Window applied.
- Page 192 186 Chapter 8 Measurement Theory ST:ST ST:ST Normal Trace Normal Trace FC/APC: FC/APC: FC/APC: FC/APC: FC/APC FC/APC FC/APC: FC/APC: FC/APC FC/APC FC/APC FC/APC With Spectral Window Applied With Spectral Window Applied Figure 8-11. OBR traces of a series of short patch cables with (white) and without (blue) a Frequency Domain Window function applied.
- Page 193 Optical Backscatter Reflectometer 4600 187 User Guide uniform, the frequency window function will not significantly alter the measured Rayleigh scatter amplitude. Distributed Sensing Distributed strain and temperature measurements are made by sensing the spectral shift in the fiber Rayleigh scatter. Since the higher and lower parts of the scanned spectrum are attenuated by the frequency domain filter, the effective measurable temperature and strain range is cut roughly in half.
- Page 194 188 Chapter 8 Measurement Theory Measurement Technique A strain or temperature sensor is formed by first measuring and storing the Rayleigh scatter signature of the fiber under test (FUT) at an ambient state; this data is stored as the Shift Reference. Then the scatter profile is measured at a later time with strain or heat applied at some point along the length of the fiber.
- Page 195 Optical Backscatter Reflectometer 4600 189 User Guide telecom fibers are common; larger variations may be observed in specialty fiber, such as polarization maintaining (PM) fiber or Erbium-doped fiber. Figure 8-12. Spectral Shift result for a constant strain applied to a 320 mm length of fiber.
- Page 196 190 Chapter 8 Measurement Theory Temperature Change and Strain Coefficients The temperature change and strain curves are generated by converting the spectral shift curve from values in GHz to degrees C or microstrain. This conversion is done using a 4 order polynomial fit.
- Page 197 Optical Backscatter Reflectometer 4600 191 User Guide ( ν – ∆ν where U is the reference spectrum for a given segment of data, is the measurement spectrum under a strain or temperature change, and the symbol used to denote the cross-correlation operator. In other words, the Spectral Shift Quality is the maximum value of the cross correlation of the Reference and measurement spectra normalized by the maximum expected value, i.e.
- Page 198 192 Chapter 8 Measurement Theory Figure 8-13. Temporal Shift results for the same source data and same length range as in Figure 8-12. Number of Points and Resolution The spatial resolution of the Spectral Shift, Spectral Shift Quality, Temperature Change, Strain and Temporal Shift measurements is determined by the Sensor Spacing and Gauge Length settings in the Data Processing area of the main software window.
- Page 199 Optical Backscatter Reflectometer 4600 193 User Guide B. J. Soller, M. Wolfe, M. E. Froggatt, “Polarization resolved measurement of Rayleigh backscatter in fiber-optic components,” paper NWD3, OFC Technical Digest, Los Angeles, March, 2005. M. Froggatt and J. Moore, “High resolution strain measurement in optical fiber with Rayleigh scatter,”...
- Page 200 194 Chapter 8 Measurement Theory...
- Page 201 Chapter 9 Maintenance Cleaning Connectors It is extremely important to clean connectors before attaching optical fibers to the OBR for testing. Failure to do so may result in erroneous or noisy data. Optical fiber connectors on devices should be cleaned before every connection to the OBR.
- Page 202 196 Chapter 9 Maintenance These supplies can be ordered from: FIS Incorporated 161 Clear Road Oriskany, NY 13424 Web: www.fiberinstrumentsales.com E-mail: info@fiberinstrumentsales.com. Use only cleaners approved for use with fiber optic bulkheads and fiber connectors. Do not use any type of Important cleaning fluid, cotton swabs, or cloths.
- Page 203 Optical Backscatter Reflectometer 4600 197 User Guide The cleaner tape has two cleaning strips: cleaning strips Holding the fiber connector perpendicular to the cleaner tape surface, swipe the tip of the connector down the first cleaning strip, then swipe on the second strip.
- Page 204 198 Chapter 9 Maintenance Turn the protective cap counterclockwise to remove it. Gently insert one of the supplied mini swabs, as shown below. Twist the swab in one direction, and then remove. Discard miniswabs after single use. Figure 9-1. Remove the protective cap. Gently insert supplied mini swab, rotate in one direction, then remove.
- Page 205 Optical Backscatter Reflectometer 4600 199 User Guide fuse drawer power module Warning To avoid the risk of serious injury or death, ensure that the power cord is disconnected from the instrument when checking or replacing fuses. To replace fuses Disconnect the instrument power cord.
- Page 206 Packing and Shipping the OBR The OBR should only be packed and shipped in its original packing materials. If these have been discarded, contact Luna Technologies for packing material. To minimize physical shock during shipping, the OBR system should always be shipped via air instead of ground, by a reputable shipping service provider.
- Page 207 Place the OBR Accessory Box on top of the OBR. Seal the top of the box, taping the center and open edges. Obtain a Luna Desktop or Laptop PC Shipping Box (#2), as applicable. Seal the bottom center and edges of the box.
- Page 208 202 Chapter 9 Maintenance...
- Page 209 If you have problems or error messages not listed here, or if the solutions provided here do not resolve a problem, please contact Luna Technologies toll free at 1-866- LUNAOVA (1-866-586-2682) or by e-mail at support@lunatechnologies.com.
- Page 210 (not just the instrument) needs to be recalibrated. First, run the Self-Diagnostic software and send the resulting text file to Luna (as described beginning on page 211). Then you may contact Luna Technologies toll free at 866-LUNAOVA (866-586-2682) or by e-mail at support@lunatechnologies.com.
- Page 211 Ready light still does not come on, run the Self- Diagnostic software and send the resulting text file to Luna (as described beginning on page 211). Then you may contact Luna Technologies toll free at 866- LUNAOVA (866-586-2682) or by e-mail at support@lunatechnologies.com.
- Page 212 Manger button, then select the OBR software, and click End Task.] Turn the instrument off and then back on again. Restart the OBR control software. Multiple Luna Technologies Ensure that you are only running one control software software applications may be program at a time.
- Page 213 Optical Backscatter Reflectometer 4600 207 User Guide OBR will not scan Cause(s) Solution(s) Laser not on or ready. If the laser is not on, turn it on. Then re-scan after the Laser Ready light comes on. If the laser is on but the ready light is not lit, the laser is still warming up.
- Page 214 Shorten the leads or replace the DUT to comply with the length limit of the OBR. See “Specifications” on page 213 for the length limits. Cracks in bulkhead connector Contact Luna Technologies at 1-866-LUNAOVA or alignment sleeve. support@lunatechnologies.com for service. No data after scan...
- Page 215 If the above solutions do not work, run the Self- Diagnostic software and send the resulting text file to Luna (as described beginning on page 211). Then you may contact Luna Technologies toll free at 866- LUNAOVA (866-586-2682) or by e-mail at...
- Page 216 Self-Diagnostic software and send the resulting text problem in the hardware or file to Luna (as described beginning on page 211). Then software. you may contact Luna Technologies toll free at 866- LUNAOVA (866-586-2682) or by e-mail at...
- Page 217 In those cases, the error message will be displayed during one scan and the subsequent scans will be performed without any error. If any error occurs consistently, please contact Luna Technologies toll free at 866-LUNAOVA (866-586-2682) or by e-mail at support@lunatechnologies.com...
- Page 218 You may view the results and then click the red Exit button. As instructed in the above window, send the resulting text file (c:\selfdiag:txt) as an attachment to support@lunatechnologies.com. Luna’s support staff will examine the file and contact you.
- Page 219 Appendix A Specifications Parameter Specification Units Electrical Input Voltage Range 100-250 Input Frequency Range 50-60 Operating Power Optical Output Maximum Rated Output Power Internal Laser Module Maximum Rated 10.0 Output Power Emitted Wavelengths 1260-1340 or 1520-1630 PC I/O • CD drive •...
- Page 220 (Laptop resolution setting must be > 1280 x 1024) Class 1 Laser Product The Luna Technologies OBR 4600 is a Class 1 Laser Product, which meets the requirements of Class 1 in standards IEC 60825-1: 2001 and 2007, and complies with 21CFR1040.10.
- Page 221 Index align optics 31 – remote commands 126 amplitude 68 remote commands 145 apply frequency domain window 29 apply spatial resolution filter 29 – assembling the OBR 7 asterisk 105 autoscale plot axes 29 auto-update lower graph 29 backscatter 187 base folder for output files 80 binary files 62 Bragg grating 187...
- Page 222 Index supplies 195 *CLS 122 color palette 30 compare 84 compare to reference trace 80 – components list 7 CONFigure:CenterWaveLength 132 CONFigure:CenterWaveLength? 132 CONFigure:COEFficients 143 CONFigure:COEFficients? 144 – CONFigure:ConfFiGuration 114 – CONFigure:ConfFiGuration? 113 CONFigure:DeviceUnderTestLength 136 CONFigure:DeviceUnderTestLength? 136 CONFigure:DistanceRANge 135 CONFigure:END? 133 CONFigure:FrequencydomainWINdow 143 CONFigure:FrequencydomainWINdow? 143 CONFigure:GAIN 142...
- Page 223 Optical Backscatter Reflectometer 4600 217 User Guide CONFigure:SensingRANge? 137 CONFigure:SensingRESolution 139 – CONFigure:SensorSPAciing 138 CONFigure:SensorSPAcing 166 CONFigure:SpatialResolutionBandWidth 141 CONFigure:SpatialResolutionBandWidth? 141 CONFigure:SpatialresolutionFILter 142 CONFigure:SpatialresolutionFILter? 142 CONFigure:SpatialResolutionFilterWidth 142 CONFigure:SpatialResolutionFilterWidth? 142 CONFigure:STARt 133 CONFigure:STARt? 133 CONFigure:XaxisUNIts 139 – CONFigure:XaxisUNIts? 139 connectors attaching to bulkhead 38 –...
- Page 224 Index spreadsheet 64 data decimation 29 Data Processing area 21 decimation 29 remote commands 146 – – details 60 remote commands 169 detectors saturated 204 – differential loss 26 display options 29 – Display Options area 22 disposal 2 distance range 28 remote commands 135 –...
- Page 225 Optical Backscatter Reflectometer 4600 219 User Guide remote commands 140 fast scanning 30 FBG (fiber Bragg grating) 187 feature extract length 100 feature highlight graph 85 feature tolerance detail 85 – FETCh:FEATures 112 FETCh:FREQuency? 144 FETCh:FrequencydomainDETail? 152 FETCh:FSIZe? 145 FETCh:GeneralTOLerances? 113...
- Page 226 Index – remote commands 131 frequency domain window 29 measurement details 47 – theory 184 fuses replacing 198 – FUT (fiber under test) 190 gain 20 – remote commands 142 gauge length 52 controls spatial resolution of distributed sensing 53 GD.
- Page 227 Optical Backscatter Reflectometer 4600 221 User Guide image file 27 impulse response 180 insertion loss 4 sign convention 85 instrument configuration 28 – integrated loss 26 integration area – remote commands 137 integration length 104 integration width 18 and differential loss 178...
- Page 228 Index logging options 30 loss – differential 26 – integrated 26 return 4 sign convention 85 loss tolerance 108 lower graph two plots 66 – updating 67 Mach-Zehnder interferometer 173 magnitude difference 182 main window 18 maximum length 111 maximum length –...
- Page 229 Optical Backscatter Reflectometer 4600 223 User Guide parameter specifications 83 parameters 2 changing in LPA software 82 menu 23 – plotting 23 – plotting two at a time 66 – – remote commands 123 spreadsheet 64 peak (LPA feature) 81...
- Page 230 Index reduce gain 204 reference acquire 16 reference trace 80 82 reload calibration data 31 remote commands 128 remote control commands 119 – – alphabetical listing 163 case sensitive 162 delay required 163 – GPIB 119 quotes in 161 semicolons in 163 setup 120 spaces in 161 TCP/IP 119...
- Page 231 Optical Backscatter Reflectometer 4600 225 User Guide scan range 42 remote commands 132 scanning button 20 – continuous mode 20 failed 207 indicator light 33 modes 4 new scans to Matrix A 59 range 20 remote commands 124 – single 41...
- Page 232 Index software installation 12 software recovery 10 spaces in commands 161 spatial resolution 4 – filter 21 maximum 36 of distributed sensing data 53 – remote commands 130 spatial resolution filter 142 specifications 214 specify calibration file 31 – – spectral shift 3 –...
- Page 233 Optical Backscatter Reflectometer 4600 227 User Guide SYSTem:COPY 131 SYSTem:ERRor? 126 SYSTem:ERRorDescription? 126 SYSTem:GET? 131 SYSTem:LASEr 125 SYSTem:LASEr? 126 SYSTem:LAST? 132 SYSTem:LOAD 129 SYSTem:ON? 125 SYSTem:ReaDY? 126 SYSTem:ReLoaDCalibration 128 SYSTem:SAVE 130 – SYSTem:SaVeLightPathtrace 116 SYSTem:SaveSEGment 130 SYSTem:SAVText 130 – SYSTem:SPOTscan 124...
- Page 234 Index troubleshooting 203 *TST? 124 – tutorial for LightPath analysis 77 – two plots 66 units frequency 144 remote commands 149 resolution bandwidth 28 spreadsheet file 66 time domain 177 X-axis 24 Y-axis 24 upper graph 23 USB 33 LED indicator on front panel 33 *WAI 123 wavelength 41 center 20...
- Page 235 Optical Backscatter Reflectometer 4600 229 User Guide scaling 24 units 24 zooming 71 zooming 25 –...
- Page 236 Index...
Need help?
Do you have a question about the 4600 and is the answer not in the manual?
Questions and answers