Agilent Technologies E4438C Manual
Signal studio for bluetooth esg vector signal generator
Hide thumbs
Also See for E4438C:
- Programming manual (208 pages) ,
- Datasheet (40 pages) ,
- User's & service manual (26 pages)
Table of Contents
Advertisement
Quick Links
Use Signal Studio
to Create Bluetooth
Test Signals
Signal Studio for Bluetooth software is
a powerful tool for creating Bluetooth
baseband I/Q waveforms for use with the
Agilent E4438C ESG vector signal generator.
Select from thirteen different packet types
to configure, download and store the wave-
forms in the ESG, and use the ESG flexible
waveform sequencer to generate custom
packet sequences.
Agilent
Signal Studio for Bluetooth
E4438C ESG Vector Signal Generator
Option 406
Application Note 1421
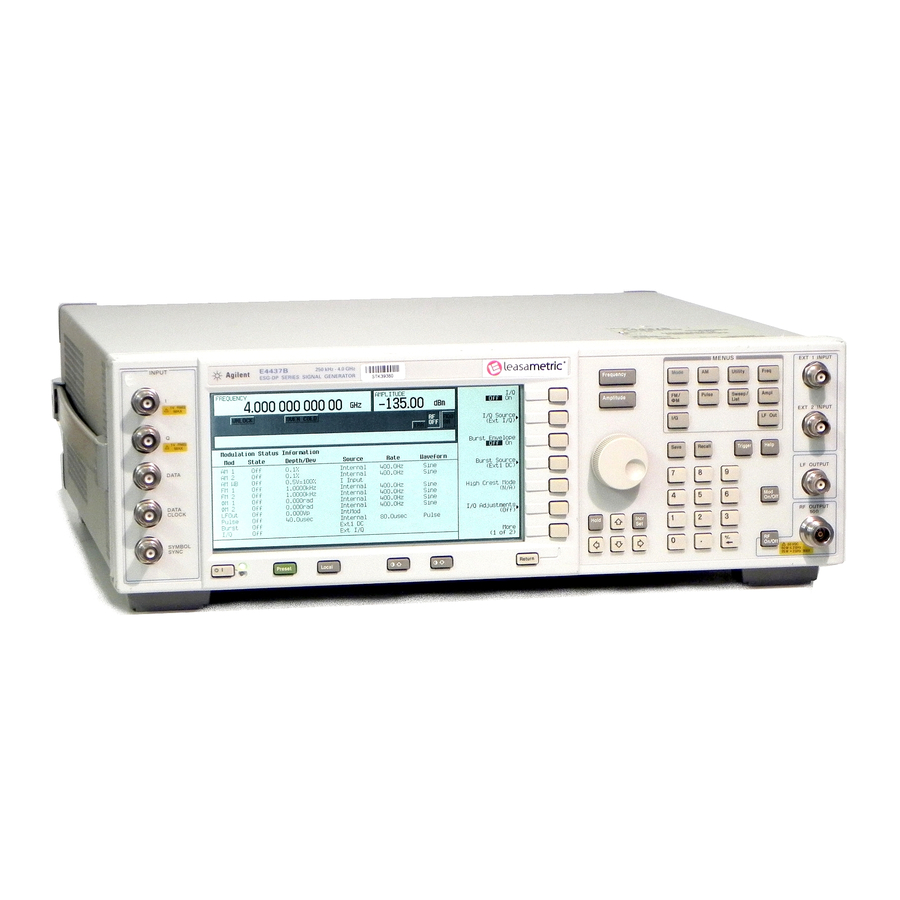
E4438C ESG vector signal
generator main features
• 250 kHz to 1, 2, 3, 4, or 6 GHz
frequency range
• Up to 64 megasamples (MSa)
waveform playback memory
• Up to 6 GB non-volatile waveform
storage
• Single-ended and differential
I/Q outputs
• LAN and GPIB connectivity
™
Signal Studio for Bluetooth
main features:
• Intuitive user interface
• Fully coded Bluetooth packets and
Bluetooth modulated data streams
• Packet types: DH1, DH3, DH5, DM1,
DM3, DM5, AUX1, HV1, HV2, HV3, NULL,
POLL, ID
• Standards-based dirty transmitter
setup for receiver sensitivity tests
• Custom impairments: sinusoidal & linear
frequency drift, frequency offset, symbol
timing error, modulation index, AWGN
• Simplifies BER testing
• Plot BER vs. clock/gate delay
• Plot the I/Q signals and spectrum of the
configured baseband waveform
Advertisement
Table of Contents

Related Manuals for Agilent Technologies E4438C


Summary of Contents for Agilent Technologies E4438C
- Page 1 DM3, DM5, AUX1, HV1, HV2, HV3, NULL, baseband I/Q waveforms for use with the • Up to 6 GB non-volatile waveform Agilent E4438C ESG vector signal generator. POLL, ID storage • Standards-based dirty transmitter Select from thirteen different packet types •...
-
Page 2: Table Of Contents
Table of Contents This application note is a self-guided tutorial describing the test signals that can be created with the Signal Studio for Bluetooth software. This document is not meant to be a Bluetooth technology tutorial. Basic knowledge of the Bluetooth radio specification is required. -
Page 3: Ease Of Use
Ease of Use Signal Studio simplifies creating Bluetooth test signals for use with ESG. Rather than spending valuable time coding Bluetooth packets at the bit level, use the software to create fully coded, standard-based Bluetooth packets and Bluetooth modulated data streams. Intuitive user interface Signals can be rapidly configured in an easy-to-use graphical software environment. -
Page 4: Signal Structure
Signal Structure This section provides a quick review of key Bluetooth signal characteristics. Additional information about the Bluetooth signal structure can be found in the Bluetooth System Specification. Bluetooth modulation and transmission parameters Modulation parameters Modulation type FSK – frequency shift keying Baseband filtering Gaussian, BT = 0.5 Maximum frequency deviation... -
Page 5: Bluetooth Link Types
Signal Structure Bluetooth link types Two types of links can be established between Bluetooth devices: Asynchronous Connection-Less (ACL) link The ACL link is a point-to-multipoint link between the master and all slaves participating on the piconet. It is considered a packet-switched connection primarily intended for transmitting non-time sensitive information, like data. -
Page 6: Connecting To The Esg
Bluetooth test signals. Before attempting to download waveforms to the instrument, verify that the host PC is communicating with the ESG. For additional information on connecting to the signal generator, refer to the E4438C Signal Studio Installation Guide, available on the website: www.agilent.com/find/signalstudio. - Page 7 Creating Signals Data stream mode When operating in data stream mode, a waveform comprised of a continuous non-bursted stream of data can be configured. This type of waveform is typically used as an inter- ference signal or a basic test signal that doesn’t require decoding to perform BER analysis.
- Page 8 Creating Signals User file format Both modes of operation, Data Stream and Packet Generator, allow users to select User File as the Data Pattern. This data must be in binary form. The most significant bit (MSB) of the first byte in the user data file will be the first bit of the user payload. The MSB of the second byte in the user file will be the ninth bit of the user payload, ®...
- Page 9 Creating Signals To configure a packet, first set the Link Type pull-down menu to ACL or SCO, Figure 6. Then select the desired packet in the packet type pull-down menu. A different set of packets is available to choose from in the packet type pull-down menu depending on which link type is selected, see Table 1.
- Page 10 Creating Signals Payload summary Access Header Payload Packet Header User data code field field field (bytes) (bytes) • • • 0 to 27 • • • 0 to 183 • • • 0 to 339 • • • 0 to 17 •...
- Page 11 Creating Signals Figure 8. Example multi packet sequence setup. The data type selected in the data pattern pull-down menu is spread over the payload portion of the packet sequence, Figure 9. The length of the data stream can be defined by either setting the number of bits in the length field or the number of times the pattern is repeated in repetitions field.
- Page 12 Creating Signals Figure 10. Payload Setup for a multi packet sequence with continuous PN9 user data. Payload summary section Full packets – Number of packets with payload filled to capacity. Partial packets – Because the payload portion of each packet is filled to capacity if possible, the number of partial packets appended to the end of a packet sequence will always be 0 or 1.
- Page 13 Calculating a long multiple packet sequence If a PN15, Continuous PN15, or a User File is chosen as the data pattern, a calculation warning will appear. See Figure 11. The amount of time it takes your PC to calculate the signal depends on the PC’s amount of RAM and the speed of the processor. As the amount of samples shown in the Projected Length field increases, so does the amount of time it takes the PC to calculate the signal.
- Page 14 Creating Signals Figure 13. Bursted transmission timing relationships for different packet types. At the beginning and end of a packet transmission, the ESG ramps power following a user-defined burst profile. The burst profile is defined by setting the Power Ramp and Ramp Settling fields with the desired time duration (in microseconds).
-
Page 15: Step 2 Set Up The Signal Generation Parameters
When modifying the burst profile, keep in mind that as the rise/fall time of the bursted Creating Signals signal is decreased, the amount of spectral splatter is increased due to bursting. When bursting is disabled, the ESG transmits concatenated packets with no power ramping. - Page 16 Propagation delay = a RF test signal E4438C ESG vector signal generator • Option 602 Baseband generator with 64 MSa • Option 406 Signal Studio for Bluetooth • Option UN7 Internal BER analyzer Figure 18. To perform BER analysis using this measurement setup, the clock/gate delay setting (∆) must be equal to the propagation delay the test signal experiences through the Bluetooth...
- Page 17 Creating Signals Clock/gate delay calibration If the delay parameter is unknown, leave the default value (0 µs) in the clock/gate delay field and finish configuring the waveform. After the waveform has been calculated, the clock/gate delay calibration utility can be used to determine the delay characteristics of the device under test.
- Page 18 Creating Signals The incremental delay step at which BER tests are performed is set in the step size field. The resolution of this field is also directly coupled to the oversampling ratio setting as described previously. The Repeat field is used to set the number of BER test iterations for each clock/gate delay increment.
- Page 19 Creating Signals Max BER Marker Average BER Min BER Figure 23. Plot of BER vs. Clock/Gate Delay with repetitions field set to three. The statistics displayed in the box in figure 23 are the current marker value and not for the entire plot.
- Page 20 Signal impairments Creating Signals The Signal Studio software provides a straightforward graphical menu for adding impairments to the Bluetooth signal. Custom- and standards-based dirty transmitter impairments can be added to the Bluetooth signal. See Figure 24. Figure 24. Add either custom- or standards-based dirty transmitter impairments. In general, the impairments are derived from the frequency and modulation tolerances specified for Bluetooth transmitters.
- Page 21 The Bluetooth dirty transmitter test signal is used to verify the demodulation capabilities Creating Signals of the receiver. The ESG and Signal Studio for Bluetooth software’s dirty transmitter test capability provides a versatile solution for receiver development and Bluetooth module verification.
- Page 22 Creating Signals Symbol timing error This impairment varies the symbol rate of the Bluetooth signal. Adding this impairment adjusts the standard one Msymbol/second rate by the set amount. Carrier frequency drift This impairment adds a dynamic error to the transmission frequency. It is used to simu- late a Bluetooth device’s carrier frequency varying during the transmission of a packet.
- Page 23 Packet types Creating Signals The three different packet types that can be chosen for the dirty transmitter test are DH1, DH3, and DH5. The payload for all packet types is a PN9 data sequence. The PN9 data sequence is truncated after the maximum amount of PN9 data has been placed in the packet.
- Page 24 Creating Signals Use with an external frame sync Selecting the Use External Frame Sync field, see Figure 29, sets up the waveform to trigger from an externally-supplied signal that is applied to the pattern trigger In connector on the ESG’s rear panel. The waveform sequence will trigger after it detects a change in TTL state from low to high at the Pattern Trigger In connector.
- Page 25 Creating Signals Three different waveforms are shown in Figure 30, and each waveform has the same value for the burst ramp. The burst ramp, tr, includes the power ramp and power settling times. The sync to packet delay, td, is different for each of the waveforms: •...
- Page 26 The ESG includes several different triggering types and sources. For more details on the different trigger types and sources available, and how to set up, please refer to the E4438C ESG Vector Signal Generator User’s Guide. Event marker setup The Signal Studio software makes use of the ESG markers to generate various signals out the Event 1 and 2 ports on the back of the rear panel of the ESG.
- Page 27 Make sure the power settins are the same for both the main Bluetooth menu and the Dirty Transmitter menu. For more details about the power search feature, please refer to the E4438C ESG Vector Signal Generator’s User’s Guide.
- Page 28 Creating Signals Other features The features that are not explained in the impairments section are explained elsewhere in the other sections of this product note. Please refer to the following sections for details regarding the following features: Configure the Bluetooth signal section •...
- Page 29 Creating Signals Linear drift The two different carrier frequency drift types that are available in the menu are sine and linear. When linear drift is selected, the carrier frequency deviates from the center carrier frequency in a positive or negative linear direction, depending on the drift deviation set- ting.
-
Page 30: Step 3 Configure The Esg
Creating Signals Step 3 Configure the ESG Figure 34. ESG Configuration menu. In addition to the configured Bluetooth waveform, the Signal Studio software passes instrument settings to the ESG. These are defined in the ESG Configuration menu, boxed in Figure 34. Basic settings There are three fundamental ESG settings that must be defined prior to downloading the waveform to the instrument. - Page 31 Typically, these parameters should not be modified unless there is a specific reason to do so. A brief description is provided below and additional information on these parameters can be found in the E4438C ESG Vector Signal Generator User’s Guide. Figure 35. E4438C Advanced Settings menu.
-
Page 32: Step 4 Calculate And Download
Creating Signals External BBG reference The ESG baseband generator uses an internal reference clock as its time base. Alternatively, an external reference clock can be used as the time base by selecting External BBG reference. If an external reference is used, it should be connected to the ESG prior to downloading waveform and instrument settings. - Page 33 Creating Signals Figure 37. Spectrum plot of the Bluetooth I/Q waveform. Downloading waveforms Select the Download button, Figure 36, to send the calculated I/Q waveform file and the signal generator settings to the instrument. The signal generator automatically begins producing the Bluetooth modulated RF signal. Local control of the instrument is then re-enabled and signal generator settings can be modified from the instrument’s front panel.
- Page 34 From the menu keys at the top of the window in Figure 36, choose File>Save As, and then name the file and save it in the Agilent\Signal Studio\E4438C\Bt directory. The software configuration can be recalled anytime by choosing the following menu options: File>Open, then the file name.
-
Page 35: Basic Measurements
BER analysis capabilities. LAN or GPIB RF test signal E4438C ESG vector signal generator • Option 503 250 kHz to 3 GHz frequency range • Option 602 Baseband generator with 64 MSa • Option 406 Signal Studio for Bluetooth •... -
Page 36: Ber Measurements Setup
Bluetooth radio Control receiver section RF out E4438C ESG vector signal generator • Option 503 250 kHz to 3 GHz frequency range • Option 602 Baseband generator with 64 MSa • Option 406 Signal Studio for Bluetooth • Option UN7 Internal BER analyzer Figure 40. - Page 37 Event 1 Rear panel clock in gate in E4438C ESG vector signal generator • Option 503 250 kHz to 3 GHz frequency range • Option 602 Baseband generator with 64 MSa • Option 406 Signal Studio for Bluetooth • Option UN7 Internal BER analyzer...
-
Page 38: Ber Measurements Example - Clock/Gate Delay Calibration
LAN or GPIB RF in RF out E4438C ESG vector signal generator ESA-A Series spectrum analyzer • Option 503 250 kHz to 3 GHz frequency range • Option 304 Bluetooth measurement personality • Option 602 Baseband generator with 64 MSa •... - Page 39 Keystrokes surrounded by { } indicate soft keys located on the right side of the display. Procedure 1. Connect the test setup as shown in Figure 42 and preset the ESG. Instructions: Keystrokes: E4438C ESG vector signal generator E4438C ESG vector signal generator Preset the instrument [Preset] Set the threshold level [Aux Fctn] {BERT} {I/Q Setup} {Threshold} {0.7V}...
- Page 40 Basic Measurements 3. Use Signal Studio to configure a DH1 multi packet sequence that contains continuous PN9 data distributed over the user payload portion of the packet sequence, Figure 43. Do not add impairments to the signal when performing the initial calibration. Once configured, select the Calculate button.
- Page 41 Basic Measurements 5. Configure the automated clock/gate delay calibration utility, Figure 45. In this example, the clock/gate sweep end field is set to 10 us. Default values are used for the remaining configuration fields. Figure 45. Clock/Gate Delay calibration utility setup. 6.
-
Page 42: Signal Studio For Bluetooth Features
Basic Measurements 8. Place the marker at the desired clock/gate delay setting using the arrow buttons and select the set Delay button. Then select the OK button. The clock/gate delay setting associated with the current marker location is returned to the clock/gate delay field, Figure 47, in the Signal Generation Setup menu and the calibration utility is closed. - Page 43 Signal Studio for Bluetooth Data streams 0s, 1s, 01s, 10s, 8-bit pattern, PN9, PN15 features Packet types DH1, DH3, DH5, DM1, DM3, DM5, AUX1 HV1, HV2, HV3, DM1 Control NULL, POLL, ID Bluetooth device address Valid range: 0000 0000 0000 to FFFF FFFF FFFF Hex Active member address Valid range: 0 to 7 Payload data patterns...
-
Page 44: Acronym List
Acronym List Asynchronous Connection-Less Adjacent Channel Power Advanced Design System AM ADDR Active Member Address AWGN Additive White Gaussian Noise BD ADDR Bluetooth Device Address Bit Error Rate Bandwidth Time product CCDF Complementary Cumulative Distribution Function Cyclic Redundancy Check Digital/Analog Converter Device Under Test Decibels relative to 1 milliwatt Forward Error Correction... -
Page 45: Additional Literature
Measuring Bit Error Rate Using the ESG-D Series RF Signal Generators, Option UN7 Literature number 5966-4097E Signal Studio for Bluetooth, E4438C ESG Vector Signal Generator, Option 406 - Technical Overview Literature number 5988-5458EN Bluetooth RF Measurement Fundamentals, Application Note 1333-1 Literature number 5988-3760EN Bluetooth RF Testing –... -
Page 46: Appendix
Appendix ® An example MATLAB program to generate and save a user data file is shown below. %************************************ Userdata File Example************************ % Set some constant parameters numBytes = 16; bitsPerByte = 8; % Construct a bit stream databits = ones(1,numBytes*bitsPerByte); % Sets entire stream to 1's databits(11:2:29) = 0;... -
Page 47: Recommended Configuration
ESG. The license key can be ordered through your sales engineer or local sales office, which can be found at www.agilent.com/find/assist. Upgrade kits If you currently own an E4438C ESG vector signal generator and are interested in obtaining an upgrade kit only (license key), order: E4438CK and option E4438CK-406. www.agilent.com/find/esg... - Page 48 Agilent Technologies’ Test and Measurement Support, Services, and Assistance Agilent Technologies aims to maximize the value you receive, while minimizing your risk and problems. We strive to ensure that you get the test and measurement capabilities you paid for and obtain the support you need.