Table of Contents
Advertisement
Quick Links
SD card real time data recorder
PM2.5, %RH, Temp.,CO2,Barometer
AIR QUALITY MONITOR RECORDER
Model : PM-1064SD
Your purchase of this AIR QUALITY MONITOR with SD CARD DATA RECORDER
marks a step forward for you into the field of precision measurement. Although
this Meter is a complex and delicate instrument, its durable structure developed.
Please read the following instructions carefull yand always keep this manual
within easy reach.
OPERATION MANUAL
Advertisement
Table of Contents

Subscribe to Our Youtube Channel
Related Manuals for Lutron Electronics PM-1064SD


Summary of Contents for Lutron Electronics PM-1064SD
- Page 1 SD card real time data recorder PM2.5, %RH, Temp.,CO2,Barometer AIR QUALITY MONITOR RECORDER Model : PM-1064SD Your purchase of this AIR QUALITY MONITOR with SD CARD DATA RECORDER marks a step forward for you into the field of precision measurement. Although this Meter is a complex and delicate instrument, its durable structure developed.
-
Page 2: Table Of Contents
TABLE OF CONTENTS 1. FEATURES......................1 2. SPECIFICATIONS....................... 2-1 General Specifications....................2-2 Electrical Specifications..................... 3. FRONT PANEL DESCRIPTION................5 Measurement preparation.................... 5. Measurement procedure....................5-1.METER POWER ON...................... 5-2.PM2.5 Measurement..................5-3.Humidity and Temperature measurement..............5-4.CO2 measurement......................5-5.Barometer measurement....................5-6.Time Display......................6. OTHER FUNCTION....................6-1 Data Hold........................ -
Page 3: Features
1. FEATURES Real time recorder, save the data into the SD memory card and can be down load to the Excel, extra software is no need. User can make the further data or graphic analysis by themselves. under the Excel software. Monitoring air pollutant source from dust, petrochemical industry, steel-making plant, thermal power plant, restaurant, smoke, burning plants, driving automobiles. -
Page 4: Specifications
2. SPECIFICATIONS 2-1 General Specifications Circuit Custom one-chip of microprocessor LSI circuit. Display LCD Size: 2.18 X 2.87” (55.4 X 72.9 mm)(Dot Matrix) LCD with green backlight ( ON/OFF ). Measurement * PM2.5(Particulate matter) * Humidity * Temperature * CO2 * Barometer Over-range * LCD display show "... -
Page 5: Electrical Specifications
Sampling Time Approx. 1 second. of Display Data Output RS 232/USB PC computer interface. * Connect the optional RS232 cable UPCB-02 will get the RS232 plug. * Connect the optional USB cable USB-01 will get the USB plug. * Open collector output Alarm Output * Input impedance:330Ω... - Page 6 Humidity Humidity Range 5 % to 95 % R.H. Resolution 0.1 % R.H. ≧70% RH : Accuracy ±(3% reading + 1% RH). < 70% RH : ±3% RH. Temperature 0 ℃ to 50 ℃,32 ℉ to 122 ℉. Temperature Range Resolution 0.1 degree ℃...
-
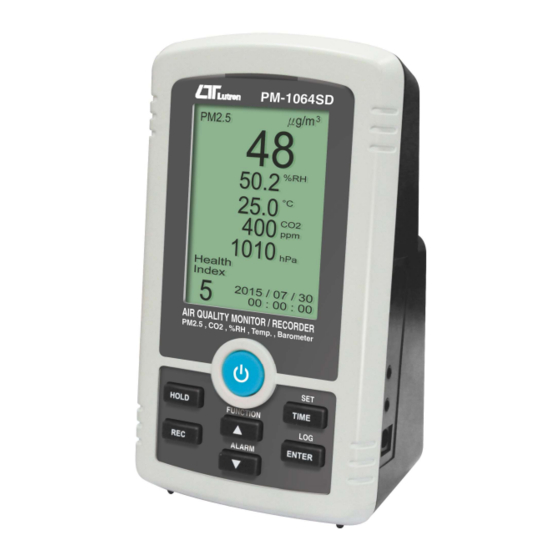
Page 7: Front Panel Description
3. FRONT PANEL DESCRIPTION Fig. 1 3-1.Display 3-9.SD card socket 3-2.Power/Backlight button 3-10.RESET button 3-3.HOLD key button 3-11.ALARM socket 3-4.REC key button 3-12.RS232 socket 3-5.TIME/SET key button 3-13.DC 9V power adapter socket 3-6.ENTER/LOG key button 3-14.PM2.5 Air sampling inlet(Air filter net) 3-7.▲/FUNCTION key button 3-15.PM2.5 Air sampling outlet 3-8.▼/ALARM key button... -
Page 8: Measurement Preparation
4. Measurement preparation 4-1.The initial boot screen 4-2.Into the measurement screen 4-3.Key outline 4-3-1.POWER/Backlight KEY(3-2,Fig.1): A.Long press this button> 2 SEC. Native ON / OFF function. B.In the boot state press the button briefly, for the LCM backlight ON / OFF function. 4-3-2.HOLD KEY(3-3,Fig.1): LCD display value lock function. - Page 9 4-3-6.▲/FUNCTION KEY(3-5,Fig.1): A.When the setting screen press the button, the value increases function. Long function. press and hold to quickly increase the value B.In measuring screen (eg SCREEN1) long press button> 2 SEC., Then switch to the TWA measurement functions (eg SCREEN4). 4-3-7.▼/ALARM KEY(3-6,Fig.1): A.When the setting screen press the button, the value was down function.
- Page 10 4-5-3.SET SP-T(Data logger sampling time setting): A. Press ▲ or ▼ key to Data logger sampling time setting, press ENTER KEY will set the value of the store and into the next function is set (SET SP-TeSET P-OFF). B.0 S: Representative Manual Logger function. C.2〜3600 S: Representative Auto Logger function.
-
Page 11: Measurement Procedure
4-5-9.SET ALARM(Alarm value setting): A.Press ▲ or ▼ KEY select the option you want to set it μg / m³、% RH、 ℃, ENTER key once to Into the the upper limit of the adjustment, press ENTER KEY again Into the the lower limit of the adjustment, press ENTER KEY again will return to the first parent directory. -
Page 12: 5-4.Co2 Measurement
5-4.CO2 measurement:(eg SCREEN1) screen will show CO2 ppm for reading. 5-5.Barometer measurement:(eg SCREEN1) screen will show hpa or mmHg or inHg for reading. 5-6.Time Display: 5-6-1.During normal measurement, the lower right corner displays only, hours, minutes and seconds. Screen.(eg SCREEN1) 5-6-2.In normal measurement, when short press TIME KEY, the lower right corner of the screen displayed first the year, month, day, hour, minute and second of about 2 SEC. -
Page 13: Alarm Function
6-4.ALARM function: 6-4-1.Upper and lower range of settings: eg 4-5-7 Option Description 6-4-2. After the range setting, press ▼ / ALARM KEY> 2 SEC. ALARM function is entered, and the top right corner of the screen will appear the words ALM. (eg SCREEN16) 6-4-3.When the measured value equivalent ≧... -
Page 14: User Calibration Function
6-5.User calibration function: 6-5-1.Press HOLD and REC KEY> 3 SEC.then Into the the user calibration function. (eg SCREEN17) 6-5-2.PM2.5 calibration: A.Low level calibration (PML): In SCREEN 17 screen, then press ENTER KEY Into the SCREEN18 adjust the picture,after this time,the low-level calibration should be less than 15μg / m³, wait 10 minutes this unit with the standard machine value is stable, press ▲... - Page 15 layer Temp calibration screen (eg SCREEN22), at this time press HOLD and REC KEY> 3 SEC. Then away from the user calibration screen and return to the measurement screen(eg SCREEN1). 6-5-5. CO2 calibration: In SCREEN24 screen, press ENTER KEY proceeds SCREEN25 adjust the picture, when the machine with a standard value of a given machine steady, press ▲...
- Page 16 SCREEN6 SCREEN7 SCREEN8 SCREEN9 SCREEN10 SCREEN12 SCREEN13 SCREEN14 SCREEN15 SCREEN11 SCREEN17 SCREEN18 SCREEN19 SCREEN20 SCREEN16 SCREEN21 SCREEN22 SCREEN23 SCREEN24 SCREEN25 SCREEN26 SCREEN27 SCREEN28 SCREEN29...
-
Page 17: Datalogger
7. DATALOGGER 7-1 Preparation before execute datalogger function a. Insert the SD card ≦ It recommend use memory card 4 GB. Prepare a " SD memory card " ( 1 GB to 32 GB ), insert the SD card into the " SD card socket " ( 3-9, Fig. 1 ). The front panel of the SD card should face against the down case. -
Page 18: Auto Datalogger ( Set Sampling Time ≧ 2 Second )
7-2 Auto Datalogger ( Set sampling time 2 second ) ≧ a. Start the datalogger Press the " Logger Button ( 3-6, Fig. 1 ) >2 second , the LCD will show the logger function (eg SCREEN12) , the display will show symble "... -
Page 19: Manual Datalogger ( Set Sampling Time = 0 Second )
7-3 Manual Datalogger ( Set sampling time = 0 second ) a. Set sampling time is to 0 second Press the " Logger Button ( 3-6, Fig. 1 ) >2 second , the display will show the text "LOGGER "(eg SCREEN14), then press the " Logger Button " ( 3-6, Fig. -
Page 20: Sd Card Data Structure
7-5 SD Card Data structure When the first time, the SD card is used into the meter, the SD card will generate a route : PAB01 If the first time to execute the Datalogger, under the route PAB01\, will generate a new file name PAB01.XLS. -
Page 21: Saving Data From The Sd Card To The Computer
8. Saving data from the SD card to the computer ( EXCEL software ) After execute the Data Logger function, take away the SD card out from the " SD card socket " ( 3-9, Fig. 1 ). Plug in the SD card into the Computer's SD card slot ( if your computer build in this installation ) or insert the SD card into the "... -
Page 23: Air Filter Net Replacement
9. Air filter net REPLACEMENT When the meter show " " information , This " symbol " meaning is please replace the meter filter, Please carry out according to the following replacement steps. Loose the screws of the " Air filter net Cover " ( 3-14, Fig. 1 ) and take away the "... -
Page 24: System Reset
12. SYSTEM RESET If the meter happen the troubles such as : CPU system is hold ( for example, the key button can not be operated... ). Then make the system RESET will fix the problem,and meter will be power oFF. The system RESET procedures will be either following method : During the power on, use a pin to press the "... - Page 25 The 16 digits data stream will be displayed in the following format : D15 D14 D13 D12 D11 D10 D9 D8 D7 D6 D5 D4 D3 D2 D1 D0 Each digit indicates the following status : Start Word When send the PM2.5 data = 1 When send the %RH data = 2 When send the Temp.
-
Page 26: Micro Suspend The Particle (Pm2.5) Parallel Table Of The Indicator And Activity Are Proposed
14. Micro suspend the particle (PM2.5) Parallel table of the indicator and activity are proposed Micro suspend the particle (PM2.5) value index index µg/m^3 General people Sensitiveness ethnicity The activity is proposed The activity is proposed 0-11 Normal outdoor sports Normal outdoor sports 12-23 24-35... -
Page 27: Patent
PSI value and health influence AIR PSI INDEX 0~50 Good To that general people are healthy have not been influenced. 51~100 Moderate Have not influenced the sensitive ethnicity immediately healthily. 101~199 Unhealthful Will have phenomenon that slight symptom worsens to the sensitive ethnicity, such as the ozone thickness is in this range, the eyes nose will have some the excitement.
Need help?
Do you have a question about the PM-1064SD and is the answer not in the manual?
Questions and answers