Advertisement
Quick Links
DATACOLOR 45 Quick Start Instructions
Thank you for purchasing a Datacolor 45 series Portable Spectrophotometer (45G CT, 45G, or 45S). This
Quick Start Guide has been provided to get you quickly familiarized with the Datacolor 45 instrument.
Please refer to the User Guide for more in-depth information.
NOTES
For more complete information, and for operation with Datacolor Tools, please refer to the Datacolor 45 User's
Guide included on the flash drive provided with the instrument, or refer to our website at www.datacolor.com.
Introduction
The Datacolor 45 Portable Spectrophotometer can be used in the following configurations:
1. Stand-Alone
The instrument can be used as a stand-alone device without any connection to the Datacolor Tools
program. In this configuration, you can calibrate the instrument and make measurements of samples to
obtain color difference information.
2. Connected to Datacolor Tools
The instrument can be connected to the Datacolor Tools program and can be used in these 2 basic
modes:
a) PC Access Mode – In this mode the instrument can send standard and batch data to
Datacolor Tools and receive standard and tolerance data from Datacolor Tools. The
instrument is used to gather data which will eventually be uploaded to the software.
b) Tethered Mode – In this mode, the Datacolor Tools program uses the instrument to
measure samples (standards or batches) directly from the software with the data
immediately available for analysis. The Datacolor Tools program controls the operation of
the instrument.
This document will provide basic information to get started with the Datacolor 45 in stand-alone mode.
A complete User Guide in PDF form is contained on the USB flash drive accompanying the Datacolor 45
instrument.
Charging the Instrument
Datacolor 45 must be fully charged before using. It takes up to 8 hours to fully charge
the unit.
Datacolor 45 Quick Start Guide – 003-400063 Rev B
1
Advertisement

Subscribe to Our Youtube Channel
Related Manuals for Datacolor 45


Summary of Contents for Datacolor 45
- Page 1 Thank you for purchasing a Datacolor 45 series Portable Spectrophotometer (45G CT, 45G, or 45S). This Quick Start Guide has been provided to get you quickly familiarized with the Datacolor 45 instrument. Please refer to the User Guide for more in-depth information. NOTES For more complete information, and for operation with Datacolor Tools, please refer to the Datacolor 45 User’s Guide included on the flash drive provided with the instrument, or refer to our website at www.datacolor.com. Introduction The Datacolor 45 Portable Spectrophotometer can be used in the following configurations: 1.
- Page 2 NOTES The instrument does NOT charge through the USB connection. You must use the AC adapter to charge the instrument. Power Switch Power Supply Connection Connect the power cord to the universal AC switching adapter. Note: Use the appropriate power cord to enable proper connection based on the geographical region. Connect the AC switching adapter to the Datacolor 45 instrument. Plug the power cord into the outlet. Datacolor 45 Quick Start Guide – 003-400063 Rev B...
-
Page 3: Stand-Alone Operation
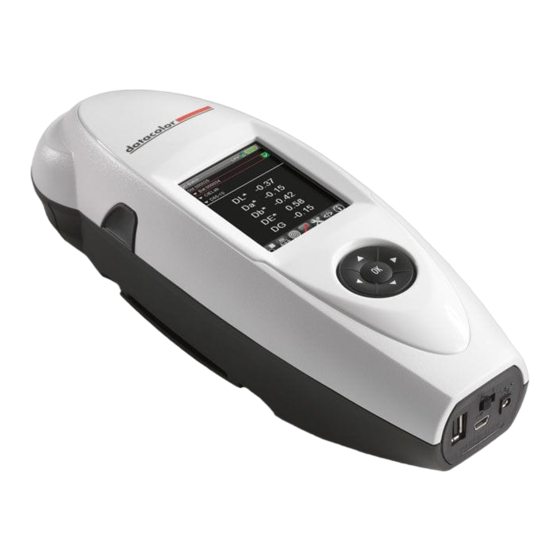
Stand Alone Operation Starting the Instrument To start the instrument, move the switch at the back of the instrument from the “0” position to the “|” position. The instrument will power up and the main QC screen will display. Navigating the Interface Navigate the software display using the navigation buttons on the instrument. Use the left/right and up/down buttons to move through the fields on the screen and the buttons on the Live Bar. Program Navigation Buttons Below is an example of an output screen: The fields in top section having down arrows are used to select standards, output displays and the Illuminant/Observer. The colorimetric data is displayed in the center of the screen. In this start-up screen, the CIEL*a*b* color coordinates and color differences are displayed The information on this display depends on whether you are in Standard mode or Batch mode. In Standard mode, you will see absolute data and in Batch mode you will see delta or difference data. At the bottom of the screen is the Live Bar. It provides access to program options and maintenance features. You can navigate the Live Bar by using the left/ right program Datacolor 45 Quick Start Guide – 003-400063 Rev B... - Page 4 The fields immediately below the top border identify the standard and batch selections, the colorimetric data displayed and the Illuminant/Observer selected. Use the up/down program navigation buttons to access these fields. Standard Name Batch Name Colorimetric Output Illuminant/Observer The columns in the center of the screen display the colorimetric data for the standard and batch: Standard Data Batch Data Differences (Deltas) NOTES The information displayed will change based on the output screen you have selected. Datacolor 45 Quick Start Guide – 003-400063 Rev B...
- Page 5 Live Bar Options A Live Bar at the bottom of the screen provides access to a variety of options in the on- board software. Live Bar Unselected Selected When an option is activated on the Live bar, it turns red. In the example on the right, the Batch Mode is active. Standard Mode and Batch Mode To simplify measurement, the instrument has 2 basic modes for measurement. These are Standard Mode and Batch Mode. Standard Mode – The target icon represents Standard Mode. When this mode is selected on the Live Bar, all measurements made are tagged as standards, and all data displayed is for a standard. Batch Mode – The dart icon represents Batch Mode. When this mode is selected on the Live Bar, all measurements made are tagged as batches, and they attached to the current standard. In this mode, standard and batch data display and color differences are included. Datacolor 45 Quick Start Guide – 003-400063 Rev B...
- Page 6 Instrument Calibration The instrument must be calibrated before taking measurements. Calibration involves measuring a black trap, and a white tile. Select the calibration option by selecting the calibration icon in the live bar. The calibration screen is displayed. The calibration indicator in the title bar is red indicating that the instrument is not calibrated. The last calibration time is shown as well as the time for the next calibration. To begin the calibration, either place the instrument on the black trap. Press the measurement button on the instrument to take the measurement. Datacolor 45 Quick Start Guide – 003-400063 Rev B...
- Page 7 After the black trap is measured, the program will ask for the white tile to be measured. To measure the white tile place the instrument on the white tile. Press the measurement button to start the measurement. If the gloss option is included (45G CT or 45G), the program will ask for the gloss tile to be measured. If the gloss option is not included (45S), this screen will not display. To measure the gloss tile, position the instrument and gloss tile on the stand. Press the measurement buttons on the instrument to take the measurement. Datacolor 45 Quick Start Guide – 003-400063 Rev B...
- Page 8 The program will notify you that the calibration is successful. The calibration icon in the Title Bar turns to green indicating that the instrument is calibrated. The last calibration date/time is the current date/time. The next calibration date/time is now shown. This is based on a calibration interval of 8 hours. Datacolor 45 Quick Start Guide – 003-400063 Rev B...
- Page 9 Measuring a Standard and a Batch To measure a new standard, select the Standard Mode icon from the Live Bar. The screen will display the data for the current standard. If this is a new instrument, the current standard will be named “Demo Standard”. The program must have a stored standard to operate, and the unit is shipped with a “demo standard”. To measure a new standard, place the instrument on the standard and press the instrument measurement button. After the measurement is taken, the program will display the absolute L*a*b* data for the new standard. By default, the new standard will be auto named, based on the current date and time. The standard naming method can be selected in the Options screen. To measure another standard, place the instrument on the standard and press the measurement button. As long as you remain in Standard mode, each measurement you make creates a new standard. If you want to measure a batch to compare to the current standard, you must select the Batch Mode icon on the Live Bar. Datacolor 45 Quick Start Guide – 003-400063 Rev B...
- Page 10 To compare a new batch to the current standard, place the instrument on the batch sample and press the measurement button. After the batch has been measured, the output screen will be displayed. This display screen includes the absolute colorimetric data for the standard and batch, and the color difference data for the samples. When the gloss feature is enabled, the gloss information is also displayed. The batch name defaults to an auto name based on the current date and time. The batch naming method can be edited in the Options screen. To measure a second batch, place the instrument on the batch sample and press the measurement button. As long as you remain in Batch Mode, each measurement you make will create a new batch. Color Coordinates • Each color coordinate is identified by a letter—e.g., L*, a*, b*, etc. • In this example, the color difference calculation being displayed is CIEL*a*b*C*h. • . STD. The values in the column are the coordinate values for the standard. • BATCH. The values in the column are the coordinates for the batch. Color Differences (deltas) • The color difference data will indicate if the difference is positive (+) or negative (-). • The exception is DE, which is always a positive number. Datacolor 45 Quick Start Guide – 003-400063 Rev B 10...
- Page 11 Datacolor 45 Quick Start Guide – 003-400063 Rev B 11...
Need help?
Do you have a question about the 45 and is the answer not in the manual?
Questions and answers