Table of Contents
Advertisement
Quick Links
Advertisement
Table of Contents
Troubleshooting

Related Manuals for Snap-On SOLUS Legend


Summary of Contents for Snap-On SOLUS Legend
- Page 1 User Manual ZEESCGB336A Rev. A Start...
- Page 2 Click a Topic Scanner Using Page Controls Vehicle Code Scan Table of Contents (TOC) Data Cable General Information OBD-II/EOBD Basic Operation & Navigation Previous Vehicles & Data Quick Reference Information Tools Maintenance ShopStream Connect™ Snap-on Cloud Wi-Fi Connection Customer Support / Training...
-
Page 3: Table Of Contents
Functional Tests ..................31 Basic Navigation .................... 6 Troubleshooter .................... 33 Home Screen Layout................6 Section 6: Vehicle Code Scan / (Snap-on Cloud) ........34 Home Screen Icons................. 7 Using Code Scan..................35 WiFi Connection ..................7 Total Number of Systems (modules) Analyzed........36 Title Bar .................... - Page 4 Snap-on Cloud Setup Information Screen..........66 Using the Snap-on Cloud................66 Quick Reference (print / download / share) .......... 66 Logging in to the Snap-on Cloud (registered user) ....... 67 Navigating the Snap-on Cloud (Toolbars) ..........68 My Files ....................68 Search ....................
-
Page 5: Safety Information
Safety Information READ ALL INSTRUCTIONS Read, understand and follow all safety messages and instructions in this manual, the accompanying Important Safety Instructions manual, and on the test For your own safety, the safety of others, and to prevent damage to the product and equipment. - Page 6 Safety Information Safety Message Conventions Safety Message Conventions Safety messages are provided to help prevent personal injury and equipment damage. Safety messages communicate the hazard, hazard avoidance and possible consequences using three different type styles: Normal type states the hazard. •...
-
Page 7: Using This Manual
Using This Manual Hyperlinks Content Selectable hyperlinks are provided throughout this manual to quickly take you to This manual contains basic operating instructions and is structured in a manner to related topics, procedures, and websites. Hyperlinks are identified by Blue colored help you become familiar with your diagnostic tool features and perform basic text. - Page 8 Using This Manual Symbols Symbols Important IMPORTANT indicates a situation which, if not avoided, may result in damage to the Different types of arrows are used. The “greater than” arrow (>) indicates an test equipment or vehicle. abbreviated set of selection (navigation) instructions. Example: Abbreviated example for the following procedure: “Select Tools >...
-
Page 9: Section 1: Quick Reference
The diagnostic tool serial number is located on the back of the diagnostic tool housing. The serial number and software version can also be viewed onscreen from The Snap-on Cloud is a mobile-friendly cloud-based application designed specifically the System Information screen (Tools > System Information) see for technicians to store, organize, share and print information. -
Page 10: Section 2: General Information
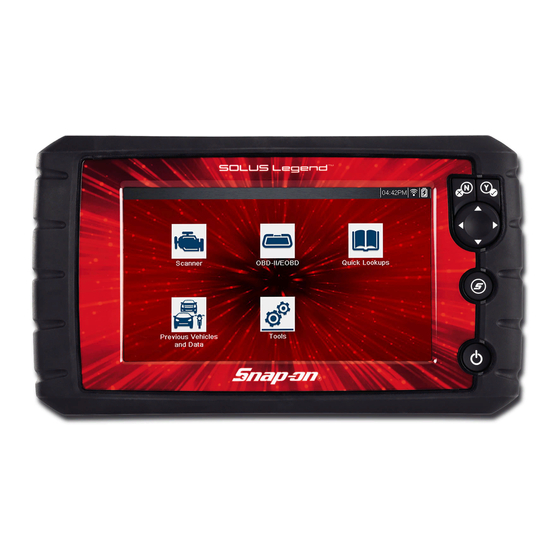
General Information Section 2 ™ The SOLUS Legend is an automotive diagnostic scan tool. Connectors and jacks for data communication cables and the AC power supply are located on the top of the diagnostic tool. This section describes basic feature locations, how the diagnostic tool is powered and basic specifications. -
Page 11: Powering The Diagnostic Tool
General Information Powering the Diagnostic Tool Powering the Diagnostic Tool Insert the end of the AC power supply cable into the diagnostic too power supply jack, then connect the AC power supply to an approved AC power source. Your diagnostic tool can receive power from any of the following sources: IMPORTANT Vehicle Power •... -
Page 12: Technical Specifications
General Information Technical Specifications Technical Specifications Item Description / Specification Touch Screen Resistive Touch Panel 8.0 inch diagonal, Color LCD Display 800 x 480 resolution SWVGA Rechargeable lithium-ion battery pack Battery Approximately 3 hour run time Approximately 5 hour charge time Power Supply Supply Rating;... -
Page 13: Section 3: Basic Operation And Navigation
Basic Operation and Navigation Section 3 3.1.2 Turning Off This section describes basic diagnostic tool operation, navigation, screen layout, icon functions, and screen messages. Before you operate the diagnostic tool, make sure the battery pack is fully charged or the diagnostic tool is powered by the AC IMPORTANT power supply. -
Page 14: Control Buttons
Basic Operation and Navigation Control Buttons Control Buttons Item Button Description Buttons move the cursor or highlight in their There are four “push type” control buttons and one “thumb pad rocker type” multi- respective direction: Directional - directional button located on the right side of the diagnostic tool. All other diagnostic Up (b) •... -
Page 15: Home Screen Icons
Basic Operation and Navigation Basic Navigation 3.3.2 Home Screen Icons 3.3.4 Title Bar Each available diagnostic tool function is represented by a icon on the Home The title bar (Figure 3-2) at the top of the screen provides basic information about screen. -
Page 16: Common Toolbar Control Icons
Basic Operation and Navigation Basic Navigation 3.3.5 Common Toolbar Control Icons 3.3.6 Scroll Bar Common control icon functions are described in the following table. Specific A vertical scroll bar appears along the right-hand edge of the screen when function control icons are described in their applicable sections. Displayed control additional data expands above or below what is currently on the screen icons vary depending on the active function or test. -
Page 17: Screen Messages
Screen Messages 3.4.3 Vehicle Communication Messages When “no communication” messages are displayed, it indicates the diagnostic tool 3.4.1 Snap-on Messages and the vehicle electronic control module are not communicating. The following conditions cause “no communication” messages to display: Periodically messages will be displayed to inform you of software updates and upgrades, as well as other important information. -
Page 18: Section 4: Data Cable Connection (Automotive)
Vehicles) Connect: DA-4 Cable. Location: Under drivers side dash. IMPORTANT Only use original Snap-on data cables and accessories with your diagnostic tool. Total data cable length must not exceed 114.17 inches (2.9 meters). Basic data cable connection procedure: For OBD-II/EOBD compliant vehicles use the supplied DA-4 data cable. - Page 19 Data Cable Connection (Automotive) Data Cable Connection (OBD-II/EOBD Vehicles) 4. Connect the16-pin (J-1962) end of DA-4 cable (Figure 4-4) to the vehicle DLC. J-1962 DA-4 Figure 4-3 DA-4 data cable LED flashlight Figure 4-4 DA-4 data cable (16-pin end) connection to vehicle DLC (typical DLC locations) 5.
-
Page 20: Section 5: Scanner
Scanner Section 5 Basic Operation This section describes the basic operation of the Scanner function for automotive applications. 5.1.1 Scanner Overview The Scanner icon is located on the Home screen. The Scanner function allows your diagnostic tool to communicate Scanner is a menu driven application that communicates with vehicle control with the electronic control modules (ECMs) of the vehicle being modules to access diagnostic trouble codes (DTCs), parameter data (PIDs), serviced. -
Page 21: Scanner - Starting / Stopping
Scanner Features and Icons Features and Icons 5.1.2 Scanner - Starting / Stopping The following general features and control icons apply to both the Scanner and the To start the Scanner function: OBD-II/EOBD functions. 1. From the Home screen, select the Scanner icon. 5.2.1 Scanner Features 2. -
Page 22: Basic Scanner Operation (Quick Start)
Scanner Features and Icons 5.2.2 Basic Scanner Operation (Quick Start) 5.2.3 Vehicle Identification This section lists the basic scanner operation steps, and is only intended as a The vehicle must be correctly identified for the diagnostic tool to communicate, and quick-start reference. - Page 23 Scanner Features and Icons b. If Instant ID is not supported, you will be prompted to select the vehicle make and year (If needed). Then a menu option is displayed to choose either Automatic ID or Manual ID. Connect: DA-4 Cable. - Selecting Automatic ID (If supported by the vehicle) will briefly display a Location: Under drivers side dash.
- Page 24 Scanner Features and Icons Instant ID The Instant ID function, can save time when initially identifying a vehicle, by automatically communicating with the vehicle to complete the vehicle identification process. This function requires specific vehicle support requirements, and connection procedures to operate. Vehicle requirements: •...
-
Page 25: System Main Menu Options
Scanner Features and Icons Actuator Tests—similar to functional tests, checks the operation of certain NOTE • actuators, such as solenoid valves and relays. If the Scanner feature is exited during the session that Instant ID was used, Memory Resets—allows you to reprogram adaptive values for certain •... -
Page 26: Codes - View / Save
Scanner Codes - View / Save Codes - View / Save 5.3.1 Codes Menu After selecting a System, this selection “Codes Menu” may appear as a different name (e.g Codes, Codes Menu, Codes Only, Codes (No Data), Service Codes) or something similar depending on the vehicle manufacturer. -
Page 27: Code Scan (With Vehicle System Report/Snap-On Cloud)
Frame/Failure Records. Make sure no vital diagnostic information will be lost before clearing codes. Figure 5-7 5.3.2 Code Scan (with Vehicle System Report/Snap-on Cloud) Code Scan is available from the Vehicle System menu, and when selected it scans the vehicle control modules for codes. For detailed information see... -
Page 28: Viewing And Saving Data (Pids)
Scanner Viewing and Saving Data (PIDs) Viewing and Saving Data (PIDs) 5.4.1 Scanner Control Icons The scanner toolbar contains control icons. Control icons may vary depending on Selecting Data or other similar data menu option (depending on the vehicle the active function or test. An inverted (highlighted) icon indicates it is selected. manufacturer) displays PID data for the selected system (Figure 5-8). -
Page 29: About The Data Buffer
Scanner Viewing and Saving Data (PIDs) 5.4.2 About the Data Buffer The diagnostic tool has the capability to collect, store and save PID data utilizing internal storage memory and buffer memory. When Data is displayed onscreen, a data buffer automatically starts to store it in buffer memory. -
Page 30: Pausing And Reviewing Active Data
Scanner Viewing and Saving Data (PIDs) Green (Trigger Activation Reference Point) - When using triggers, green vertical Toolbar control icons are described in on page 20 and Scanner Control Icons cursors are displayed in all PIDs (except the PID that was triggered) as reference to Common Toolbar Control Icons on page 8. -
Page 31: Saving Data Files
Scanner Viewing and Saving Data (PIDs) 5.4.5 Saving Data Files To resume data collection (after pausing): Select the Start icon • Saving data is useful when trying to isolate an intermittent problem or to verify a The screen changes back to display data (Figure 5-14). - Page 32 Scanner Viewing and Saving Data (PIDs) To view saved data (on the diagnostic tool): Pressing the Save icon more than once in the same data collection session will create multiple (.SCM) files. Each file will contain gray (vertical cursors) The saved file can be viewed by selecting Previous Vehicles and Data > (Figure 5-16) indicating where the data was paused.
-
Page 33: Using Zoom
Scanner Viewing and Saving Data (PIDs) 5.4.6 Using Zoom 5.4.7 Changing Data Views - PID List / Graphs The zoom function allows you to change the magnification level of the Selecting the View icon (Figure 5-19) opens a drop-down menu of graphed data during data collection and review. -
Page 34: Selecting Pids To Display (Custom Display)
Scanner Viewing and Saving Data (PIDs) 5.4.8 Selecting PIDs to Display (custom display) The 1, 2, and 4 Graph views divide the screen horizontally to simultaneously display data graphs for the indicated number of parameters (Figure 5-20). The Custom Data List icon on the toolbar is used to select which PIDs to display. -
Page 35: Locking Pids (To Always Display At Top)
Scanner Viewing and Saving Data (PIDs) The toolbar icons provide options for selecting and deselecting parameters to Up to three parameters can be locked at a time. Once locked, a parameter include or remove from the custom data list: remains locked until it is manually unlocked, or communication with the vehicle is stopped. -
Page 36: Using Triggers
Scanner Viewing and Saving Data (PIDs) 5.4.10 Using Triggers Trigger Description and Features Setting PID triggers allows you to configure the diagnostic tool to automatically save PID data to a file, when a PID value meets an upper/ lower limit (trigger point). When a PID value meets the trigger point it activates the trigger which captures a short recording of all available PID data and saves it as a data file. - Page 37 Scanner Viewing and Saving Data (PIDs) If triggers are already set, the menu options are: PID Trigger Status Icons - Clear Trigger—deletes the highlighted trigger The icons (below) are used to help you quickly identify the status of individual PID - Disarm Trigger—disarms the highlighted trigger triggers: - Clear All Triggers—deletes all set triggers...
- Page 38 Scanner Viewing and Saving Data (PIDs) Arming triggers: 1. Select the Trigger icon. 2. Select Arm Triggers. The trigger point lines change color to indicate an armed condition (Figure 5-29). All set PID triggers are armed simultaneously (if more that one is set). Once armed it remains armed until you clear it or the trigger is activated.
-
Page 39: Functional Tests
Scanner Functional Tests Functional Tests About Activated Triggers A trigger is activated (displays red flag) when a PID value meets an upper/ The Functional Tests selection is used to access vehicle-specific subsystem tests. lower limit (trigger point). Available tests vary by manufacturer, year, and model. Only the tests available for the identified vehicle display in the menu. - Page 40 Scanner Functional Tests Toggle and variable control tests often display functional test controls on the toolbar at the top of the screen with PID data in the main body. Figure 5-34 Functional test example Figure 5-32 Functional test example Figure 5-33 Functional test example Figure 5-35 Functional test example...
-
Page 41: Troubleshooter
Scanner Troubleshooter A Test icon on the toolbar activates the test, and a Return, or similarly named, icon Fast-Track Data Scan—contains information and guidelines on how to • validate data readings for certain sensors and actuators, PID data values are cancels the test. -
Page 42: Section 6: Vehicle Code Scan / (Snap-On Cloud)
Vehicle System Report (Figure 6-1). In addition, code scans are automatically configured into a Vehicle 2016 Nissan Rogue 2.5L System Report and uploaded to your Snap-on Cloud account. From the Snap-on VEHICLE INFORMATION CODE SCAN RESULTS JN8AS5MT0FW000000 Systems Analyzed: 10... -
Page 43: Using Code Scan
Vehicle Code Scan / (Snap-on Cloud) Main Topic Links Main Topic Links When initially opened (Figure 6-3), a progress bar is shown at the top indicating the active scanning progress. Once completed, code results are displayed by system. Using Code Scan page 35 •... -
Page 44: Total Number Of Systems (Modules) Analyzed
47 After the code scan has competed it is automatically saved as an .XML file on the diagnostic tool, and is uploaded to your account on the Snap-on Cloud (if registered Figure 6-4 Code Scan systems analyzed result total and connected). -
Page 45: List Of All The Systems Analyzed With Dtcs Totals
Vehicle Code Scan / (Snap-on Cloud) Using Code Scan 6.1.2 List of All the Systems Analyzed with DTCs Totals A categorized system list with DTC totals is displayed in the order they are scanned. To view the main menu for a system in the list, select the system, then select the... -
Page 46: Readiness Monitor Test Status
• Readiness monitor test status • 6.2.1 Printing the Vehicle System Report Use the Snap-on Cloud to print the vehicle system report from your PC or mobile device, see Quick Reference (print / download / share) on page 66. The vehicle system report can also be customized and printed using ShopStream... -
Page 47: Section 7: Obd-Ii/Eobd
OBD-II/EOBD Section 7 This section describes the basic operation of the OBD-II/EOBD function. Fast-Track Troubleshooter page 43 • ($01) Display Current Data page 43 • The OBD-II/EOBD icon is located on the Home screen. ($02) Display Freeze Frame Data page 43 •... -
Page 48: Obd-Ii/Eobd Menu
OBD-II/EOBD OBD-II/EOBD Menu OBD-II/EOBD Menu The following options are available from the OBD-II/EOBD menu: OBD Health Check • OBD Direct • 7.2.1 OBD Health Check The OBD-II Health Check offers a way to quickly check for and clear emissions- related diagnostic trouble codes (DTCs), and to check readiness monitors for emissions testing. - Page 49 OBD-II/EOBD OBD-II/EOBD Menu If a test failed during the drive cycle, the DTC associated with that test is • reported. If the pending fault does not occur again within 40 to 80 warm-up cycles, the fault is automatically cleared from memory. Test results reported by this service do not necessarily indicate a faulty •...
-
Page 50: Obd Direct
OBD-II/EOBD OBD-II/EOBD Menu 7.2.2 OBD Direct The information screen shows how many control modules were detected, which ECM is communicating, and which communication protocol is being OBD Direct includes the following menu and submenu choices: used. OBD Diagnose 3. Select Continue. •... - Page 51 OBD-II/EOBD OBD-II/EOBD Menu Readiness Monitors Use this menu item to check the readiness of the monitoring system. Monitors not supported will display “not supported”. Scroll, if needed, to view the entire list of monitors (Figure 7-3). Selecting Readiness Monitors opens a submenu with two choices: Monitors Complete Since DTC Cleared—displays the results of all monitor •...
- Page 52 OBD-II/EOBD OBD-II/EOBD Menu To clear emission related Data: ($05) Oxygen Sensor Monitoring 1. Select Clear Emissions Related Data from the menu. This option opens a menu of tests available for checking the integrity of the oxygen A confirmation message displays to help prevent loss of any vital data (O2) sensors.
- Page 53 OBD-II/EOBD OBD-II/EOBD Menu ISO 14230-4 (Keyword Protocol 2000) ($0A) Emission Related DTC with Permanent Status • SAE J2284/ISO 15765-4 (CAN) • This option displays a record of any “permanent” codes. A permanent status DTC is one that was severe enough to illuminate the MIL at some point, but the MIL may When initially attempting to establish communication with the ECM the diagnostic not be on at the present time.
-
Page 54: Section 8: Previous Vehicles And Data
Previous Vehicles and Data Section 8 This section describes the basic operation of the Previous Vehicles and Data function. The Previous Vehicles and Data icon is located on the Home screen. This function allows you to select recently tested vehicles and access saved data files. -
Page 55: View Saved Data
Previous Vehicles and Data Previous Vehicles and Data Menu 8.1.2 View Saved Data To review a saved data file or image: 1. Select Previous Vehicles and Data from the Home screen. Selecting the View Saved Data menu option opens a list of all the saved data 2. -
Page 56: Delete Saved Data
Previous Vehicles and Data Previous Vehicles and Data Menu 8.1.4 Delete Saved Data Viewing Code Results on the diagnostic tool Selecting a system code or a code scan .XML file from the saved file list, opens that This menu option is used to permanently erase saved files from memory. file onscreen (Figure 8-4). -
Page 57: Section 9: Tools
Tools Section 9 Tools Menu This section describes the basic operation of the Tools function. The Tools icon is located on the Home screen. This function allows The following options are available from the Tools menu: you to configure diagnostic tool settings to your preferences. Connect-to-PC (File Transfer)—use to transfer and share files with a personal •... -
Page 58: Connect-To-Pc (File Transfer)
Get Connected allows you view (Figure 9-2) the diagnostic tool serial number, PIN your personal computer using a USB cable. and Code needed for Snap-on Cloud registration. See Snap-on Cloud on page 64 for more information. The optional ShopStream Connect™ PC software allows you to view, print and save data files on your PC. -
Page 59: Configure Shortcut Button
Tools Tools Menu 9.1.3 Configure Shortcut Button 9.1.4 System Information This feature allows you to change the function of the Shortcut button. Options are: System Information allows you to view patent information and system information, such as the software version and serial number of your diagnostic tool. Brightness—... -
Page 60: Settings
Tools Tools Menu 9.1.5 Settings DISPLAY (settings) This Tools selection allows you to adjust certain basic diagnostic tool functions to Brightness your personal preferences. Selecting opens an additional menu that offers the Selecting this option opens the brightness setting screen for adjusting the back following: lighting of the display (Figure... -
Page 61: High Contrast Toolbar
Tools Tools Menu Color Theme High Contrast Toolbar This option allows you to select between a white and black background for the This option allows you to switch to a high contrast toolbar. This toolbar features screen. The black background can be beneficial when working under poor lighting black and white icons with crisp graphics that are easier to see in poor lighting conditions. -
Page 62: Font Type
Tools Tools Menu Font Type This option allows you to select between standard and bold faced type for the display screen. Bold type makes screen writing more legible under poor lighting or bright sunlight conditions. Selecting opens a menu with two choices: Normal Font and Bold Font. Select a menu item or scroll and then press the Y/a button to make a selection. -
Page 63: Time Zone
Tools Tools Menu Figure 9-9 Clock settings Figure 9-8 Touch screen calibration - Passed 4. Select the up (+) icon on the screen or press the up (b) button to incrementally increase the number in the highlighted field. Select the down (–) icon on the screen or press the down (d) button to incrementally decrease the number. -
Page 64: Time Format
Tools Tools Menu Time Format Configuring Scanner This option determines whether time is displayed on a 12 or 24 hour clock. This option allows you to change the scanner display to toggle scales on and off. Selecting opens a menu with two choices: Scales are the graduations and values that display on the horizontal axis at the base of the parameter graphs. - Page 65 Tools Tools Menu Configure Units Selecting opens a dialog box that allows you to choose between US customary or metric units of measure for various units. Figure 9-11 Configure units menu To change the units setup: 1. Select Tools from the Home screen to open the menu. 2.
-
Page 66: Section 10: Wi-Fi Connection / Troubleshooting
If the Wi-Fi indicator is displayed in the title bar, Wi-Fi is on. If Wi-Fi is off, see To use features like the Snap-on Cloud, SureTrack, and Oil Specs and Resets, a Turning On Wi-Fi and Connecting to a Network to turn it on and connect. -
Page 67: Wi-Fi Icons (Setup)
6. From the Connect confirmation screen select OK to continue using this (Figure 10-2). connection or Forget to disconnect this connection. The screen will change to display your confirmed network connection and • Snap-on Cloud registration information. For Snap-on Cloud registration information see Snap-on Cloud on page 64. -
Page 68: Add Network Advanced (Connecting To A Hidden Network)
Wi-Fi Connection / Troubleshooting Add Network Advanced (Connecting to a hidden network) 10.6 Wi-Fi Testing If the status message “Not Connected” is displayed, retry the configuration • process or see “Wi-Fi Testing” on page 60 for additional information. If you are experiencing network connection issues, an automated testing feature is available to quickly test your network connection. -
Page 69: Wi-Fi Troubleshooting And Status Messages
4. If a connection issue(s) is present, select View Summary to review the results. equipment. There may be some situations that require your time for router The summary information is helpful if you are experiencing difficulties with connection troubleshooting and/or additional consultation and equipment. Snap-on your connection (Figure 10-5). - Page 70 Wi-Fi Connection / Troubleshooting Wi-Fi Troubleshooting and Status Messages Check Router Settings Verify the following router settings BEFORE you begin troubleshooting a non- General -Troubleshooting connectivity or “No Connection” problem. After each check, make any corrections Problem Possible Cause Corrective Action as necessary then retest for connectivity.
-
Page 71: Informative Messages
Wi-Fi Connection / Troubleshooting Wi-Fi Troubleshooting and Status Messages 10.7.1 Informative Messages Messages may be displayed to inform you of pending issues or general status. Connection Tests - Troubleshooting Depending on your access and connection status, the following are typical Possible Cause messages that may be displayed: Failed Test... -
Page 72: Section 11: Snap-On Cloud
66 • 11.2 Important Notes Registration - Getting Started page 64 • To use the Snap-on Cloud, account setup and diagnostic tool Wi-Fi connection is • Using the Snap-on Cloud page 66 • required. Snap-on Cloud - New User Registration page 65 –... -
Page 73: Snap-On Cloud - New User Registration
Using the Snap-on Cloud. displayed. Registration information can also be found in the Tools menu, see Your diagnostic tool is now registered to your Snap-on Cloud online account. Code Snap-on Cloud Setup Information Screen on page 66. scan reports will be automatically sent (only when connected to Wi-Fi) to your online account from the device. -
Page 74: Snap-On Cloud Setup Information Screen
64. The diagnostic tool must be connected to a Wi-Fi network, see • Wi-Fi Connection The PIN and Code numbers will change each time you view the Snap-on / Troubleshooting on page 145. (Figure 11-2 Cloud Get Connected screen Figure 11-1). -
Page 75: Logging In To The Snap-On Cloud (Registered User)
Snap-on Cloud Using the Snap-on Cloud 11.4.2 Logging in to the Snap-on Cloud (registered user) Logging in to the Snap-on Cloud (registered user): 1. Using your mobile device or PC visit ALTUSDRIVE.com. 2. Select the Login icon (Figure 11-3). Figure 11-4 Figure 11-3 3. -
Page 76: Navigating The Snap-On Cloud (Toolbars)
Snap-on Cloud Using the Snap-on Cloud 11.4.3 Navigating the Snap-on Cloud (Toolbars) 8/18/2018 The upper and lower toolbars are available from all screens. 2010 Chrysler Town & Country 3.8L V6 MPI MyAcct - 8/16/2018, 1:12:20 PM The upper toolbar includes a menu icon (right side) (Figure 11-5). - Page 77 Snap-on Cloud Using the Snap-on Cloud File Detail (Tags) The following describes File Detail card features. As shown in selecting (touching) a report from My Files opens the report Figure 11-9 File Detail card. Selecting the report again opens that report in a new browser tab.
-
Page 78: Sharing/E-Mail An Individual Report (Link Icon)
Snap-on Cloud Using the Snap-on Cloud The tag text then can be used when performing a search to find all reports Sharing all Reports (Share My Gallery) with the same tag. Each text entry (word) that is separated by a space To share your entire gallery (all files in My Files): (return) is added as a tag, and is displayed in the Active Tag field. -
Page 79: Search
Snap-on Cloud Using the Snap-on Cloud 11.4.5 Search 11.4.6 Favorites The Search screen allows you to perform text searches on all uploaded files and view The Favorites screen displays all the reports selected as favorites (Figure 11-13). the results. To search for a specific file or set of files, enter a search term in the search box and... -
Page 80: Profile
• Logging Out of the Snap-on Cloud on page 75 Profile Manager opens a new browser tab. To return to the Snap-on Cloud after logging out of Profile Manager, you must select the ALTUS Home Page browser tab. Enter your Username and Password at the Login screen. - Page 81 Personal Information This screen manages the following account information (Figure This screen manages the following personal account information (Figure 11-17): 11-18): Authorization Key (not required for Snap-on Cloud account registration) First Name • • Account Expiration Date Last Name •...
- Page 82 (Figure 11-20): Profile Manager opens a new browser tab. To return to the Snap-on Cloud after logging out of Profile Manager, you must select the ALTUS Home Page Select Add a Device to setup and add an authorized device (e.g. diagnostic tool or browser tab.
-
Page 83: Logging Out Of The Snap-On Cloud
Snap-on Cloud Using the Snap-on Cloud Logging Out of the Snap-on Cloud To log out of the Snap-on Cloud select Profile from lower toolbar, then select Logout (Figure 11-22). Figure 11-22... -
Page 84: Section 12: Shopstream Connect
ShopStream Connect ™ Section 12 Introduction 12.1 Using SSC (Connecting to your PC) This section provides a brief introduction to the features and operation of To connect and use SSC with your diagnostic tool: ShopStream Connect (SSC). 1. Download and install SSC on your PC from: SSC is a companion PC application (provided at no charge) that extends the https://www.snapon.com/diagnostics/UK/diagnostic-tools/shopstream- capabilities of your diagnostic tool, by connecting to your PC. -
Page 85: Ssc Main Screen
ShopStream Connect ™ SSC Main Screen 12.2 SSC Main Screen 3— Data Manager Toolbar—provides control icons that perform a variety of operations on data files. The ShopStream Connect software will open automatically when you connect the 4— Main Menu bar—contains File, Edit, Tools, and Help menus. diagnostic tool to your PC USB connection, Using SSC (Connecting to your PC) 5—... -
Page 86: Scanner Dataviewer
ShopStream Connect ™ Scanner DataViewer 12.3 Scanner DataViewer 12.4 Image Viewer SSC allows you to view and print .bmp, .jpg and .sps image files (screenshots) saved SSC allows you to view data files recorded with your diagnostic tool, on your PC. on your diagnostic tool, with your PC. -
Page 87: Printing The (Code Scan) Vehicle System Report
ShopStream Connect ™ Printing the (Code Scan) Vehicle System Report 12.5 Printing the (Code Scan) Vehicle System Report To print the Vehicle System Report, the saved code scan .XML file must be opened using ShopStream Connect. To print the Vehicle System Report using ShopStream Connect: 1. -
Page 88: Customizing The (Code Scan) Vehicle System Report
ShopStream Connect ™ Customizing the (Code Scan) Vehicle System Report 12.6 Customizing the (Code Scan) Vehicle To edit the Shop Information (header) of the Vehicle System Report: 1. From ShopStream Connect, select Tools > Options > Edit Shop Info System Report (Figure 12-9). - Page 89 ShopStream Connect ™ Customizing the (Code Scan) Vehicle System Report To edit the VIN and License Plate fields, and/or add notes to the Vehicle System Report: 1. From ShopStream Connect, open the code scan .XML file to be edited (Figure 12-11).
-
Page 90: Software Upgrades And Updates
ShopStream Connect User Manual from our website: 12-12). https://www.snapon.com/diagnostics/uk/User-Manuals.htm The software checks the Snap-on web server for available updates. My Diagnostic Tool Figure 12-12 2. If service release updates are available, select Next to continue, then select... -
Page 91: End User License Agreement
End User License Agreement is read. Use of the device Figure 12-15 Typical EULA acceptance screen acknowledges your acceptance of the End User License Agreement. The Snap-on Incorporated Software End User License Agreement is available at: https://eula.snapon.com/diagnostics To Accept: at the screen prompt... -
Page 92: Section 13: Maintenance
Maintenance Section 13 13.1.1 Cleaning the Touch Screen This section describes basic cleaning and battery replacement procedures for your diagnostic tool. The touch screen can be cleaned with a soft cloth and a mild window cleaner. Main Topic Links IMPORTANT Cleaning and Inspecting the Diagnostic Tool page 84 •... -
Page 93: Ordering A New Battery Pack
IMPORTANT Keep the following in mind when using and handling the battery pack: If replacing the battery pack, only use the recommended Snap-on replacement battery pack. Do not short circuit battery pack terminals. -
Page 94: Disposing Of The Battery Pack
Maintenance Battery Pack Service 13.2.4 Disposing of the Battery Pack Always dispose of the battery pack according to local regulations, which vary for different countries and regions. The battery pack, while non-hazardous waste, does contain recyclable materials. If shipping is required, ship the battery pack to a recycling facility in accordance with local, national, and international regulations. -
Page 95: Customer Support / Training
Download the latest version of this manual and other related technical documentation from our website. https://www.snapon.com/diagnostics/uk/User-Manuals.htm Snap-on® Training Solutions® - Training Videos (examples) Accessories - Find diagnostic tool accessories on our website. Contact your Introduction and Navigation Global OBD-II sales representative to purchase product accessories. - Page 96 Diagnostic Quick Tips - Video Series NOTES Snap-on Diagnostic Quick Tips videos are available at no charge on our website and URL links (above) and titles listed (below) are subject to change and may not be available in all markets.
- Page 97 Customer Support / Training Diagnostic Quick Tips - Video Series Snap-on® Training Solutions® - Diagnostic Quick Tips Videos (examples) Ford Relative Injector Flow Test Speed Up Your Diagnostics (Scanner) Ford TPMS Reprogramming The Power of Troubleshooter Tips (Scanner) Ford® 6.7L Transmission Solenoid...
-
Page 98: Legal Information
Download the latest version of this manual and other related technical documentation from the For a listing of Snap-on products that are protected by patents in the United States Snap-on Diagnostics website.
Need help?
Do you have a question about the SOLUS Legend and is the answer not in the manual?
Questions and answers
how do you get started using this scaner
To get started using the Snap-On Legend scanner:
1. From the Home screen, select Scanner.
2. Select Automotive.
3. In the manufacturer (vehicle make) menu, select Demonstration.
4. The simulated Vehicle ID process will begin. You can choose from three demonstration vehicles.
Note: Do not connect the diagnostic tool to a vehicle when using the demonstration modes.
This answer is automatically generated