Snap-On Zeus User Manual
Hide thumbs
Also See for Zeus:
- Getting started pack (10 pages) ,
- User manual (194 pages) ,
- Getting started pack (10 pages)
Table of Contents
Advertisement
Quick Links
Advertisement
Chapters
Table of Contents
Troubleshooting

Related Manuals for Snap-On Zeus


Summary of Contents for Snap-On Zeus
- Page 1 User Manual ZEEMS342A Rev. F Start...
- Page 2 Using Page Controls OBD Direct Table of Contents (TOC) Guided Component Tests General Information Scope Multimeter Getting Started SureTrack & Repair Information Quick Reference Information Snap-on Cloud ® The Snap-on Cloud Vehicle History Maintenance Quick Lookups Data Manager Scanner Scanner Demonstration...
-
Page 3: Table Of Contents
Contents Table of Contents Table of Contents Contents ......................i Menu Icon....................32 Help....................... 32 Safety Information ..................1 Changing the Units of Measurement ............33 Using This Manual ..................3 Section 4: Compact Scan Module (CSM) ..........34 Power Source ....................34 Quick Reference .................. -
Page 4: Contents
Contents Table of Contents Edit Vehicle System Report Shop Information ........55 Section 8: Guided Component Tests............89 Hide / Show Vehicle System Report Timestamp ........55 Safety Information ..................89 Printing the Vehicle System Report............55 General Information..................90 Clear All Codes Read by Code Scan ............ - Page 5 Contents Table of Contents Peak Detect Icon ................. 117 Glossary of Common Terms .............. 149 Filter Icon..................... 118 Section 10: Quick Lookups ..............151 Invert Icon.................... 118 TSBs (Technical Service Bulletins) ............153 Coupling AC Icon ................118 Tire and Wheel Service ................156 Slope (Trigger) Icon................
- Page 6 SureTrack Community................. 183 Snap-on Cloud - New User Registration ..........204 SureTrack Screens ..................183 Snap-on Cloud - ShopKey Pro or SureTrack User Setup ....205 SureTrack Home Page................ 183 Snap-on Cloud Get Connected Screen..........206 1Search Limited Top 10 Results Page..........184 Using the Snap-on Cloud ................
- Page 7 Contents Table of Contents Screen Protector Installation..............225 Stylus Tip Replacement (Touch Screen) ........... 226 Legal Information..................227...
-
Page 8: Safety Information
Safety Information READ ALL INSTRUCTIONS Read, understand and follow all safety messages and instructions in this manual, the accompanying Important Safety Instructions manual, and on the test For your own safety, the safety of others, and to prevent damage to the product and equipment. - Page 9 Safety Information Safety Message Conventions Safety Message Conventions Safety messages are provided to help prevent personal injury and equipment damage. Safety messages communicate the hazard, hazard avoidance and possible consequences using three different type styles: Normal type states the hazard. •...
-
Page 10: Using This Manual
Using This Manual Conventions This manual contains basic operating instructions and is structured in a manner to help you become familiar with your diagnostic tool features and perform basic operations. Hyperlinks The illustrations in this manual are intended as reference only and may not depict Hyperlinks (links) are identified by blue colored text, and take you to other related actual screen results, information, functions or standard equipment. - Page 11 Using This Manual Conventions Symbols Notes and Important Messages The “greater than” arrow (>) indicates an abbreviated set of selection instructions. The following messages are used. Example: Note Select Utilities > Tool Setup > Date. • A note provides helpful information such as additional explanations, tips, and The above statement abbreviates the following procedure: comments.
-
Page 12: Quick Reference
• Click on an icon below to go to that section. Information Services The following integrated services provide up-to-date service/repair information directly to your diagnostic tool, via wireless network connection from our Snap-on Web Services Network: Scanner OBD Direct Guided Scope SureTrack &... - Page 13 Getting Started and Logging In instructions. ® The Snap-on Cloud Using the Snap-on Cloud allows you to upload, store and share code scan reports, Figure 3-1 screenshots and pictures taken with your diagnostic tool. For more on the Snap-on Cloud, see The Snap-on® Cloud on page 203.
- Page 14 Quick Reference Common Abbreviations Used Common Abbreviations Used CSM - Compact Scan Module CTM - Component Test Meter (Guided Component Tests) DLC - Data Link Connector (vehicle) DMM - Digital Multimeter ECM - Electronic Control Module GCT - Guided Component Tests GMM - Graphing Multimeter ™...
-
Page 15: Section 1: General Information
General Information Section 1 Introduction Main Topic Links This diagnostic tool is a specialized personal automotive diagnostic solution that Diagnostic Tool Feature Locations page 9 • combines information with test instrumentation to help you diagnose symptoms, Power (Battery Pack/Charging) page 10 •... -
Page 16: General Information
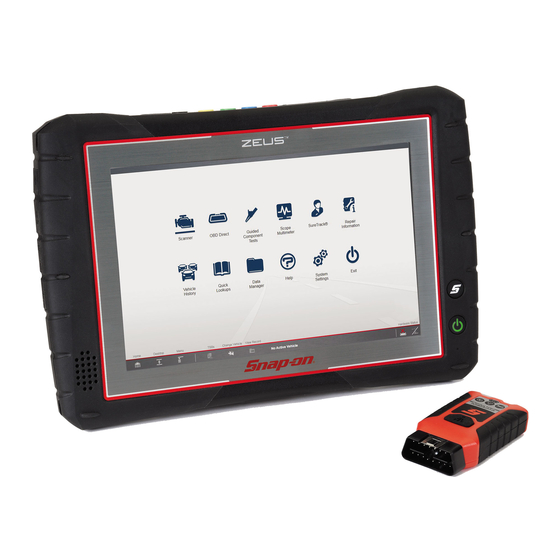
General Information Main Topic Links Diagnostic Tool Feature Locations Capacitive Touch Screen Shortcut (S) Button (special functions) Power Button (with backlit LED functions) Audio Speaker Stylus Storage Scope Module M4 (removable) Camera Lens Communication and Power Jacks Cover Head Phone Jack 10. -
Page 17: Internal Battery Pack
General Information Turning On/Off, and Emergency Shutdown Power (Battery Pack/Charging) Turning On/Off, and Emergency Shutdown 1.2.1 Internal Battery Pack The following sections describe how to turn the diagnostic tool on and off, and perform an emergency shutdown. The diagnostic tool (display unit) comes equipped with a rechargeable internal battery pack that can be charged using the supplied AC power adapter. -
Page 18: Emergency Shutdown
Attachment panel, see Vehicle History on page 161 erratic operation. All screenshots are also uploaded to the Snap-on Cloud To perform an emergency shutdown: automatically when they are created. See The Snap-on® 1. Press and release the Power button. -
Page 19: Configure Shortcut (S) Button
The Advanced selection has no functionality under normal operating conditions, Previous and should ONLY be selected when directed to do so, by Snap-on customer Displays in Gallery mode. Selecting opens the picture prior to the current service. image in the gallery. -
Page 20: Viewing Pictures
Vehicle History instructions, visit Windows online support. page 161. Wi-Fi connection allows you to: All images are also uploaded to the Snap-on Cloud automatically when they are created. See The Snap-on® Cloud on page 203 for more information on Access the Internet using the Windows web browser. - Page 21 General Information Windows (Applicable Features / Operations) After bootup if Wi-Fi is not automatically connected the Wi-Fi icon in the System Tray (lower right side) (Figure 1-4), or on the Diagnostic Suite lower toolbar (Figure 1-5) My wireless connection 1 indicates Wi-Fi is not connected.
-
Page 22: Windows Taskbar
General Information Windows (Applicable Features / Operations) Touch Screen Gestures NOTE This device uses common touch screen gesture motions (e.g. pinch-to-zoom, press Wi-Fi performance varies depending on your wireless network equipment and and tap, pan and swipe). The terms used to describe the various gestures may vary ISP. -
Page 23: Sleep Mode (Auto Off Display)
General Information Windows (Applicable Features / Operations) 1.6.5 Virtual Keyboard (Entering Text) on and your open applications active. When you are ready to resume work, the diagnostic tool can be started up again quickly, just by pressing the Power button. The Windows Touch Keyboard (Virtual Keyboard) allows you to type characters Sleep Mode settings can be found in Windows Control Panel >... -
Page 24: E-Mail Client Setup
General Information Windows (Applicable Features / Operations) 1.6.7 E-Mail Client Setup The Data Manager function features an e-mail option that allows you to send a saved data or image files as an e-mail attachment. To use this feature, you must install an e-mail client, and then link your existing e-mail address to the client. - Page 25 General Information Windows (Applicable Features / Operations) NOTE E-mail client configuration settings should automatically be set during installation. If problems arise with the setup and manual configuration is needed, refer to the e-mail client help information and the Windows help information.
-
Page 26: Calibrating The Touch Screen
General Information Windows (Applicable Features / Operations) 1.6.8 Calibrating the Touch Screen NOTE The touch screen can be calibrated for accuracy using the Windows Tablet PC If you are using an optional touch screen (e.g. using an external touch screen Settings. -
Page 27: Printing / Printer Setup
General Information Windows (Applicable Features / Operations) 1.6.9 Printing / Printer Setup USB Printer Setup 1. Turn the printer on. Selecting Print opens a standard Windows Print dialog box. 2. Connect the USB cable from the printer to the diagnostic tool. To print, a printer must installed and set as the system default printer. - Page 28 General Information Windows (Applicable Features / Operations) 7. Follow the onscreen instructions to search, locate and install your printer. 1. Turn your printer on and make sure it is setup per the manufacturers Windows automatically searches for available printers on the network instructions for direct connection.
- Page 29 General Information Windows (Applicable Features / Operations) 10.Set the printer as the default printer. See Default Printer Setting on page 22. My wireless connection 1 Default Printer Setting My wireless connection 2 To set a default system printer: 1. Select the Windows icon on the desktop (lower left). My wireless connection 3 2.
-
Page 30: Operating System Restore
To restore the operating system 1. Turn on the diagnostic tool. 2. During boot-up wait for the “Press the “S” button to run Snap-on System Restore.” message to display, then Press the Shortcut (S) button. A progress indicator displays while the program loads. -
Page 31: Accessories (Optional Equipment)
General Information Accessories (Optional Equipment) Accessories (Optional Equipment) Diagnostic Tool Technical Specifications Visit our website, or contact your local sales representative to learn more about diagnostic tool accessories. The following are just a few of the optional accessories that will allow you to take full advantage of your diagnostic scanner. Not all Item Description / Specification accessories listed here may be available in all markets. -
Page 32: Section 2: Scanner Demonstration
Scanner Demonstration Section 2 Demonstration Modes Demo Setup - Before you begin Before starting these demos, connect the AC power supply to the diagnostic tool, Two training (demonstration) modes are provided to help you to become familiar and connect the compact scan module (CSM) to the diagnostic tool using the USB with Scanner functions: cable. - Page 33 Scanner Demonstration Scanner Demonstration After the vehicle has been identified, a systems menu displays. This menu information. However, in demonstration mode the Intelligent Diagnostics shows all of the vehicle systems available (supported by the vehicle) for interactive demonstration starts. testing. Typical systems choices may include: Body Control Service Resets and •...
- Page 34 Scanner Demonstration Scanner Demonstration 4. As the demo continues, navigational hints and code-specific features are 7. The Intelligent Diagnostics main menu opens. Descriptions are provided for described (Figure 2-3). Select Next to continue. the various options, scroll down and select “GIVE IT A TRY” to continue. 8.
- Page 35 Scanner Demonstration Scanner Demonstration Saving a PID data file: Scanner Demo 5 - Perform a Code Scan Select Save from the upper toolbar. A confirmation message will briefly display This demonstration simulates performing a typical code scan of all supported to inform you that the data file has been saved.
- Page 36 Scanner Demonstration Scanner Demonstration 4. Select Back until the Home screen is displayed. Viewing Saved Data (PIDs): Data files are saved with a .pids file extension and show the date saved and vehicle information in the file name. 1. From the Home screen select Data Manager. 2.
-
Page 37: Section 3: Getting Started - Diagnostic Suite Program
Getting Started - Diagnostic Suite Program Section 3 Introduction NOTE This section describes the basic operation, and navigation of the ShopStream The ShopStream Diagnostic Suite can also be started from the Windows Start Diagnostic Suite program Home screen and icons. menu. -
Page 38: Function Icons
See OBD Direct Training and Support page 84 Opens the Snap-on Diagnostics website. From the website you can view training videos or download the diagnostic tool user manual and other product support documentation. See Guided Component Test... -
Page 39: Menu Icon
Getting Started - Diagnostic Suite Program Menu Icon Toolbar Icons Icon Description Scope Module Operation of the icons located on the toolbar are described in the table below: Hardware Status Indicates the connectivity status of the Scope Multimeter Module. Icon changes depending on status. -
Page 40: Changing The Units Of Measurement
Getting Started - Diagnostic Suite Program Changing the Units of Measurement Changing the Units of Measurement The Diagnostic Suite units of measurement can be changed for temperature, vehicle speed, air pressure and other pressure readings. Choose between US customary or metric units of measure. To change the units of measurement: 1. -
Page 41: Section 4: Compact Scan Module (Csm)
Compact Scan Module (CSM) Section 4 Introduction Feature Locations This section describes the connection, and basic operation of the Compact Scan Module (CSM). The CSM is a wireless device that is connected directly to the vehicle data link connector (DLC), and wirelessly transmits vehicle data to the diagnostic tool. Main Topic Links Feature Locations page 34... -
Page 42: Led Indicators
Compact Scan Module (CSM) LED Indicators LED Indicators Audible Alerts Light emitting diodes (LEDs) on the CSM indicate communication status. The In addition to onscreen messages, the CSM uses audible tones to alert you of following LED descriptions apply only when the CSM is powered by the vehicle connection status. - Page 43 Compact Scan Module (CSM) Basic Operation To connect the CSM to OBD-I vehicles: The following applies to most OBD-I vehicles. Use the optional DA-6 adapter and the optional OBD-I manufacturer specific adapter. Connection example shown 4-3. Contact your sales representative to purchase adapters. Figure 1.
-
Page 44: Pairing And Hardware Status Icons
Compact Scan Module (CSM) Basic Operation 4.6.2 Pairing and Hardware Status Icons To use the CSM, it must be paired with the diagnostic tool. Pairing is the wireless connection (identification) process used to connect the CSM to your diagnostic tool. Scope Module M4 SCANMODULE7-600022 The CSM only needs to be paired once before its initial use. -
Page 45: Hardware Status Icons
Compact Scan Module (CSM) Basic Operation 3. For additional CSM connection status information, see Hardware Status Icons NOTE on page 38. If a CSM firmware update is available, the CSM will automatically be updated, Hardware Status Icons Firmware Updates on page 39 for additional information. The hardware status indicators (Home screen lower-right corner) provide a quick When pairing is successful the CSM hardware status indicator displays on the reference to connection status... -
Page 46: Firmware Updates
Compact Scan Module (CSM) Firmware Updates Status/Icon Action Paired and Communicating Indicates a USB cable is connected between the CSM and the diagnostic tool, and the CSM is communicating (through the USB cable) with the diagnostic tool. Paired but Not Indicates a USB cable is connected between the CSM and the Communicating diagnostic tool, but the CSM is not communicating with the diagnostic... -
Page 47: Troubleshooting
Compact Scan Module (CSM) Troubleshooting A “Successfully Updated” message displays once the installation process is NOTE complete (Figure 4-11). When performing a firmware update it is recommended to disconnect the CSM from the vehicle (if connected) and use the supplied USB cable to connect the CSM to the diagnostic tool. -
Page 48: Error Messages
Compact Scan Module (CSM) Troubleshooting 4.8.1 Error Messages To recover wireless connectivity: 1. Disconnect the CSM from the vehicle. If the CSM is paired to the diagnostic tool and tries to communicate with the vehicle 2. Navigate to the Home Screen on the diagnostic tool. and the CSM is not connected to the vehicle, a “no communication”... -
Page 49: Technical Specifications
Compact Scan Module (CSM) Technical Specifications Technical Specifications Software Restart Procedure This method, which closes and restarts the ShopStream Diagnostic Suite software, takes about two minutes to complete. Item Description / Specification ® Communications Wireless Bluetooth 2.1 Technology To restart the ShopStream Diagnostic Suite: Operating Range Approx. -
Page 50: Section 5: Scanner
Scanner Section 5 Introduction IMPORTANT SECURE VEHICLE GATEWAY The Scanner function allows your diagnostic tool to communicate with the electronic control modules (ECMs) of the vehicle being To protect against unauthorized vehicle network manipulation that may serviced. This allows you to perform tests, view diagnostic trouble put car systems and customers at risk, many automobile manufacturers require authorized scan tool access to perform necessary diagnosis and codes (DTCs), and live data parameters from various vehicle... -
Page 51: Basic Scanner Operation (Quick Start)
Scanner Basic Operation 5.1.2 Basic Scanner Operation (Quick Start) 7. Select OK to confirm the vehicle. If needed, enter the vehicle VIN, odometer reading and license plate. This section lists the basic scanner operation steps, and is only intended as a 8. - Page 52 Scanner Basic Operation Identifying a vehicle: A list of vehicle types or models will display. Several selections may be required to identify the vehicle type and model, follow the screen prompts and 1. Select Scanner from the Home screen. enter the required information. A list of vehicle manufacturers (makes) will display (Figure 5-1).
-
Page 53: Taking Pictures And Screenshots In Scanner
Scanner, will be associated with that vehicle. A link to the files can be found in that vehicle’s “vehicle record” on the Attachment panel, see Vehicle History page 161. All images and screenshots are also uploaded to the Snap-on Cloud automatically when they are created. See on page 203 for more information The Snap-on® Cloud on using the Snap-on Cloud. -
Page 54: Selecting A Vehicle System
Scanner Basic Operation 5.1.5 Selecting a Vehicle System Selecting a vehicle system: 1. After the vehicle has been identified, the Systems menu will display available vehicle systems. The System menu can be displayed in two views, by individual system categories or by common vehicle system categories. To change the view, select/deselect the Category View checkbox in the upper toolbar. -
Page 55: Selecting A Vehicle System Test/Function
Scanner Basic Operation Clear All Codes Read by Code Scan, see System Tests—provides specific subsystem testing. Performing these tests is • Clear All Codes Read by Code • similar to functional tests. Scan on page 56 Service Resets and Relearns, see •... -
Page 56: Menu Options (Lower Toolbar Icon)
Scanner Menu Options (lower toolbar icon) Menu Options (lower toolbar icon) 2. Continue to select the Back icon until the “stopping communication” message is displayed. The following Menu options are available: 3. Select the Change Vehicle icon (Figure 5-10). File—allows you to print or save the data being viewed. •... -
Page 57: Help
Scanner Codes Menu (Viewing Codes) Changing the Units of Measurement Display BEN The Diagnostic Suite units of measurement can be changed for temperature, Selecting this option displays the Balco Engine Number (BEN) of the currently vehicle speed, air pressure and other pressure readings. Choose between US identified vehicle. -
Page 58: Display Codes (Code List)
Scanner Codes Menu (Viewing Codes) 5.3.1 Display Codes (Code List) 5.3.2 Clear Codes Selecting Display Codes (descriptive name may vary) may directly open a list of NOTE the diagnostic trouble codes (DTCs) found, or it may open a submenu of options (see below). -
Page 59: Code Scan (With Vehicle System Report)
“vehicle record” on the Attachment panel, see Vehicle History on page 161. All Code Scan reports are are also uploaded to the Snap-on Cloud automatically when they are created. See The Snap-on® Cloud on page 203 for more information on using the Snap-on Cloud. - Page 60 Scanner Code Scan (with Vehicle System Report) Quick reference indicators are used to show system code status (Figure 5-19): - Green icon “a” mark - No Codes - Yellow Triangle icon “!” mark - Codes are present Systems Code list with totals - A categorized system list with code totals is •...
- Page 61 Scanner Code Scan (with Vehicle System Report) Diagnose Icon - (Figure 5-22) Selecting Diagnose opens Intelligent • NOTE Diagnostics providing you additional code specific information. See Intelligent on page 64 for detailed information. Diagnostics Some 2005 to 2008 vehicles may not display global OBD-II information in the Code Scan list.
-
Page 62: Saving The Vehicle System Report
Scanner Code Scan (with Vehicle System Report) 5.4.1 Saving the Vehicle System Report If the file was saved (toolbar Save icon) it may also be printed from either the • Vehicle Record attachment, or from the Vehicle System Report Data Folder The code scan can be saved as a Vehicle System Report in PDF file format. -
Page 63: Clear All Codes Read By Code Scan
Scanner Service Resets and Relearns 5.4.5 Clear All Codes Read by Code Scan Selecting Clear All Codes Read by Code Scan erases all codes from all vehicle system modules that were read by Code Scan. NOTE Availability of the Clear All Codes Read by Code Scan function is dependent upon the vehicle. -
Page 64: Data (Viewing Pids)
Scanner Data (Viewing PIDs) Data (Viewing PIDs) Selecting Data displays the data (PID) list for the selected module.The Data display is typically opened from the Vehicle Systems Test/Function menu, see Selecting a on page 48. The descriptive name may vary (e.g. Vehicle System Test/Function Data, Data Display, Data Menu, Data Only, or other similar). -
Page 65: Data Screen Overview
Scanner Data (Viewing PIDs) 5.6.1 Data Screen Overview indicates the current vertical point of the signal. When displayed as a status, it correlates to an operational state (e.g. On/Off, Enabled/Disabled, etc) 4— Menu Icon - Menu options for display and setup Full Screen View - expands the graph to fill the entire screen Setup - opens graph scale and trigger settings Figure 5-33 Typical PID (list view) - Page 66 Scanner Data (Viewing PIDs) Data Display Options List View PIDs can be displayed in different views (Figure 5-36). List View is the default view mode and displays all PIDs in list (text) format (Figure 5-37). Figure 5-37 Split View To view one or more PIDs as a graph (Figure 5-38) from the list view, select the Expand/Collapse icon.
- Page 67 Scanner Data (Viewing PIDs) Multi-Graph View Full Screen Single Graph View To view more than one PID in a multi-graph display (Figure 5-39), select the PID To view a single PID graph in full screen (Figure 5-40), select the PID Expand/ Expand/Collapse icon to open each PID in graph display you want to include, then Collapse icon to open the PID in graph display, then select Graph View from the select Graph View from the toolbar.
- Page 68 Scanner Data (Viewing PIDs) Data Toolbar Custom The Data toolbar contains a number of icons that allow you to configure the Custom is used to set which PIDs are displayed. Minimizing the Custom displayed data and to exit: number of PIDs displayed allows you to focus on specific data and may increase the data transmission rate from the vehicle.
- Page 69 Scanner Data (Viewing PIDs) Keep the following in mind when configuring a custom data list: NOTE Gesture scroll if the list of parameters is longer than what is shown on the – Limiting the number of parameters that display to those that apply to a screen.
- Page 70 Scanner Data (Viewing PIDs) Figure 5-44 3. To view the custom list, select List View or Graph View from the toolbar (Figure 5-45). Figure 5-43 Once you have selected all the PIDs you want to build your custom list, those PID categories that have selections will be highlighted in the main list (Figure 5-44).
- Page 71 Scanner Data (Viewing PIDs) To configure alarm settings: NOTE 1. Select the Alarms icon on the Scanner Toolbar. From the Custom Data list, if you select Back to display the Data Menu list, The Alarm List dialog box will open. your new Custom List shows as a selectable option at the top of the list 2.
- Page 72 Scanner Data (Viewing PIDs) Properties Graph View Properties is used to configure (all) graph color, settings, samples Graph View allows you to display up to 16 graphs (Figure 5-50). To Properties Graph View after trigger, and sweep (Figure view more than one PID in a multi-graph display, select the PID 5-49).
- Page 73 Scanner Data (Viewing PIDs) Save Print Save is used to record PID data. Saved files can be helpful when trying Printing / Printer Setup on page 20. Save Print to isolate an intermittent problem or to verify a repair during a road test. To save PID data: Scale Select Save.
- Page 74 Scanner Data (Viewing PIDs) Icon Description Not Armed (Trigger Arm Control) (Flashing Icon) When this icon is flashing, the triggers are not armed and no data capture will occur. (Select this icon to arm) Armed (Trigger Arm Control) When this icon is continuously displayed, triggers are armed, and ready to capture data.
-
Page 75: Using Triggers
Scanner Data (Viewing PIDs) Icon Description Zoom In/Out Increases/decreases the magnification by decreasing the sweep of the graph. The zoom options on the Data Buffer toolbar allow you to change the magnification level of the sweep when viewing data graphs. Use the Zoom In (+) icon to increase magnification, and the Zoom Out (–) icon to decrease magnification. - Page 76 Scanner Data (Viewing PIDs) To turn a trigger on, and set upper/lower trigger limits: PID Trigger Status Icons 1. Select the Menu icon on the PID you want to set a trigger on. The icons (below) are used to help you quickly identify the status of individual PID 2.
- Page 77 Scanner Data (Viewing PIDs) Upper and lower trigger limit lines (red) are displayed on the graph. NOTE Minimum scale setting must be less than the maximum scale setting: Figure 5-59 Typical - Trigger upper/lower limit lines To use Autoscale or set the scale manually: Autoscale On - The graph scale (vertical axis range) is automatically adjusted based upon the minimum and maximum PID values.
- Page 78 Scanner Data (Viewing PIDs) About Activated Triggers Trigger Arming/Disarming A trigger is activated (displays red flag) when a PID value meets an upper/ Arming - arms all triggers to record data if a trigger is activated. lower limit (trigger point). Disarming - prevents all triggers from activating.
-
Page 79: Functional Tests
Scanner Functional Tests Functional Tests Selecting a Functional Test opens the test. A typical test includes on-screen instructions (Figure 5-63) followed by a test screen (Figure 5-64) that provides a The Functional Tests selection is used to access vehicle-specific subsystem and changeable value or switch that is manually entered or actuated on-screen and a guided component tests. -
Page 80: Functional Resets And Procedures
Scanner Generic Functions Generic Functions Functional test controls allow you to activate/deactivate or change the test signal. The controls will vary depending on the test, a few examples are shown in the Selecting Generic Functions from the Vehicle Systems Test/Function menu opens following table. -
Page 81: Troubleshooter
Scanner Troubleshooter Troubleshooter Troubleshooter is a database of experience-based information that has been compiled by top-notch technicians, and contains basic information on many common diagnostic trouble codes (DTCs). Selecting Troubleshooter from the Vehicle Systems Test/Function menu opens a submenu of options (options may vary). Code Tips—provides detailed information on setting conditions, testing, and •... -
Page 82: Section 6: Intelligent Diagnostics
Intelligent Diagnostics Section 6 Introduction Main Topic Links Accessing Intelligent Diagnostics page 75 • Intelligent Diagnostics provides access to the latest code-specific data, Main Menu and Basic Navigation page 76 information, and tests, all obtained from actual shop repair orders and industry •... -
Page 83: Main Menu And Basic Navigation
Intelligent Diagnostics Main Menu and Basic Navigation Main Menu and Basic Navigation 22 2 Intelligent Diagnostics information modules are contained in one multi-card main 22 3 menu. This allows you to easily select a card (e.g. Technical Bulletins, Smart Data, Real Fixes, etc), view the data and then quickly return to the main menu to open another card. -
Page 84: Code Results Dropdown Menu
Intelligent Diagnostics Code Results Dropdown Menu Intelligent Diagnostics Navigation Basic navigation is accomplished by selecting the desired menu card. Use the Back icon (shown in 6-4) to navigate back to the Figure 6-3 Figure previous screen. To expand a card to full size, select anywhere in the card (Figure 6-3). -
Page 85: Top Repairs Graph
Intelligent Diagnostics Top Repairs Graph Top Repairs Graph Technical Bulletins (OEM Information) The Top Repairs Graph (Figure 6-7) shows the most common verified fixes using The Technical Bulletins card (Figure 6-8) provides a quick link to OEM Recall, TSB the parts listed. and Campaign information that may be available for the selected code. -
Page 86: Smart Data
Intelligent Diagnostics Smart Data Figure 6-11 Selecting the Smart Data List (Figure 6-12) opens the custom code-specific PID list (Figure 6-13). Figure 6-10 TSB example Smart Data Smart Data filters out all non-relevant PIDs and shows you a custom list of PIDs Figure 6-12 only related to the selected code. -
Page 87: About Prearmed Smart Data Pids
Intelligent Diagnostics Functional Tests and Reset Procedures Functional Tests and Reset 6.7.1 About Prearmed Smart Data PIDs Procedures Features and operation of prearmed Smart Data PIDs: Any PID with a flag displayed has been preset and prearmed. • Selecting the Functional Tests and Reset Procedures card (Figure 6-14) opens the A red flag indicates the PID is operating out of range and the trigger has been... -
Page 88: Guided Component Tests (Gcts)
Intelligent Diagnostics Guided Component Tests (GCTs) Guided Component Tests (GCTs) Selecting the Guided Component Tests card (Figure 6-16) opens the Components Tests main menu (Figure 6-17), which displays a menu list of tests related to the troubleshooting of the selected codes. Figure 6-18 Intelligent Diagnostics Guided Component Tests operation and navigation is similar Guided Component Tests are tests with step-by-step instructions... - Page 89 Intelligent Diagnostics Guided Component Tests (GCTs) Figure 6-21 Figure 6-20 For GCT upper toolbar control icon descriptions, see Scope/Meter (Upper) Toolbar on page 107. For Scope/Meter toolbar control descriptions, see Control Panel and Settings page 114. Selecting Component Information (if available) provides details on specific vehicle components to provide a better understanding of the components prior to diagnosis.
-
Page 90: Real Fixes
Intelligent Diagnostics Real Fixes 6.10 Real Fixes 6.11 Troubleshooter Select the Real Fixes card (Figure 6-22) to view a list (Figure 6-23) of code-specific Select the Troubleshooter card (Figure 6-25) to view a list (Figure 6-26) of code- procedures and tests that have been gathered from actual shop repair orders. specific tips gathered from industry professionals. -
Page 91: Section 7: Obd Direct
OBD Direct Section 7 Introduction Main Menu Selecting OBD Direct from the Home screen opens a menu with two options This section describes the basic operation, and navigation of the (Figure 7-1): OBD Direct function. OBD Diagnose - provides access to available OBD vehicle readiness •... - Page 92 OBD Direct OBD Diagnose The communication protocol being used Readiness Monitors – Which ECM is actively communicating – Selecting Readiness Monitors provides the following menu options: Vehicle Identification Number (VIN) – Monitors Complete Since DTC Cleared—displays the results of all monitor •...
- Page 93 OBD Direct OBD Diagnose OBD-II Modes Table 7-1 Name Description OBD-II Modes include emission related data and tests supported by the vehicle ($09) manufacturer. Vehicle manufacturers are not required to support all modes. In-use Displays the “In-use Performance Tracking” of monitored data (total Performance number of times each monitored test has completed).
-
Page 94: Connector Information
OBD Direct OBD Health Check OBD Health Check 7.2.2 Connector Information Selecting Connector Information provides you access to vehicle data link connector The OBD Health Check option is intended as a time-saver, allowing you to quickly (DLC) location information. access a few key global OBD-II services. The OBD Health Check menu (Figure 7-5) options include the following... -
Page 95: Global Obd Ii Clear Codes
OBD Direct OBD Health Check Pending Codes Pending Codes enables the scan tool to obtain “pending” or maturing diagnostic trouble codes. These are codes whose setting conditions were met during the last drive cycle, but need to be met on two or more consecutive drive cycles before the DTC actually sets. -
Page 96: Section 8: Guided Component Tests
Guided Component Tests Section 8 Introduction Safety Information Selecting Guided Component Tests provides you with an extensive WARN ING collection of vehicle specific component tests and reference information for engine, transmission, ABS, charging, transfer case, Risk of electrical shock. and suspension systems. It is like having access to a complete •... -
Page 97: General Information
Guided Component Tests General Information General Information 8.2.1 Configuring the Favorites List Once a Guided Component Test database is loaded, a list of manufacturers displays. This list is often long and includes makes that are not frequently used. A toolbar at the top of the screen allows you to custom configure the manufacturer list to display only the makes you frequently service. -
Page 98: Menu Icon
Here is a sample listing of the types and specific tests that may be available within Power User Tests: Current Probe Tests - provides common tests configured to use the Snap-on • Low Amp Current probes or generic Low Amp Current probes. Snap-on Low Amp Current Probe operation information is also provided within the Snap-on Low Amp Probe Reference Manual option. - Page 99 • Open and Closed Loop • Conventional • Oxygen Sensor Types • Distributorless • Understanding Oxygen Sensors (includes configured meter test) Snap-on Automotive Theory— provides basic theory information on multiple • topics including: • Air Conditioning • Diagnosing Battery Draws...
- Page 100 20-minute Current Ramp Classes—provides an introduction to current ramp • testing using the Snap-on Low Amp Current Probes. Snap-on Low Amp Current Probe operation information is also provided within the Snap-on Low Amp Probe Reference Manual option. Topics may include: •...
-
Page 101: Vehicle Identification
Guided Component Tests Vehicle Identification Vehicle Identification Component Information Guided Component Test information is vehicle specific, therefore a vehicle must be Component Information provides specific operational information (if available) on identified first. the selected component, and may also include electrical connector and pin location and function details Identifying a vehicle: The Component Information screen... -
Page 102: Tests
Guided Component Tests Tests Tests 8.5.1 View Meter View Meter opens a live meter set up to perform the test in the lower portion of the Tests provide specific instructions (if available) to help you perform tests on screen (Figure 8-7). -
Page 103: Performing A Test
Guided Component Tests Tests Figure 8-8 Sample meter view in a separate window Selecting the Close icon (X) when viewing the meter in a separate window closes the meter and returns you to the Guided Component Test screen. 3. Select the Meter icon a third time to close the separate window and return to the standard meter view as shown in Figure 8-7. -
Page 104: Section 9: Scope And Multimeter Operations
Scope and Multimeter Operations Section 9 Introduction Triggers page 122 • Trigger Setup Menu page 109 • Safety page 97 This section describes the basic operation and navigation of the • Scope Multimeter function. Setup Menu (Preferences) page 108 • Scope/Meter (Upper) Toolbar page 107 •... -
Page 105: Measurement Out Of Range Indicator
Scope and Multimeter Operations Technical Specifications (Scope Module) Technical Specifications 9.2.1 Measurement Out of Range Indicator (Scope Module) A group of arrows display when a measurement is out of range for the scale selected: Arrows pointing UP—measurement over maximum range Item Description / Specification •... -
Page 106: Tests And Capabilities (Quick Reference)
Scope and Multimeter Operations Technical Specifications (Scope Module) Component Locations Testing Capabilities The following sections provide a general overview of the testing capabilities of the Scope Multimeter (select topic to link to section): Digital Multimeter (DMM) • Graphing Multimeter (GMM) •... - Page 107 Scope and Multimeter Operations Technical Specifications (Scope Module) Test Function Test Function Measures electrical resistance (opposition to current) 0 Used to measure pressures for typical systems such as, to 4 M Ohms. Scope supplied DC current is passed 100 PSI Pressure fuel, oil, EVAP, hydraulic/transmission fluid etc.
-
Page 108: Digital Multimeter (Dmm)
Scope and Multimeter Operations Technical Specifications (Scope Module) 9.5.2 Digital Multimeter (DMM) 9.5.3 Graphing Multimeter (GMM) The digital multimeter gives you the ability to quickly make precise common Unlike the DMM, the graphing multimeter plots a visual graphing line of the signal electrical measurements (e.g. -
Page 109: Lab Scope
Scope and Multimeter Operations Technical Specifications (Scope Module) GMM Specifications use of triggers and channel controls. All of these features allow you to analyze signals in great detail when performing diagnostics. Function Range Accuracy/Comments To use the lab scope, select the Scope Multimeter icon from the home screen then Ch. -
Page 110: Getting Started
Scope and Multimeter Operations Getting Started Getting Started 9.6.2 Test Lead / Probe Connection Standard “safety type” test lead jacks are located on the top of the diagnostic tool, 9.6.1 Selecting a Function and are compatible with many test leads and probes. Insert the applicable test lead or probe terminal end into the jack to compete the connection. -
Page 111: Using The Scope Module Extension Cable
Scope and Multimeter Operations Getting Started 9.6.3 Using the Scope Module Extension Cable To setup the Scope Module for remote operation: 1. Depress the Scope Module release tab located on the top of the diagnostic tool In situations where the testing connection points are not easily accessible, the (Figure 9-4). -
Page 112: Pairing And Hardware Status Icons
Scope and Multimeter Operations Getting Started 9.6.4 Pairing and Hardware Status Icons Hardware Status Icons The hardware status indicators in the lower-right corner of the Home screen provide When the Scope Module is connected (docked or USB cable), it automatically pairs a quick reference to connection status. -
Page 113: Test Lead / Probe Calibration
Scope and Multimeter Operations Getting Started 9.6.5 Test Lead / Probe Calibration Certain tests may display a confirmation prompt asking “Do you wish to calibrate this probe?” before continuing with the test. As general practice, it is important to ensure the test probe is calibrated before testing, to ensure accurate results. Typical resistance, pressure, and vacuum tests will display the calibration message, reminding you to calibrate the probe. -
Page 114: Main Screen And Toolbars
Scope and Multimeter Operations Main Screen and Toolbars Main Screen and Toolbars Name Icon Description Switches the display between three states. The scope/meter screens typically include the following sections (Figure 9-10): Data Data Display Modes on page 114 Cursors Cursors Cursors on page 125 Clears the minimum, maximum and live... -
Page 115: Main Body Of The Screen
Scope and Multimeter Operations Setup Menu (Preferences) 9.7.2 Main Body of the Screen The main body of the screen varies depending on what display options have been selected. Up to four traces, along with digital readouts of current signal values, signal status and triggering conditions, can be displayed simultaneously on the main body of the screen. -
Page 116: Trigger Setup Menu
Scope and Multimeter Operations Setup Menu (Preferences) 9.8.2 Trigger Setup Menu The following options are available from the Display dialog box: Show RPM—adds an engine speed field at the top of the screen (Figure • 9-13). Triggers on page 122.‘ 9.8.3 View Controls Use the view controls to set display attributes. - Page 117 Scope and Multimeter Operations Setup Menu (Preferences) Show Grid—switches grid lines on the screen off and on (Figure • 9-15). Figure 9-17 Sample 2 Windows vertical display Figure 9-15 Sample grid selected Invert Colors—switches the screen background to white. • Layout Settings The selected radio knob on the Layout dialog box shows which setting is active.
- Page 118 Scope and Multimeter Operations Setup Menu (Preferences) Trace Full Scale - changes the dropdown vertical scale menu selections to full scale Unit Setup mode, which represents the selected unit of measurement over the entire (full) The Unit Setup dialog box allows you to switch between Full Scale or Per Division scale.
- Page 119 Scope and Multimeter Operations Setup Menu (Preferences) Trace Per Division - changes the dropdown vertical scale menu selections to ##/div mode, which in turn changes the vertical scale to represent ## by division. ## - represents (variable) what is being measured (voltage, amperage, pressure etc.) Example (Figure...
-
Page 120: Setup Controls
Scope and Multimeter Operations Setup Menu (Preferences) 9.8.4 Setup Controls Abbreviation Description Basic tool settings are adjusted here. To adjust setup controls: inHg inches of mercury 1. Select Setup from the Scope Multimeter toolbar. kg/cm2 kilograms per centimeter squared The Scope Multimeter Preferences dialog box opens kilopascal 2. -
Page 121: Control Panel And Settings
Scope and Multimeter Operations Control Panel and Settings Control Panel and Settings Normal —control setting icons are displayed (e.g. Profile, Channel, Probe, • Filter, Scale, etc) (Figure 9-26) This section provides a general overview of all the trace setting control features used across all Scope Multimeter functions. -
Page 122: Control Panel (Trace Controls Quick Reference)
Scope and Multimeter Operations Control Panel and Settings 9.9.2 Control Panel (Trace Controls Quick Reference) Control Panel Off— the control panel is not displayed, only the meter screen • is shown (Figure 9-28) Trace (channel) settings and controls can be accessed in the Control Panel and the Trace Setup menu. -
Page 123: Profile Icon
Scope and Multimeter Operations Control Panel and Settings 9.9.4 Channel Icon The Channel icons (variable) identify the channel numbers (1 to 4). Selecting an icon opens the trace setup menu. See Trace Controls Menu on page 108. Channel Icon (Typical) 9.9.5 Probe Icon The Probe icons (variable) allows you to change the type of probe for the test you are performing. -
Page 124: Peak Detect Icon
Scope and Multimeter Operations Control Panel and Settings NOTES — Turning peak detect “off” is suitable for basic measurements, and viewing Probe “test” Options waveforms (e.g. oxygen (O2) or Cam sensor) when capturing fast events is Menu Option Probe / Device Used not necessary. -
Page 125: Filter Icon
Scope and Multimeter Operations Control Panel and Settings 9.9.7 Filter Icon 9.9.8 Invert Icon Depending on which function it is used with, Filter can minimize or smooth Invert is used to switch signal polarity, so the trace appears upside down out signal spikes and fast variations, when the signal is disrupted by noise (inverted) on the screen. -
Page 126: Slope (Trigger) Icon
Scope and Multimeter Operations Control Panel and Settings 9.9.10 Slope (Trigger) Icon Example: Selecting 50 psi displays a 50 psi scale that is divided by 10, therefore each division is incremented by 5 psi. on page 124 for additional information. Trigger Operation 9.9.11 Scale (Vertical / Y-axis) The vertical scale (Y-axis) represents what is being measured (voltage, amperage,... -
Page 127: Min, Live And Max Display Panel
Scope and Multimeter Operations Control Panel and Settings Example: Selecting 50ms, changes the sweep scale to a 50ms scale. The scale is “always” divided by 10, therefore each division is incremented by 5ms. Figure 9-35 9.9.14 Zero Baseline Adjustment To adjust the vertical position of the zero baseline (0 value) of a trace, either touch Figure 9-34 and drag the baseline marker up/down on the screen (Figure... -
Page 128: Threshold Auto/Manual (Gmm Only)
Scope and Multimeter Operations Control Panel and Settings 9.9.15 Threshold Auto/Manual (GMM Only) The following examples are provided, showing some common setup issues you may experience when using this function NOTE If after enabling the Threshold function the signal is displayed as a flat line at zero (0) (Figure 9-38), reduce the vertical scale setting, as it may be set too high. -
Page 129: Triggers
Scope and Multimeter Operations Triggers 9.10 Triggers In some instances a signal with unequal spacing may display as a band or ragged signal, depending on the sweep setup or the measurement type being displayed. Triggers are only available in the lab scope function. As example, a Cam sensor signal Hz graph (shown in 9-40) may look like Figure... -
Page 130: Trigger Setup Menu
Scope and Multimeter Operations Triggers 9.10.1 Trigger Setup Menu Trigger Auto/Manual To access the trigger setup menu: NOTE Select the Trigger Setup Menu icon from the control panel, or • The Auto and Manual Trigger modes allow you to set the criteria used to from the upper toolbar select Setup >... -
Page 131: Trigger Operation
Scope and Multimeter Operations Triggers 9.10.2 Trigger Operation Setting Trigger Position To set trigger position: Trigger Slope Icons The trigger marker is indicated by a plus graphic (+) on the display (Figure 9-43). Trigger slope icons are displayed in the control panel. The trigger marker represents the trigger point and is displayed on the screen when the trigger is turned on. -
Page 132: Cursors
Scope and Multimeter Operations Triggers 9.10.3 Cursors To turn the cursors on/off: 1. Select Cursors (upper toolbar to open the Cursors dialog box (Figure 9-45). Cursors are only available in Lab Scope and Graphing 2. To turn the Cursors on/off, select Show or Hide icon as applicable. Cursors Multimeter functions. -
Page 133: Capturing Data
Scope and Multimeter Operations Capturing Data 9.11 Capturing Data Frequency - frequency of the signal for the time period between cursor 1 and 2 • The cursor measurements panel contains values for each channel in two displays The primary purpose and advantage of the Lab Scope and Graphing Multimeter, is (Figure 9-44). -
Page 134: Capturing Data (Capture Mode)
Scope and Multimeter Operations Capturing Data 9.11.2 Capturing Data (Capture Mode) instance, but when using longer sweep settings, it can help increase the capture time by allowing you to capture more than you could without it and still capture Whenever you open Lab Scope or the Graphing Multimeter, the device is in dropouts and points of interest. -
Page 135: Reviewing Data And Using Zoom (Review Mode)
Scope and Multimeter Operations Capturing Data 9.11.4 Reviewing Data and Using Zoom (Review Mode) Name Icon Description Review Mode allows you to search through the captured data in detail to find events Start (Capture) Resumes data capture of interest, such as glitches and signal losses. Press the Pause icon (Figure 9-47) to open Review Mode. - Page 136 Scope and Multimeter Operations Capturing Data Using Zoom The active zoom options (1X to 256X) that are selectable are dependent on the amount of data stored in the buffer. Less data captured = less zoom options. The zoom function is only available in Review Mode, and can be an invaluable tool More data captured = more zoom options.
- Page 137 Scope and Multimeter Operations Capturing Data Zoom Example While monitoring a MAF (Mass Air Flow Sensor) signal, the waveform displays normally. As the signal is being monitored, an erratic “condition” suddenly develops, then goes away, but may have not been observed on the screen. Stopping the data capture (when such an event occurs) allows you to analyze the waveform using a higher zoom level (wider view) to look for a glitch in the signal.
-
Page 138: Taking A Data Snapshot
Scope and Multimeter Operations Taking a Data Snapshot 3 - Zoom back in (this example is at 2X) to view more detail (Figure 9-54) in the area where the cursor was placed by the glitch. Figure 9-54 Figure 9-55 9.12 Taking a Data Snapshot 9.13 Saving Data An automated method of capturing data is to take a Snapshot. -
Page 139: Ignition Scope
Scope and Multimeter Operations Ignition Scope 9.14 Ignition Scope 9.14.1 Ignition Scope Setup To display secondary ignition waveforms the Lab Scope must be properly configured to the type of ignition system you are testing, and for the type of display pattern you wish to view. - Page 140 Scope and Multimeter Operations Ignition Scope 5. From the Preferences menu select Setup (Figure Standard 9-58). Standard is used for ignition systems with a distributor (Figure 9-60). 1. Enter the Number of Cylinders. 2. Select the Firing Order. 3. Select Plug for Number 1 Trigger setting. Setup Notes: Selecting Coil (for Number 1 Trigger setting) should only be used to supply –...
- Page 141 Scope and Multimeter Operations Ignition Scope Waste Spark Direct Ignition Waste Spark is used for coil pack systems that fire two plugs simultaneously. Direct is used for coil-on-plug systems. 1. Enter the Number of Cylinders. 1. Enter the Number of Cylinders. 2.
- Page 142 Scope and Multimeter Operations Ignition Scope Other Traces (Ignition Scope Trace Setup) Other is used for ignition systems that do not fit any of the other categories (e.g Trace Setup (Figure 9-64) allows you to: rotary engine). Change the KV scale –...
- Page 143 Scope and Multimeter Operations Ignition Scope Sweep (Ignition Scope Sweep Setup) Sweep Setup (Figure 9-66) allows you to change the ignition test mode, or change to a time based sweep setting (e.g. 2 ms, 50 ms, 5s). Two variations of each ignition test mode (5 and 10ms) are offered (e.g. Raster 5 ms and Raster 10 ms).
- Page 144 Scope and Multimeter Operations Ignition Scope Trigger (Ignition Scope) Trigger Setup (Figure 9-67) allows you to: Change the triggered cylinder (Single Cylinder Mode only) – Adjust the detection sensitivity to cylinder firings – About Detection Sensitivity The sensitivity adjustment is primarily used to fine tune the ignition signal into a viewable pattern.
- Page 145 Scope and Multimeter Operations Ignition Scope Secondary Ignition Adapter Leads Secondary Ignition Clip-on Adapter The optional clip-on adapter clips over a secondary ignition wire to pick up a signal. To display secondary ignition waveforms, optional secondary ignition coil The Clip-on adapters RCA connector is connected to the secondary ignition adapter(s) and a coil adapter lead assembly are required.
- Page 146 Scope and Multimeter Operations Ignition Scope Secondary COP/CIP Ignition Adapters Distributorless Ignition System Adapter (SIA 2000) Vehicle specific and universal secondary ignition adapters are available as optional The primary use for the optional SIA 2000 Adapter Kit is to connect to multiple equipment.
- Page 147 Scope and Multimeter Operations Ignition Scope To open the Digital kV View, select Setup from the upper toolbar, then from the Digital kV / Multiple Spark Ignition Systems menu select View > Display > Show Digital kV. (Figure 9-73). On vehicles with multiple spark ignition systems, when more than one spark per cylinder is present, Firing kV (FKV) is calculated at the start of the first spark and Spark kV (SKV) and Burn are calculated from the last spark.
-
Page 148: Ignition Waveform Reference
Scope and Multimeter Operations Ignition Scope 9.14.2 Ignition Waveform Reference The Ignition Cycle Waveforms have specific points that show important information when checking an The following ignition waveform information is intended as general theory reference ignition system. A complete ignition cycle of a cylinder runs from primary current only, using distributor type ignition illustration examples. - Page 149 Scope and Multimeter Operations Ignition Scope Start of Ignition Current Limiting (1) - High voltage is induced, by mutual induction, into the secondary (8) - This represents the dwell period or “on-time” of the ignition coil Figure 9-74 Figure 9-74 winding because of the primary to secondary turns ratio.
-
Page 150: Presets
Scope and Multimeter Operations Presets 9.15 Presets IMPORTANT Selecting Presets opens a menu of pre-configured tests (Figure 9-76). Presets are Avoid damaging test leads, do not pull on the wire when removing the tests set up with pre-configured control settings for common component tests. leads from their jacks. -
Page 151: Channel 3 Lead
Scope and Multimeter Operations Test Leads and Accessories 9.16.3 Channel 3 Lead 9.16.6 Low Amp Current Probe (optional) The Low Amp Current Probe is used to measure AC or DC current up to 60A. This probe includes two scales (0 to 20A) and (0 to 60A) that can be used to provide accurate and reliable non-intrusive current measurement for components such as, ignition coils, fuel injectors, fuel pumps, relays, and electric motors. -
Page 152: Pressure Transducers And Adapters (Optional)
Scope and Multimeter Operations General Reference (Testing Strategies) 9.16.8 Pressure Transducers and Adapters (optional) Different pressure transducers and adapters are available for measuring positive and negative gas and liquid pressures. Depending on the adapter, measurement capabilities range from 1 to 5000 psi and up to 29 inHg. Measurement and application capabilities vary per device. -
Page 153: Using Known Good Waveforms
If the signal goes beyond the top and bottom of the display, try and readjust the • build your own library of waveforms for future troubleshooting. vertical scale to a higher setting, to bring the signal into the viewable display Use the Snap-on Diagnostics forums to find examples and ask questions also: area. http://http://productforum.autorepairdata.com... -
Page 154: Troubleshooting Signals
Use the shortest test leads possible. • (c) centi 0.01 or 10 or 1/100 Try different test leads, to verify the issue. Use the recommended snap-on leads • (k) kilo or 1,000 or probes available for the diagnostic tool or equivalent. Shielded test leads are... - Page 155 Scope and Multimeter Operations General Reference (Testing Strategies) Electrical Units Pressure Conversions (Symbol) / Description Equivalents bar x 14.5030 = psi (kΩ) kiloohm 1 kΩ = 1000 Ω bar x 100.0000 = kPa (MΩ) megaohm 1 MΩ = 1,000,000 Ω bar x 29.5300 = inHg (60°F) Amperes kPa x 0.1450 = psi...
-
Page 156: Glossary Of Common Terms
Scope and Multimeter Operations General Reference (Testing Strategies) Duty % to Dwell Conversions Term / Abbreviation Description Used to measure a signals on time in degrees of Duty Cycle Dwell dwell. Commonly used to measure mixture Dwell 4 cyl 6 cyl 8 cyl control solenoids on carbureted feedback 45.0... - Page 157 Scope and Multimeter Operations General Reference (Testing Strategies) Term / Abbreviation Description Term / Abbreviation Description Electronic device that converts pressures The threshold function automatically sets a Pressure Transducer (negative/positive) to electrical signals. trigger and determines a threshold level in the Threshold middle of the signal range (calculated from the A signal with abrupt (fast) signal direction...
-
Page 158: Section 10: Quick Lookups
Oil Specs and Resets provides up-to-date OEM information on your diagnostic tool, There are two methods to access this function: via wireless network connection with our Snap-on Information Service. This feature From the Home screen - select the Quick Lookups icon, then select the Oil •... - Page 159 Quick Lookups Main Topic Links Figure 10-3 10.1.2 Reset Procedure Figure 10-2 Scanner System Menu - Oil Specs and Resets Option Selecting Reset Procedure displays OEM oil service reset instructions. Typical 1. Follow the screen prompts to select vehicle attributes (e.g. Manufacturer, Year, information may include: Model etc.).
-
Page 160: Tsbs (Technical Service Bulletins)
Quick Lookups TSBs (Technical Service Bulletins) 10.1.3 Functional Reset Selecting Functional Reset opens the service interval reset menu (within the Scanner function) for the selected vehicle, and includes functional resets for the oil service indicator and other supported resets. IMPORTANT Instructions may be provided, which are required to be performed before selecting or completing the Reset function itself. - Page 161 Quick Lookups TSBs (Technical Service Bulletins) 2. Select the Quick Lookups icon from the Home screen (Figure 10-7). NOTES — TSBs coverage includes domestic and import cars, light trucks, and vans. Coverage is limited to vehicles sold through dealerships only in the United States.
- Page 162 Quick Lookups TSBs (Technical Service Bulletins) Using the TSBs function: When a category is selected, the results (links) are displayed (Figure 10-10). A description, publish date and OEM reference number are provided for Available information (e.g. Technical Service Bulletins and recalls) is displayed reference.
-
Page 163: Tire And Wheel Service
Tire and Wheel Service provides OEM information on your diagnostic tool, via Figure 10-11 Typical - TSBs display window wireless network connection with our Snap-on Information Service. This feature allows you quick access to the following information: Selecting the Print icon opens the print preview screen (Figure 10-11). -
Page 164: Operation
Quick Lookups Tire and Wheel Service From within a current Scanner session - select Tire and Wheel Service (or • NOTES applicable choice) from the System menu (Figure 10-14), then proceed to Step 3 below. — Tire and Wheel Service vehicle coverage is the same as the Scanner vehicle coverage. - Page 165 Quick Lookups Tire and Wheel Service Tire and Wheel Service Toolbar Icons TPMS Indicator Reset The following provides a brief description of the related Tire and Wheel Service Selecting the TPMS Indicator Reset icon displays TPMS indicator toolbar icon functions. Detailed descriptions are provided in the following sections. reset instructions.
- Page 166 Quick Lookups Tire and Wheel Service TPMS Remove & Repair (TPMS Service) Tire/Wheel Specifications (Fitment) Selecting the Remove & Repair (TPMS Service) icon displays TPMS Selecting Tire/Wheel Specifications displays OEM tire and wheel service information. Typical information may include: specifications (Figure 10-17).
- Page 167 Quick Lookups Tire and Wheel Service Scanner Functions Selecting the Scanner Function icon opens the TPMS Scanner test menu for the selected vehicle. Options may include: View and Clear Codes • View Data • Perform TPMS Related Functional Tests/Resets • View TPMS Troubleshooter Information •...
-
Page 168: Section 11: Vehicle History
Vehicle History Section 11 Introduction 11.1 Vehicle Records List The Vehicle Records List screen (Figure 11-1) lists all of the available vehicle Selecting Vehicle History allows you to manage and retrieve records. vehicle records, for vehicles that have been previously identified. You can also reactivate a vehicle, eliminating the need identify a vehicle again when performing a retest after repairs have been made. -
Page 169: Toolbar Icon Functions
Vehicle History Toolbar Icon Functions 11.2.1 Activate To resize a column: 1. Select the line separating two columns. Select Activate to activate a vehicle for use in other functions (e.g. Scanner, A line with arrowheads appears to show the column is ready for resizing. Guided Component Tests, etc.). -
Page 170: Delete
Double-click on the file to open it. 3. Select Back to return to the vehicle records list screen. All of these attachments are also uploaded to the Snap-on Cloud automatically when they are created. See The Snap-on® Cloud on page 203 for more information on using the Snap-on Cloud. -
Page 171: Search And Show All
Vehicle History Toolbar Icon Functions 11.2.4 Manage 11.2.6 Settings Select Manage to quickly remove individual records, or all the vehicle records from Use Settings to determine which categories display on the vehicle records list. the vehicle records list. Highlight the record to remove, then select Delete, or use To change vehicle record list settings: the Select All or Deselect All options to remove all records (Figure... -
Page 172: Section 12: Data Manager
Data Manager Section 12 Introduction 12.1 Data Manager Screen Layout Selecting Data Manager opens the Data Manager screen displaying available file This section describes the basic operation, and navigation of the folders and a file viewer. This screen displays the contents of the Windows Data Manager function. -
Page 173: General Information
Data Manager General Information The folders panel may includes these folders: Vehicle System Report (Code Scan Report) - to view code scan reports saved while using the Scanner function, see Vehicle System Report Viewer on page 168. Camera Folder—contains photos taken with the built-in camera. See •... -
Page 174: Toolbar Icon Functions
Data Manager Toolbar Icon Functions 12.3 Toolbar Icon Functions 12.3.1 Email Selecting the Email icon from the Data Manager toolbar allows you to send a saved The table below describes the toolbar icons. . data or image file as an attachment using e-mail. To use this feature, you must Table 12-1 Data Manager toolbar icons install an e-mail client, and then either link your existing e-mail address to the client, Icon... -
Page 175: Vehicle System Report Viewer
Data Manager Vehicle System Report Viewer 12.4 Vehicle System Report Viewer 3. A new e-mail message window will display onscreen (Figure 12-4). Code Scan (trouble code reports) are saved in .pdf format and are viewable by opening them from the Vehicle System Report Data Folder in the Data Manager my_email my_email folder panel, or from within the Vehicle System Report Data folder in the Windows My... -
Page 176: Image Viewer
Data Manager Image Viewer 12.5 Image Viewer 12.6 Scanner DataViewer Screenshots and photos taken using the built-in camera are saved in .jpg format Scanner data files are saved in a proprietary file format and are viewable by and are viewable by opening them from the Screenshots and Images folders in the opening them from the Scanner Data Folder in the Data Manager folder panel, or Data Manager folder panel, or from within the Windows My Documents >... -
Page 177: Menu Bar
Data Manager Scanner DataViewer 12.6.1 Menu Bar 3. Once all selections are made, select OK. A print dialog box opens. The menu bar at the top of the screen contains the File, View, Tools, and Help a. If Print was selected, the file is sent to the printer. menus. - Page 178 Data Manager Scanner DataViewer View Menu Properties dialog box selections include: Grid Lines—when selected, a line displays at each major division of the • The View menu allows you to change how data is displayed on the screen graphs. (Figure 12-10).
-
Page 179: Display Toolbar
Data Manager Scanner DataViewer 12.6.2 Display Toolbar 12.6.3 Navigation Tools The Display toolbar provides the following controls (Figure 12-12). Playback Controls Exit—closes Scanner DataViewer. • Hide PID List—toggles display between parameter text and graph views. The playback controls allow you to navigate through saved data (Figure •... -
Page 180: Customizing The Display
Data Manager Scanner DataViewer 12.6.4 Customizing the Display Slider / Scroll Bars and Cursor Use the slider bar to quickly navigate through the data (Figure 12-15). During The parameter text list (left side) displays parameter names and current values. playback the number displayed on the left side of the slider bar indicates the current The display can be customized by selecting and dragging parameters from the text position of the cursor in the data file. - Page 181 Data Manager Scanner DataViewer 12.6.5 Customizing the Parameter List The parameter configuration tabs allow you to choose between displaying all available parameters (Complete List), or only those from a (Custom List) (Figure 12-17). To customize the parameter list: 1. Select the Custom List tab (Figure 12-17).
- Page 182 Data Manager Scanner DataViewer 12.7 Scope File Viewer 12.8 ShopStream Connect™ (Alternative Viewer) Scope data files are saved in a proprietary file format and are viewable by opening them from the Scope Multimeter and CTM (component test meter) Data Folders in Saved data files are intended to be viewed using the built-in proprietary viewers the Data Manager folder panel, or from the Windows My Documents >...
-
Page 183: Section 13: Training And Support
13.1 Additional HELP Resources The following resources are also available help you, if you need additional Selecting Training and Support from the Home screen opens the assistance: Snap-on Diagnostics website (Figure 13-1). 13.1.1 Phone - Technical Assistance From this web page you can view or download your diagnostic tool user manual and other related support information. -
Page 184: Website - Product Forums
Training and Support Additional HELP Resources 13.1.6 Website - Product Forums Join The Discussion on the Snap-on Diagnostic Forums - Visit our Forums to communicate with other users to find answers and ask questions about our diagnostic products. https://www1.snapon.com/diagnostics/us/CC/ProductForums.htm (link also available on the Product Support, Product Training and Quick Tips pages) 13.1.7 Online Contact Form... -
Page 185: Section 14: System Settings
Selecting Get Connected displays the required account setup information This section describes the basic operations of System Settings. (Figure 14-1) needed to create a Snap-on Cloud account. Selecting System Settings from the Home screen opens a menu For detailed account setup information see,... -
Page 186: Paired Devices
System Settings Paired Devices 14.2 Paired Devices 14.3 Shop Information Selecting Paired Devices displays the active devices that are paired to the Selecting Shop Information allows you to add personalized shop information that diagnostic tool. To use the Compact Scan Module, and the Scope Module with the can be included on printed data files. -
Page 187: Data Backup
System Settings Data Backup 14.4 Data Backup To Backup data files: 1. From the Home screen select System Settings. Selecting Data Backup from the Systems Settings main menu provides the 2. From the System Settings main menu select Data Backup > Backup. following menu options: The destination drive dialog box opens (Figure... -
Page 188: Restore
System Settings Code Scan (Timestamp) 14.5 Code Scan (Timestamp) 14.4.3 Restore The Restore option is used to restore your backed up data, in the event that the Selecting Code Scan from the Systems Settings main menu allows you to data is lost or if a system restore (recovery) has been performed. hide/show the timestamp (time of day) on the Vehicle System Report. -
Page 189: Section 15: Suretrack® & Repair Information
• Sure Track Community. • NOTE SureTrack is an optional Snap-on Information Service, see Information Services on page 5. To use SureTrack you must have the current software version installed on the diagnostic tool, and have a Wi-Fi Internet connection. -
Page 190: 1Search™ Limited
SureTrack® & Repair Information SureTrack Screens 15.4 SureTrack Screens 15.3.1 1Search™ Limited The 1Search Limited module includes the following information features: 15.4.1 SureTrack Home Page Real Fixes and Troubleshooter - real-world fixes and repair tips captured • from actual repair orders and the experiences of professional technicians. The SureTrack Home page (resides within ShopKey Pro) includes: Common Repair Procedures Graph - graphical display of the specific parts •... -
Page 191: 1Search Limited Top 10 Results Page
SureTrack® & Repair Information SureTrack Screens 15.4.2 1Search Limited Top 10 Results Page 15.4.3 Results Index Page Selecting 1Search Limited displays a Top 10 results page which includes: The Results Index page includes: OEM Plus Results - provides results that best match the exact search criteria, •... -
Page 192: Suretrack Results Page
SureTrack® & Repair Information SureTrack Screens 15.4.4 SureTrack Results Page 15.4.5 ProView Results Page Selecting an item from the Results Index page displays applicable repair Selecting the ProView tab from the SureTrack results page opens ProView. information on the SureTrack results page. ProView provides graphical displays showing the direct relationship between a code or symptom to the component used to fix them. -
Page 193: Getting Started And Logging In
SureTrack® & Repair Information Getting Started and Logging In 15.5 Getting Started and Logging In SureTrack is still active, but I have purchased a software upgrade and have a • new SureTrack authorization code - Logging In with New Authorization Code (active account) on page 187. -
Page 194: Logging In With New Authorization Code (Active Account)
SureTrack® & Repair Information Getting Started and Logging In 15.5.2 Logging In with New Authorization Code (active 3. Log in to the Profile Manger (Figure 15-9) using your current username and password. account) 4. Enter your new Authorization code (Figure 15-9). -
Page 195: Logging In With New Authorization Code (Expired Account)
2. Scroll down and select the link shown in (Figure 15-10) 4. Scroll to the topic “Where do I apply my new Authorization Key from Snap-on?” 5. Select the link “click here to log into the profile manager login window directly”. URL - https://profilemanager.mitchell1.com/technicianprofile/index –... -
Page 196: Linking To An Active Shopkey Pro Or Pro Demand Account
Have a current SureTrack Authorization Code, see • Finding your SureTrack Figure 15-14 Authorization Code on page 192. Have a Wi-Fi Internet connection. • Have the current software version installed on the diagnostic tool. See your • Snap-on Representative for information. - Page 197 SureTrack® & Repair Information Creating a SureTrack Account Enter all required information. Username Email Address* Password First Name* Last Name* Phone Number Forgot password? Click here to reset. Address Line 2 Remember username & password City* State* Zipcode Username* Login Password* Retype Password*...
- Page 198 SureTrack® & Repair Information Creating a SureTrack Account LOGIN Open www.shopkeypro.com and login Username Password ShopKey5.com Users: Forgot password? Click here to reset. Click the “Login” button above and enter your ShopKey5 access ShopKey Pro Don’t know your username and password? Remember username &...
-
Page 199: Finding Your Suretrack Authorization Code
As a reminder to keep your software current and retain your access to SureTrack, software upgrade reminder messages will display periodically on the diagnostic tool When you purchase a software upgrade, or qualifying platform from your Snap-on when new software upgrades are available (Figure 15-23). -
Page 200: Introduction To Shopkey Pro
This section describes ShopKey Pro and some of it’s features. For Here are a few features that ShopKey Pro has to offer: more information, contact your Snap-on representative, or visit the following web ShopKey Pro Modules: pages: 1Search™... -
Page 201: Shopkey Pro Faq's
SureTrack® & Repair Information Shopkey Pro FAQ’s 15.13 Shopkey Pro FAQ’s More ShopKey Pro Features: Safety Recalls, OEM Campaigns and TSBs - Access the most accurate and • up-to-date database of TSBs available (most available within two weeks of 15.13.1 How do I access ShopKey Pro? OEM publication). -
Page 202: How Do I Change The Default Application
SureTrack® & Repair Information Shopkey Pro FAQ’s 15.13.2 How do I change the default application? ShopKey Pro is the default application that opens when the SureTrack & Repair Information icon is selected from the Home screen on your diagnostic tool. Username If needed, you can change the default application to ProDemand, by selecting the Shop Tech 1... -
Page 203: Section 16: Shopstream Update Tool (Sst)
ShopStream Update Tool (SST) Section 16 Introduction 16.1 Terminology This section describes the ShopStream Update Tool (SST), a maintenance The following terms are used in this section and throughout this manual as program that automatically keeps your diagnostic software up-to-date. described below: Software Upgrade - a new diagnostic software version. -
Page 204: Basic Operation
ShopStream Update Tool (SST) Basic Operation 16.3 Basic Operation The SST program is normally running in the Windows background and available from the Windows system tray. The program can be accessed as follows: SST icon in the Windows system tray - opens the SST program menu. •... -
Page 205: End User License Agreement
License Agreement. The diagnostic tool should not be initially operated until the End User License Agreement is read. Use of the device acknowledges your acceptance of the End User License Agreement. The Snap-on Incorporated Software End User License Agreement is available at: https://eula.snapon.com/diagnostics... - Page 206 ShopStream Update Tool (SST) Manual Software Download To manually download software: To view the update status window (Figure 16-7), select Show Progress from the SST icon menu (Figure 1. Select the SST icon in the system tray to open the menu (Figure 16-5).
-
Page 207: Installing Software Updates
ShopStream Update Tool (SST) Installing Software Updates For SST program updates (only) - if you have the Automatic Update setting To install a software update: ”on”, the update will be installed automatically. See Automatic Update setting 1. Select the software update available message (Figure 16-8), or the SST icon on page 197 for additional information. -
Page 208: Installing Software Upgrades
The installation will take approximately 30 minutes. If the Install Now Install Later installation is interrupted, contact Snap-on Diagnostics Customer Care for assistance. See the Snap-on contact information at the front of this manual. Figure 16-11 Typical upgrade installation window NOTE 2. Select an installation option to continue: Upgrade Detail—opens a PDF file describing the details of the software... - Page 209 ShopStream Update Tool (SST) Installing Software Upgrades 7. Turn the diagnostic tool off, then turn it on (re-boot). 8. From the toolbar, select Menu > Help > Version Info to confirm the new version number is installed. 9. To activate your SureTrack access that comes with your new software upgrade, see ShopStream Update Tool (SST) on page 196.
-
Page 210: Section 17: The Snap-On® Cloud
Code Scan. Main Topic Links 17.2 Important Notes Registration - Getting Started page 203 • To use the Snap-on Cloud, account setup and diagnostic tool Wi-Fi connection is • Using the Snap-on Cloud page 206 • required. Snap-on Cloud - New User Registration page 204 –... -
Page 211: Snap-On Cloud - New User Registration
13.To login and use the Snap-on Cloud, see Using the Snap-on Cloud page 206. Your diagnostic tool is now registered to your Snap-on Cloud online account. Files will be automatically sent (only when connected to Wi-Fi) to your online account from the device. -
Page 212: Snap-On Cloud - Shopkey Pro Or Suretrack User Setup
11. To login and use the Snap-on Cloud, see Using the Snap-on Cloud page 206. Your diagnostic tool is now registered to your Snap-on Cloud online account. Files will be automatically sent (only when connected to Wi-Fi) to your online account from the device. -
Page 213: Snap-On Cloud Get Connected Screen
PIN Code: XXXXXXX 17.4.1 Logging on the Snap-on Cloud (registered user) Activation Code: XXXXXXXXX Logging in to Snap-on Cloud (registered user): 1. From the Home screen select the Snap-on Cloud icon (Figure 17-4). If using your mobile device or PC visit ALTUSDRIVE.com. -
Page 214: Navigating Snap-On Cloud (Toolbars)
(Figure 17-9). Each file is displayed in a navigation card. Figure 17-5 17.4.2 Navigating Snap-on Cloud (Toolbars) The upper and lower toolbars are available from all screens. The upper toolbar includes a menu icon (right side) (Figure 17-6). This menu allows... - Page 215 ALTUSDRIVE.com 4— Menu Icon - options: - Download - Select to download the file to your device. - Delete - Select to delete the file from the Snap-on Cloud. 5— Favorites Icon - See on page 213 for additional information.
- Page 216 The Snap-on® Cloud Using the Snap-on Cloud The following describes File Detail card features. 7— Active Tag(s) - Displays the active tag(s). Tags can include the “good” or “bad” entry from the Known Good / Bad checkboxes, and text entered in the file Name, Description and Tag fields.
- Page 217 The Snap-on® Cloud Using the Snap-on Cloud Sharing all Files (Share My Gallery) To share your entire gallery (all files in My Files): 1. Select the Menu icon (Figure 17-15) from the upper toolbar. Contact 1 Contact 2 Figure 17-14 2.
-
Page 218: Search
Shop Files links are useful when sharing a file with a customer that is not a registered Snap-on Cloud user, that just needs to see the file, and/or may need access to the file in the future. - Page 219 The Snap-on® Cloud Using the Snap-on Cloud 2. Select an option (Figure 17-19) from the pop-up window. To share all files in Shop Files: 1. From Shop Files, select the Menu icon (Figure 17-20) from the upper toolbar. NOTE Some selections may be grayed out or not shown, indicating the option is not supported on your device/system.
-
Page 220: Favorites
The Snap-on® Cloud Using the Snap-on Cloud 17.4.6 Favorites 17.4.7 Profile The Favorites screen displays all the files selected as favorites (Figure Select Profile (Figure 17-23) to open the Profile Manager menu. 17-22). Figure 17-22 Figure 17-23 To set a file as a ”Favorite”, select the Favorite icon (star symbol) to highlight the icon. - Page 221 (Figure 17-24) allows you to: Open Profile Manager, see Using Profile Manager on page 215 • Logout of the Snap-on Cloud, see Logging Out of the Snap-on Cloud • page 217 Add others to your Network, see • Logging Out of the Snap-on Cloud...
- Page 222 • Account Expiration Date • NOTE Shop Nickname • Profile Manager opens a new browser tab. To return to the Snap-on Cloud Email • after logging out of Profile Manager, you must select the Snap-on Cloud Home Username • Page browser tab.
- Page 223 The Snap-on® Cloud Using the Snap-on Cloud Personal Information Expertise This screen manages the following personal account information (Figure (SureTrack users only) - Select the vehicles from the list that you have expertise with. 17-28): When a question is asked within the SureTrack community about one of the selected First Name •...
- Page 224 Using the Snap-on Cloud When finished select Save to save and link the device to your account. Logging Out of the Snap-on Cloud To log out of the Snap-on Cloud, select Profile from lower toolbar, then select Logout (Figure 17-32).
-
Page 225: Section 18: Adas Recalibration Report
Attachment panel, see Vehicle History on page 161. Forward Sensing Camera All reports are uploaded to the Snap-on Cloud automatically when they are Forward Sensing Camera Static Aiming created. See The Snap-on® Cloud on page 203, for more information on using the Snap-on Cloud. -
Page 226: Saving The Report (Typical Navigation)
18-2). The ADAS Report form is displayed (Figure 18-3). Figure 18-3 9. Select Save (Figure 18-3) to save the report within the diagnostic tool and automatically upload it to the Snap-on Cloud. NOTE Selecting Print will not save the report. -
Page 227: Printing The Report
The report form is saved as a PDF file that can be accessed from the following locations: Vehicle Record attachment field. • ADAS Report Data Folder (in Data Manager). • Snap-on Cloud • As reference the file is located in the following path: C:\Users\ShopstreamUser\Documents\ShopStream\ADAS Report Data Folder\ (date).pdf. 18.1.2 Printing the Report Before you can print you must install a printer and have a current version of Adobe Reader installed. - Page 228 ADAS Recalibration Report ADAS Recalibration Report Form Printing (From Vehicle History Record) To print the file from the Vehicle History Record: 1. Select Vehicle History from the Home Screen 2. Select and open the vehicle record from the list. 3. Select and open the ADAS Report PDF file from the attachments box (Figure 18-7).
-
Page 229: Section 19: Maintenance
Maintenance Section 19 Introduction 19.1 Cleaning This section describes typical maintenance and care procedures for your diagnostic 19.1.1 Cleaning the Diagnostic Tool tool and components. Periodically perform the following tasks to keep your diagnostic tool in proper Main Topic Links working order: Check the housing, cables and connectors for dirt and damage before and after •... -
Page 230: Battery Pack
Maintenance Battery Pack Keep the following in mind when using and handling the battery pack: IMPORTANT Do not short circuit battery pack terminals. • Do not use any abrasive cleansers or automotive chemicals on the CSM. Do not immerse the diagnostic tool or battery pack in water, or allow water to •... -
Page 231: Battery Pack Replacement
4. Tighten the two battery pack screws. IMPORTANT 19.2.3 Battery Pack Disposal Replace the battery pack with a Snap-on replacement battery pack only. Always dispose of a lithium-ion battery pack according to local regulations, which vary for different countries and regions. The battery pack, while non-hazardous To replace the battery pack: waste, does contain recyclable materials. - Page 232 Maintenance Screen Protector Installation 19.3 Screen Protector Installation Touch screen protectors are available as optional equipment (contact your sales representative to order). The following procedure describes typical installation procedures. Items recommended for installation: Microfiber type cloth (lint-free) • Flexible straight edged tool (e.g. small squeegee, plastic card) •...
- Page 233 Maintenance Stylus Tip Replacement (Touch Screen) 19.4 Stylus Tip Replacement (Touch Screen) Periodically the capacitive stylus tip may need to be replaced. There are two styles of removable stylus tips. Style “A” (Figure 19-5) - To remove, unthread the tip counterclockwise. To install a new stylus tip, thread it on clockwise until seated.
- Page 234 Download the latest version of eula.snapon.com/diagnostics this manual and other related technical documentation from the Snap-on Diagnostics website. Patent Information For a listing of Snap-on products that are protected by patents in the United States and elsewhere, visit: patents.snapon.com ZEEMS342A Rev. F 3-A-20 NA...
- Page 235 15 of the FCC rules. These limits are designed to Operating System (OS) provide reasonable protection against harmful interference in a residential ® Your ZEUS delivers exclusive coverage, more capabilities, superior performance installation. This equipment generates, uses and can radiate radio frequency energy ®...
Need help?
Do you have a question about the Zeus and is the answer not in the manual?
Questions and answers